Parts of a whole
Pies, donuts and treemaps that split a total into its parts.
The idea
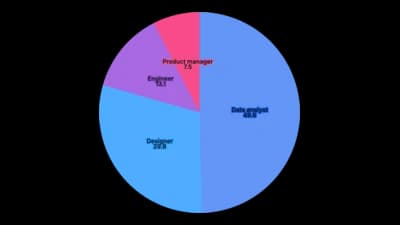
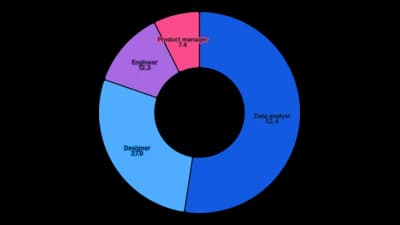
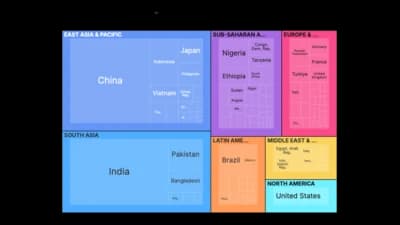
Part-to-whole charts split a total into the parts it is made of. They work when the parts genuinely add up to a meaningful whole, such as a budget, a vote or a market, and the share each part takes is the story. Keep the parts few, or nest them, because small slices are where these charts stop being readable.
Where to use it
- Budgets, spending and revenue breakdowns
- Market share and survey answer shares
- Election results and seat counts
- Nested categories, such as departments within divisions
Templates
Start from any of these templates and swap in your own data.
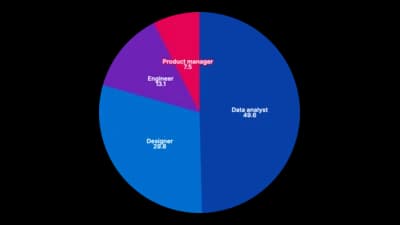
Pie chart
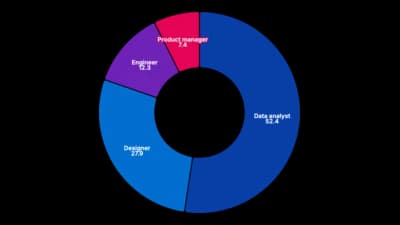
Donut chart
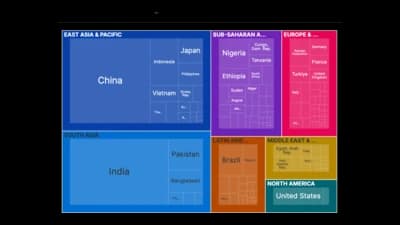
Treemap
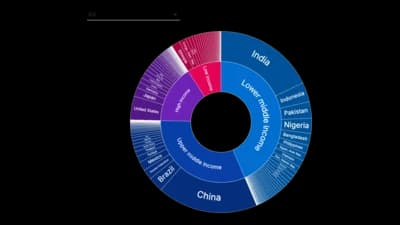
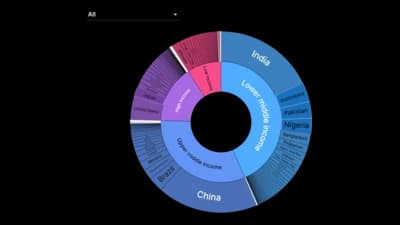
Sunburst
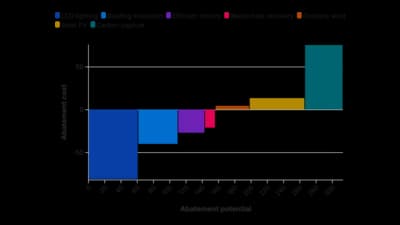
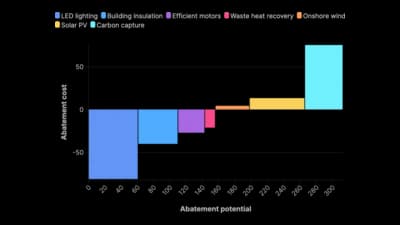
Abatement Curve
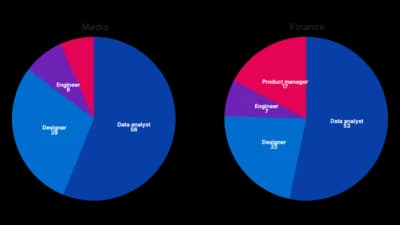
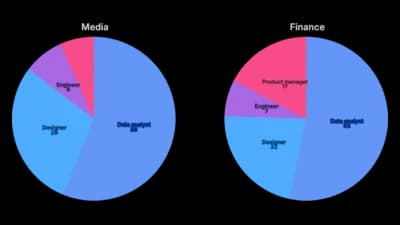
Grid of pie charts
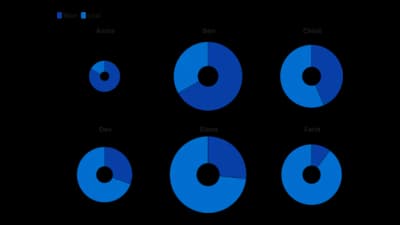
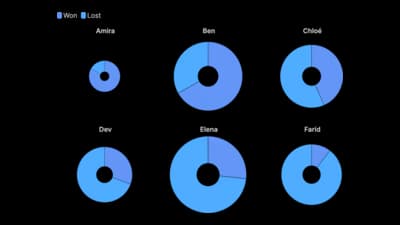
Scaled donuts
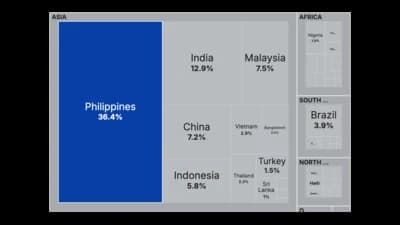
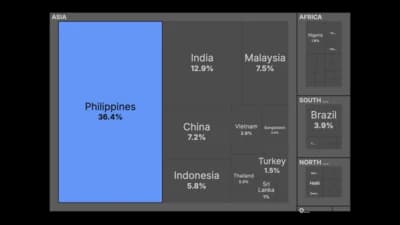
Treemap with highlighting
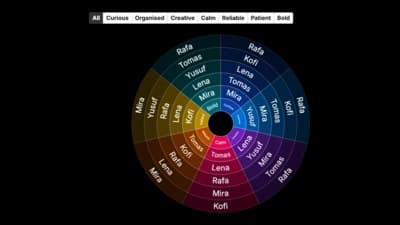
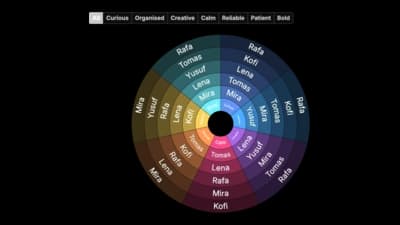
Ranking Wheel
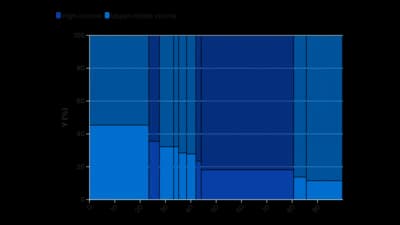
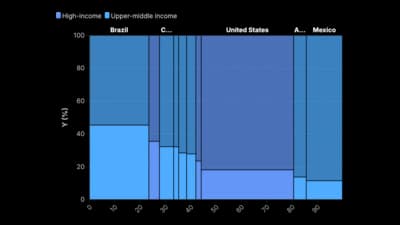
Marimekko by category
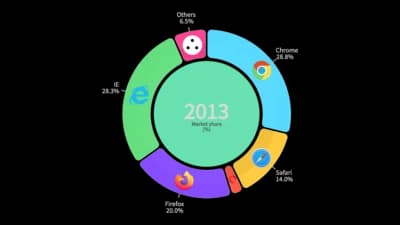
Racing Pie
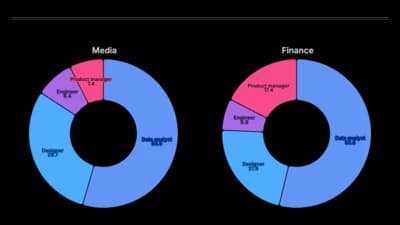
Grid of donut charts
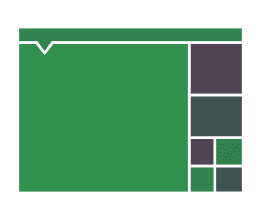
Stock Market Map
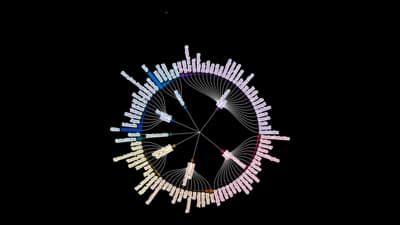
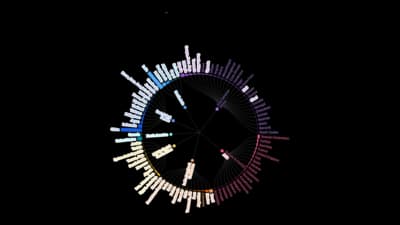
Radial tree
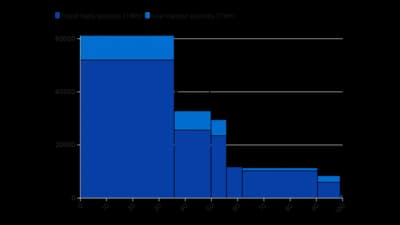
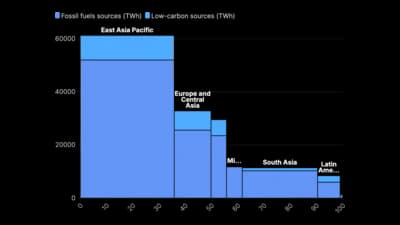
Stacked column mekko

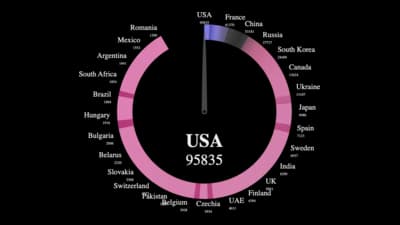
Gradient Ring
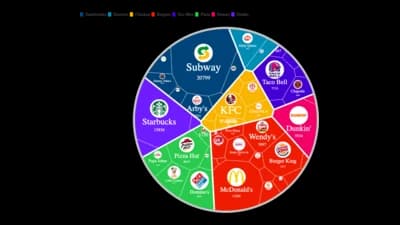
Voronoi treemap
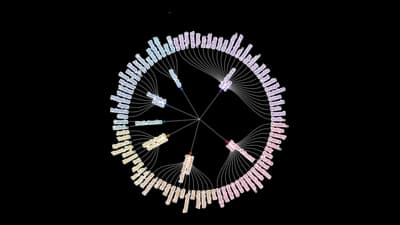
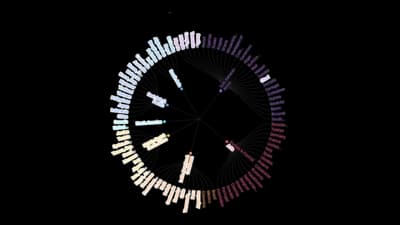
Radial dendrogram
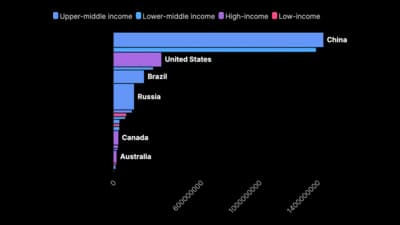
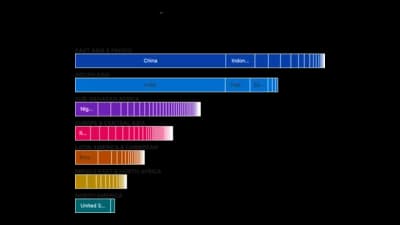
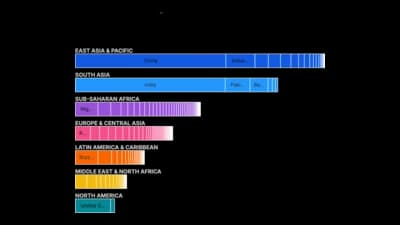
Bar mekko
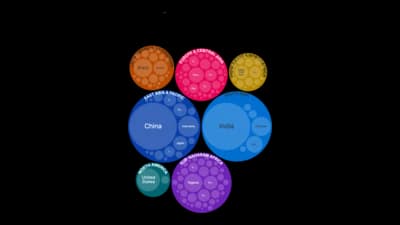
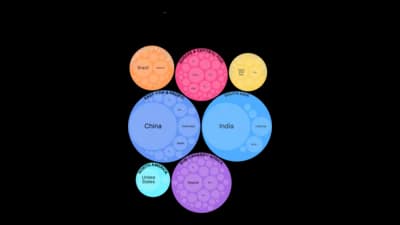
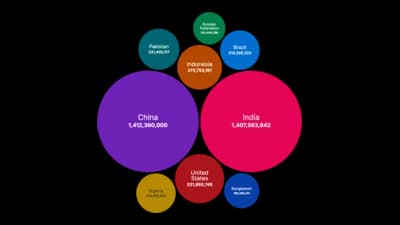
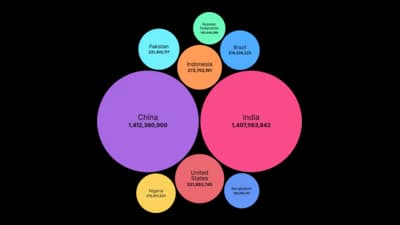
Packed circles
Show all 23 templates
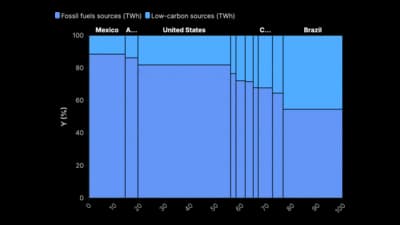
Ready to Transform Your Data Storytelling?
Join +6,000 creating stunning charts and video visuals with the all-in-one AI data visualization platform.
PlotSet helps data analysts, marketers, and designers transform complex data into clear, compelling stories. start creating today.
Substack
Join our Substack community to share ideas and learn from fellow data visualization enthusiasts.

Discord
Collaborate with creators and data enthusiasts on our Discord server for real-time collaboration.