Bar and column
Bars and columns for comparing sizes across categories.
The idea
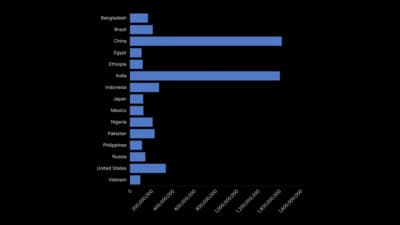
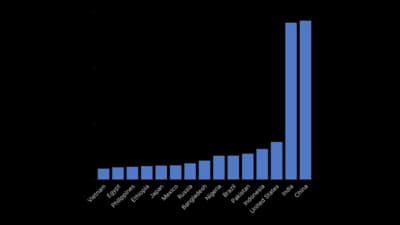
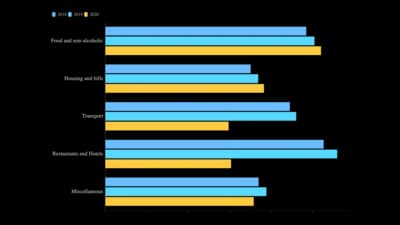
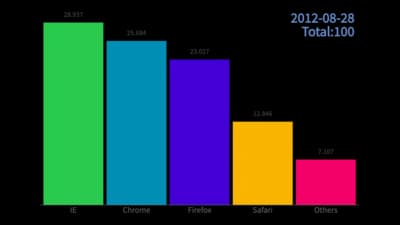
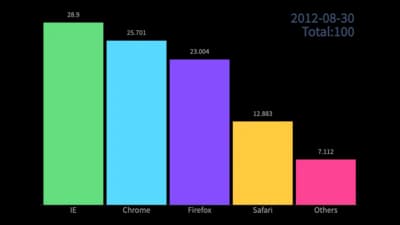
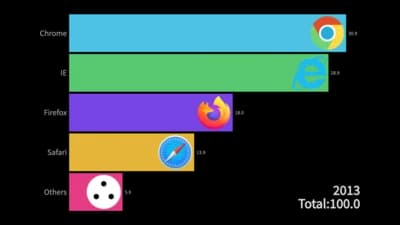
Bar and column charts compare values by length along a shared baseline, the most accurate thing people read in any chart. That is why they carry most of the comparisons you will ever publish. Group them to compare two measures, stack them to show totals and their parts, and sort them so the ranking reads at a glance.
Where to use it
- Comparing sales, votes or survey answers across categories
- This year against last year, or target against actual
- Totals broken into their parts with stacked bars
- Showing many categories with long labels as horizontal bars
Templates
Start from any of these templates and swap in your own data.
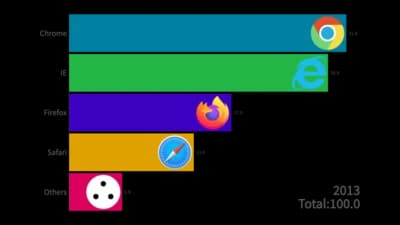
Bar chart
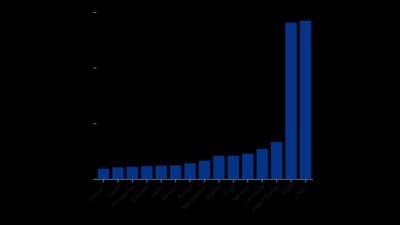
Column chart
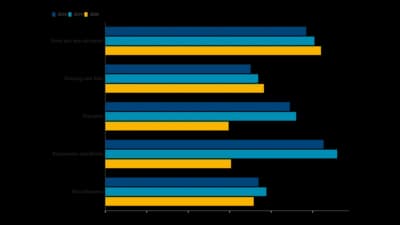
Grouped Bar Chart
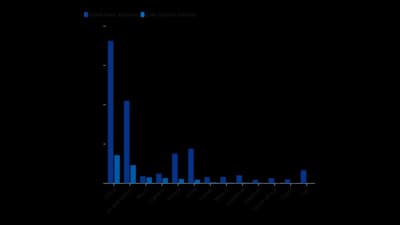
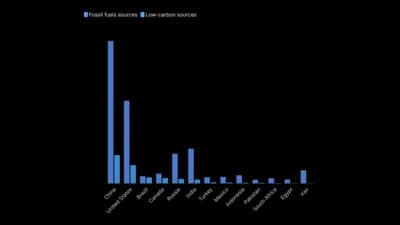
Column chart (grouped)
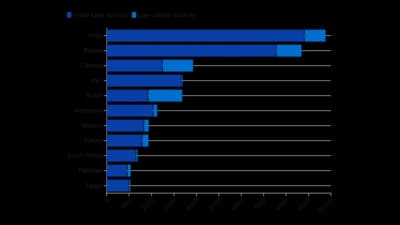
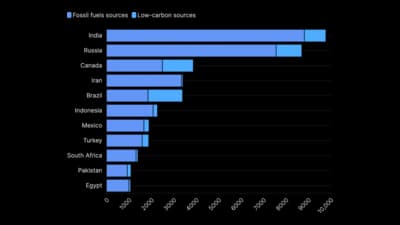
Bar chart (stacked)
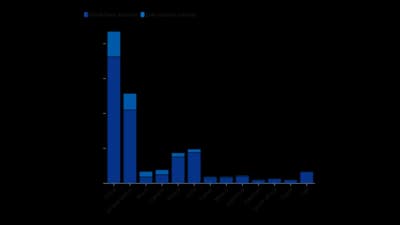
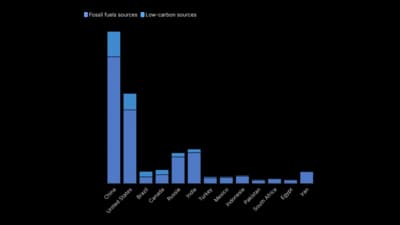
Column chart (stacked)
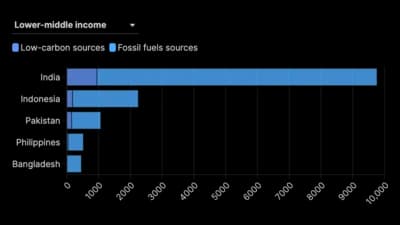
Bar chart with filter
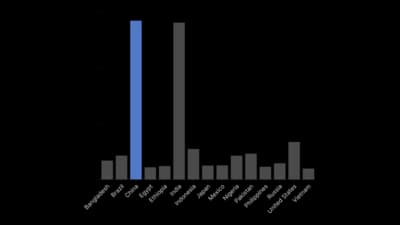
Column chart (with highlight)
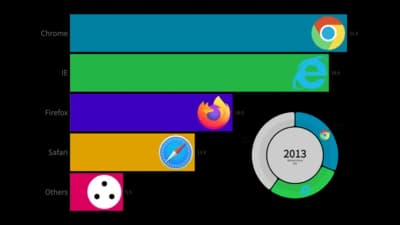
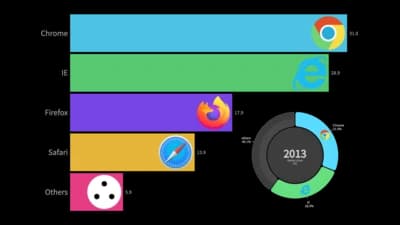
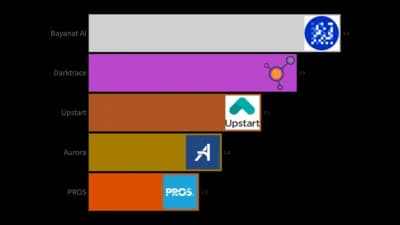
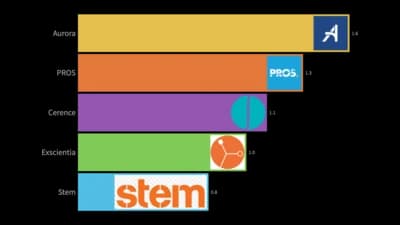
Dual Racing
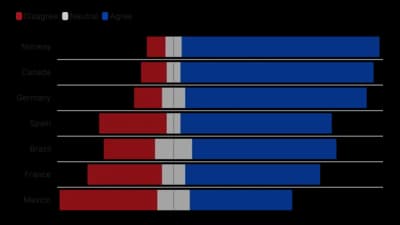
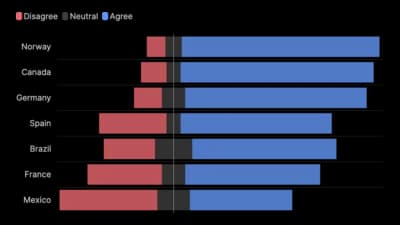
Diverging stacked bar chart
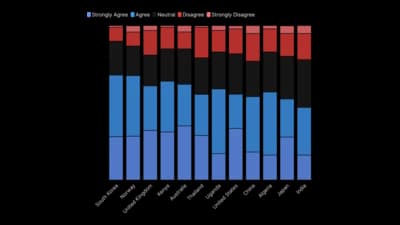
Stacked column chart (Likert scale)
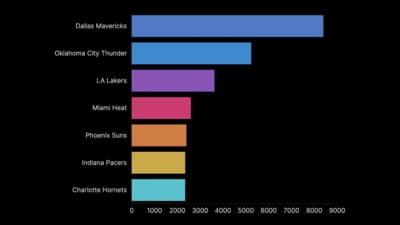
Color by row bar chart
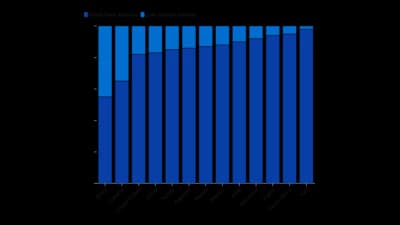
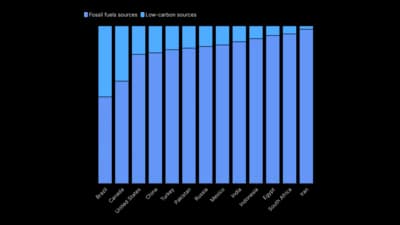
Column chart (proportional)
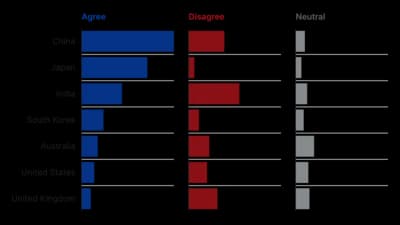
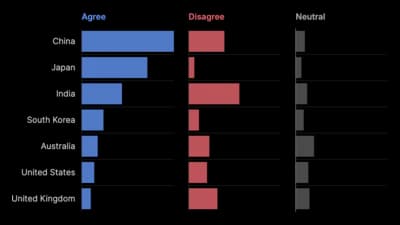
Survey bars
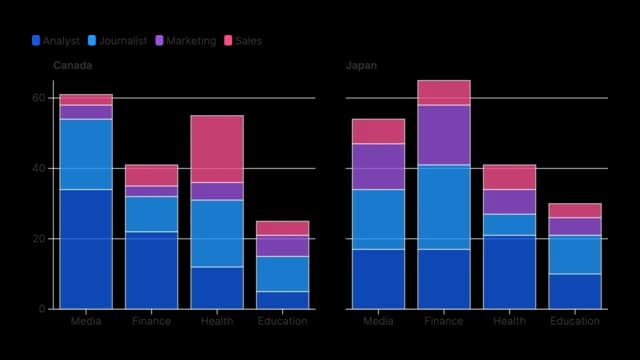
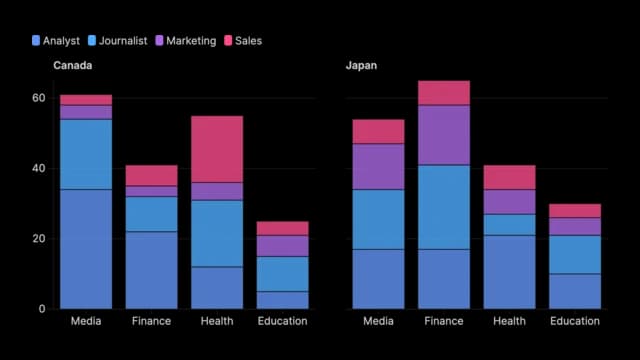
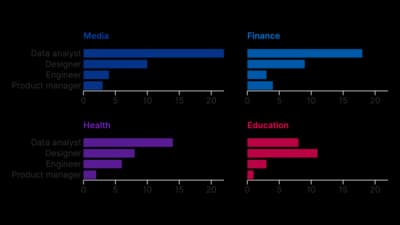
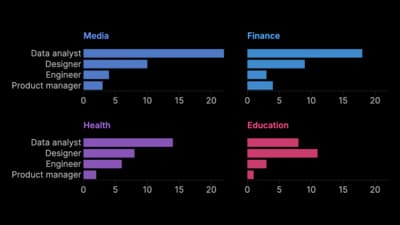
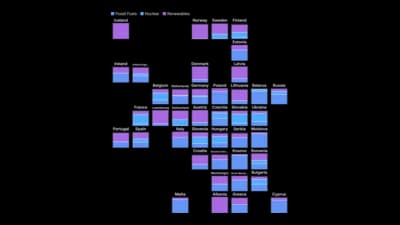
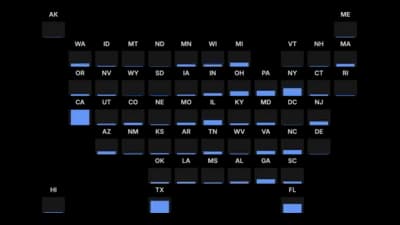
Grid of stacked column charts
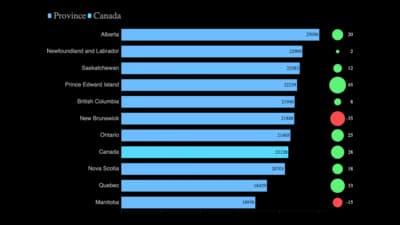
Bar chart (change indicator)
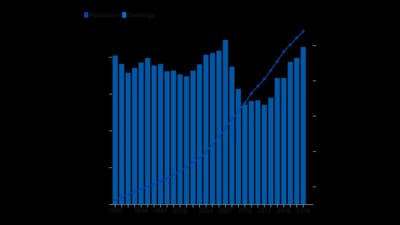
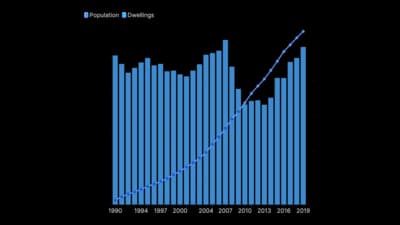
Line + column
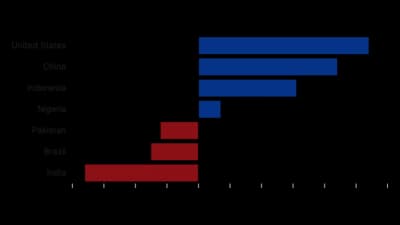
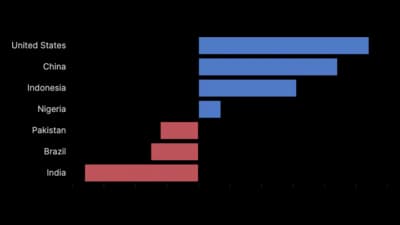
Diverging bar chart
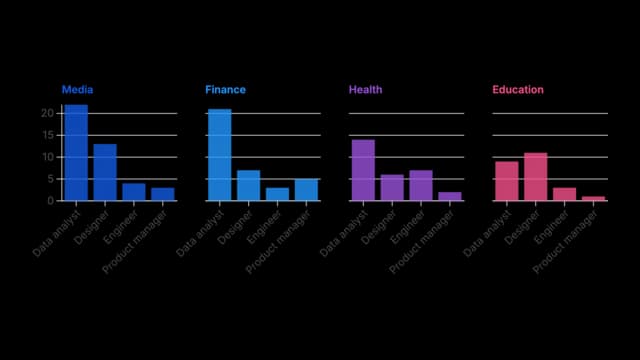
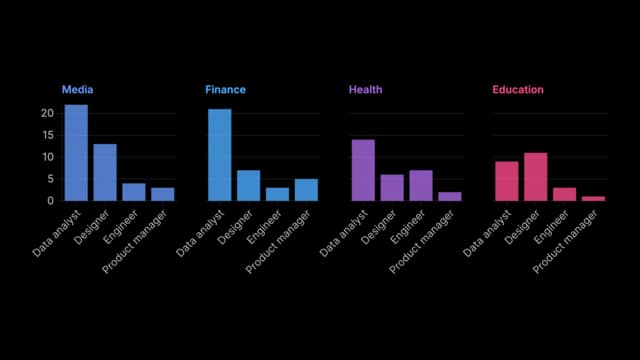
Grid of column charts
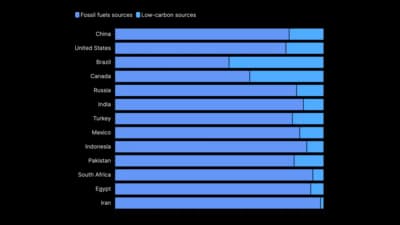
Bar chart (proportional)


Ready to Transform Your Data Storytelling?
Join +6,000 creating stunning charts and video visuals with the all-in-one AI data visualization platform.
PlotSet helps data analysts, marketers, and designers transform complex data into clear, compelling stories. start creating today.
Substack
Join our Substack community to share ideas and learn from fellow data visualization enthusiasts.

Discord
Collaborate with creators and data enthusiasts on our Discord server for real-time collaboration.