Radial
Circular charts for scores, cycles and progress.
The idea
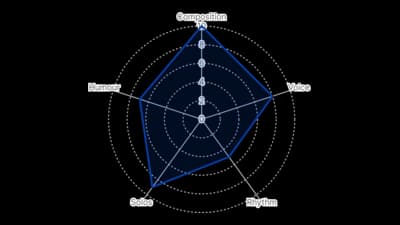
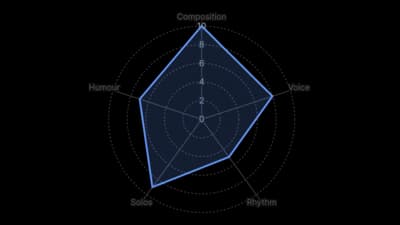
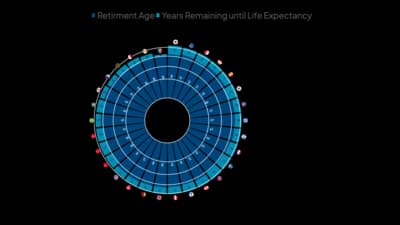
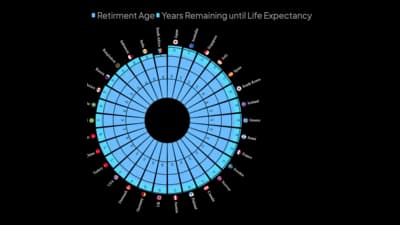
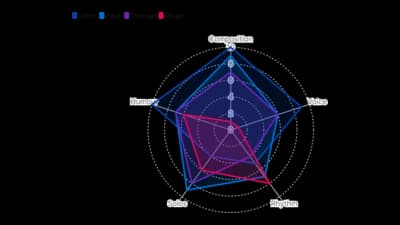
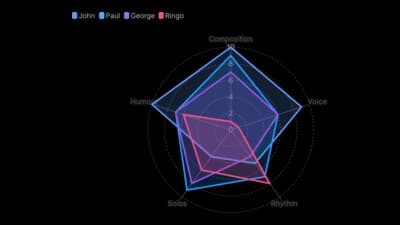
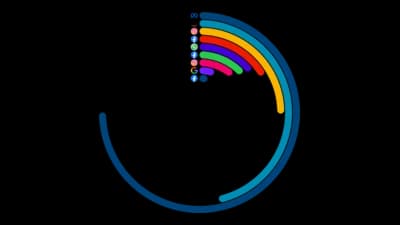
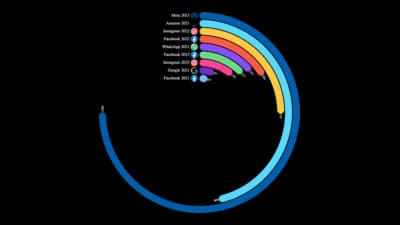
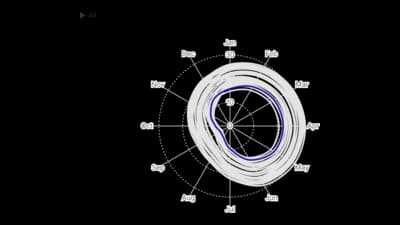
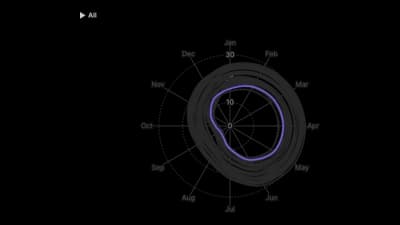
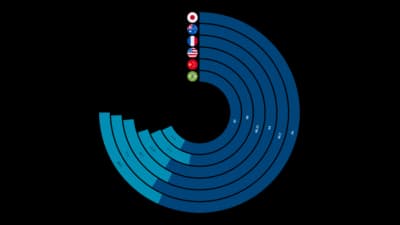
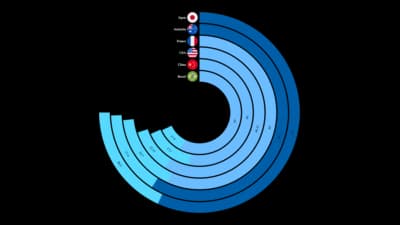
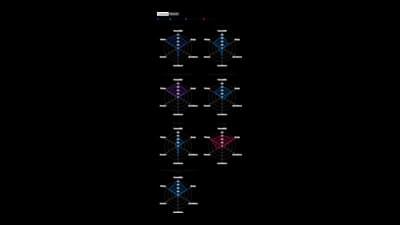
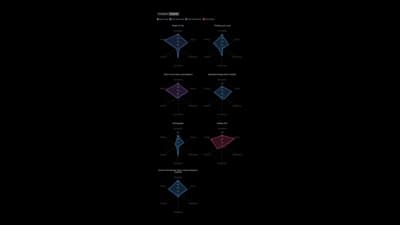
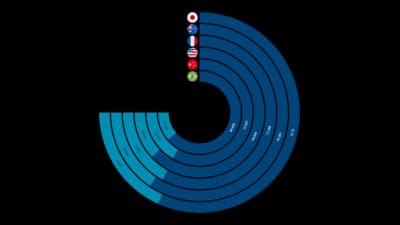
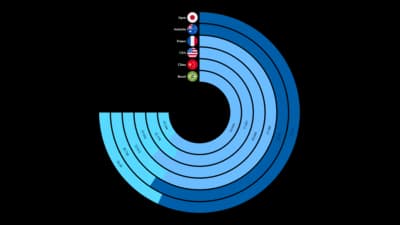
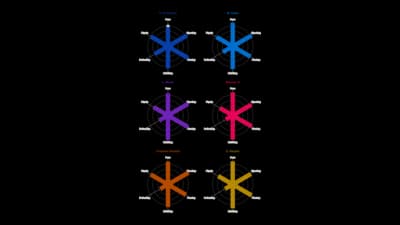
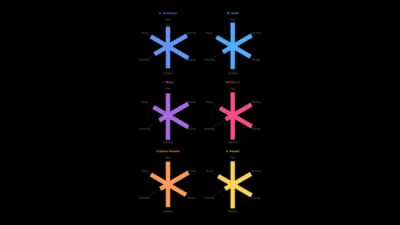
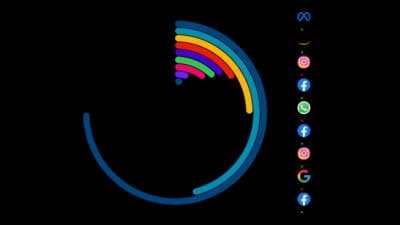
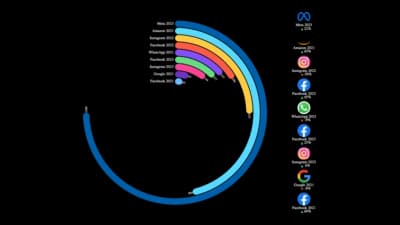
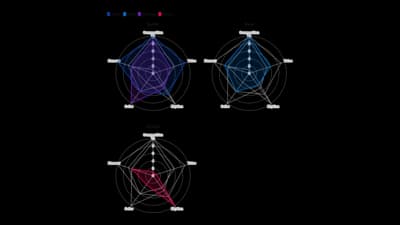
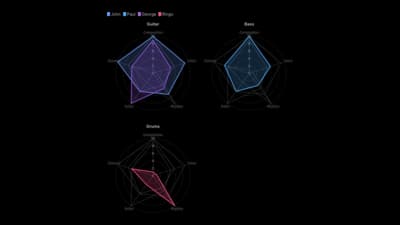
Radial charts wrap values around a circle. Radar charts score one item across several criteria, polar charts show cycles such as months of the year, and gauges show progress toward a goal. They are striking and compact, but angles are harder to compare than lengths, so keep the number of values small.
Where to use it
- Scoring products or players across several criteria
- Seasonal and monthly cycles
- Progress toward a target or KPI
- Compact dashboard tiles
Templates
Start from any of these templates and swap in your own data.
Ready to Transform Your Data Storytelling?
Join +6,000 creating stunning charts and video visuals with the all-in-one AI data visualization platform.
PlotSet helps data analysts, marketers, and designers transform complex data into clear, compelling stories. start creating today.
Substack
Join our Substack community to share ideas and learn from fellow data visualization enthusiasts.

Discord
Collaborate with creators and data enthusiasts on our Discord server for real-time collaboration.