Timelines and schedules
Events, phases and plans laid out along time.
The idea
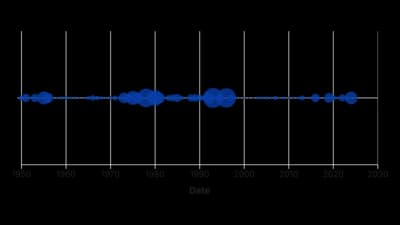
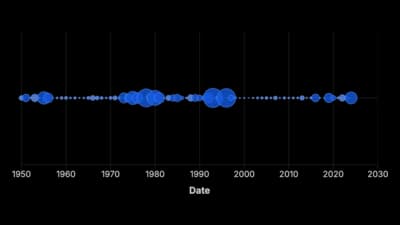
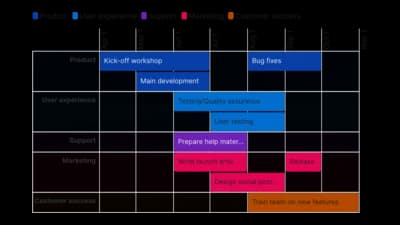
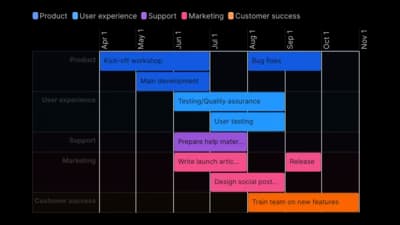
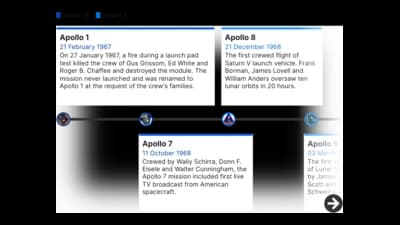
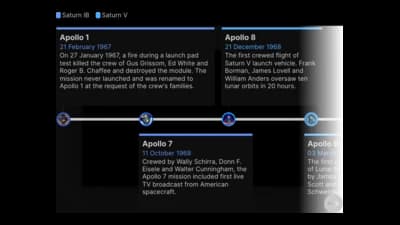
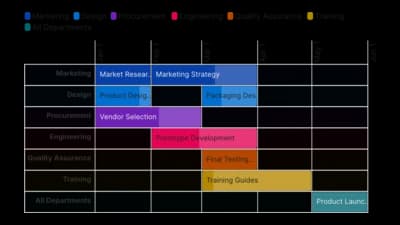
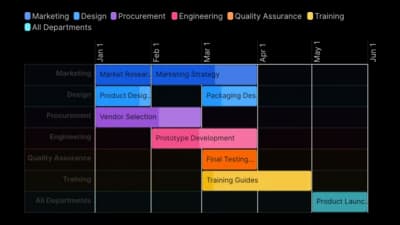
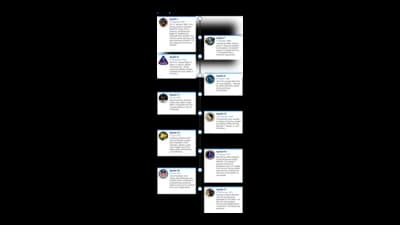
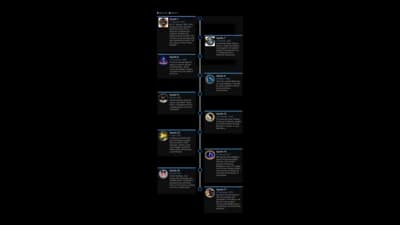
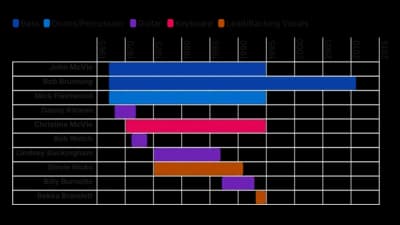
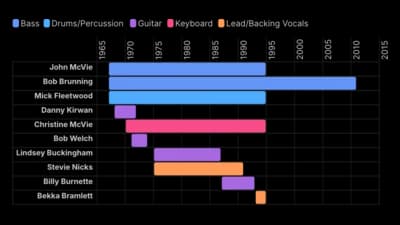
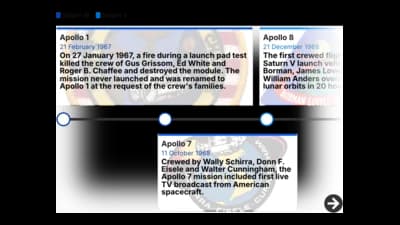
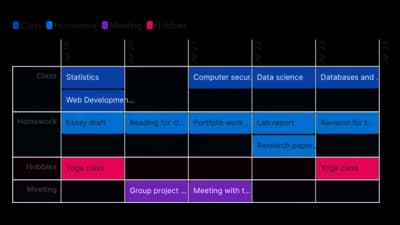
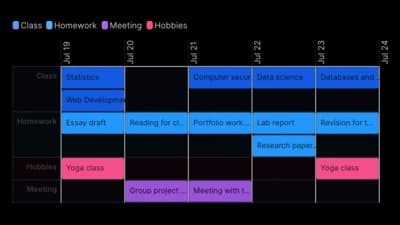
Timelines place events and periods on a time axis so readers see order, duration and overlap. A timeline tells the story of what happened when; a Gantt chart shows tasks as bars from start to finish. Use them when the sequence is the point, not a measured value.
Where to use it
- Company and product histories
- Project plans and roadmaps
- Historical events and biographies
- Schedules with overlapping phases
Templates
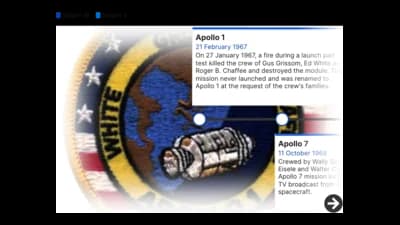
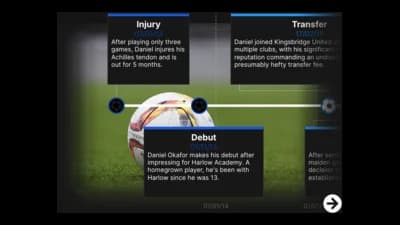
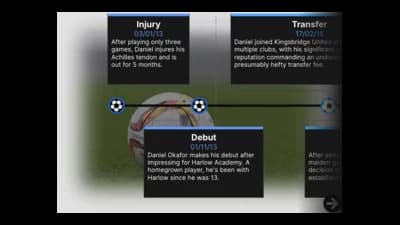
Start from any of these templates and swap in your own data.
Ready to Transform Your Data Storytelling?
Join +6,000 creating stunning charts and video visuals with the all-in-one AI data visualization platform.
PlotSet helps data analysts, marketers, and designers transform complex data into clear, compelling stories. start creating today.
Substack
Join our Substack community to share ideas and learn from fellow data visualization enthusiasts.

Discord
Collaborate with creators and data enthusiasts on our Discord server for real-time collaboration.