Line and area
Lines and bands that show how values change over time.
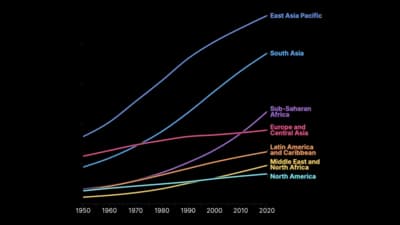
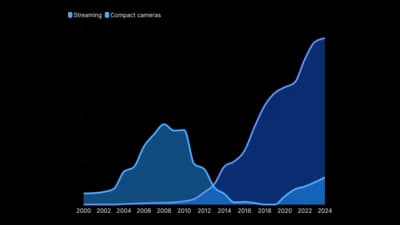
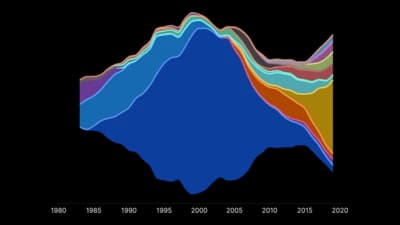
The idea
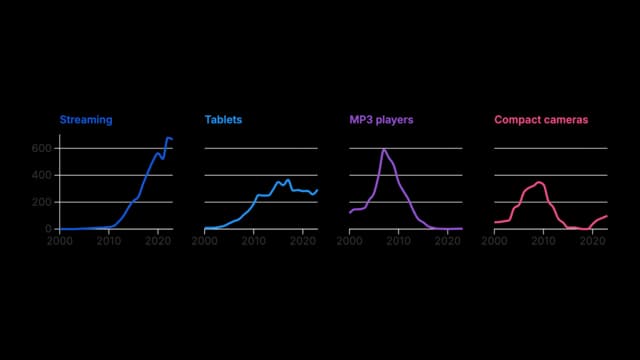
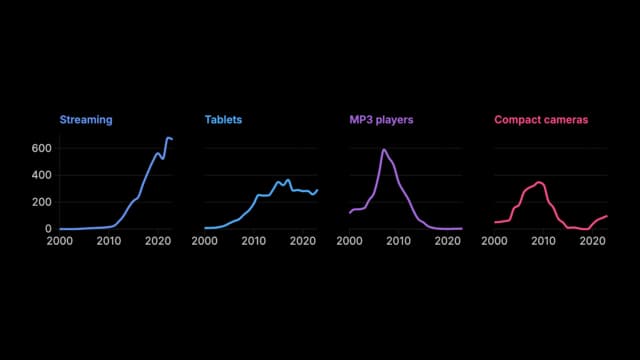
Line and area charts put time on the horizontal axis and let a line or a filled band carry the change. The shape matters more than any single value: rises, falls, seasonality and turning points. Use them when the data is in time order and the reader cares about direction, not only the latest number.
Where to use it
- Sales, traffic and other metrics over months or years
- Prices, rates and indices
- Comparing a few series on the same time scale
- Totals over time, split into their parts
Templates
Start from any of these templates and swap in your own data.
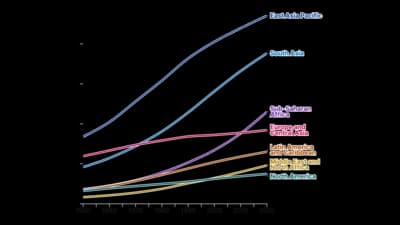
Line chart
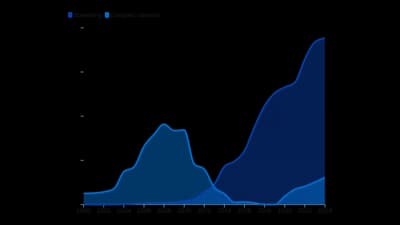
Area chart (unstacked)
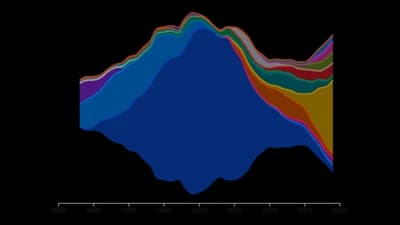
Streamgraph
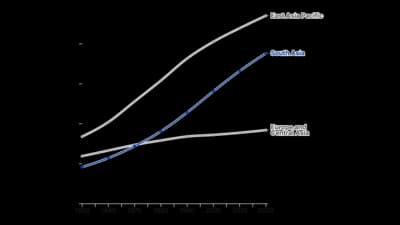
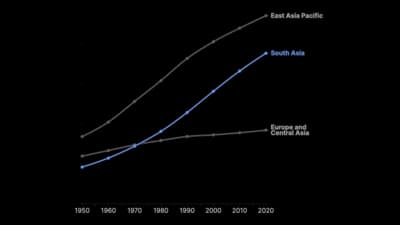
Line chart (with highlight)
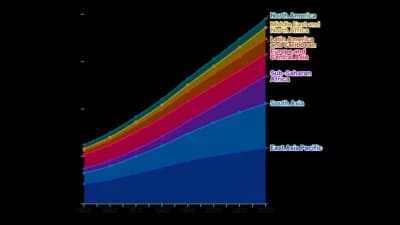
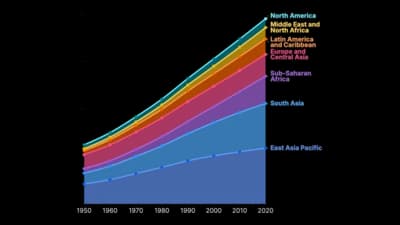
Area chart (stacked)
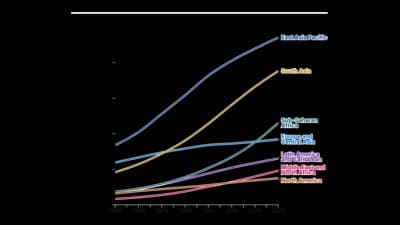
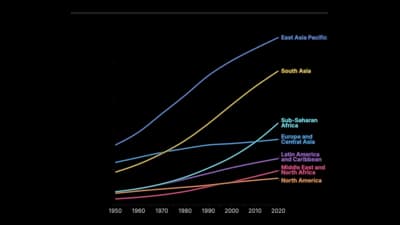
Line chart (searchable)
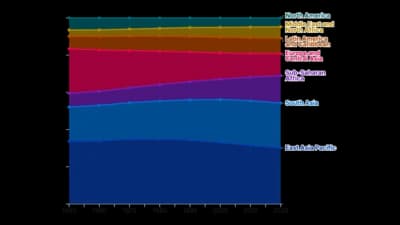
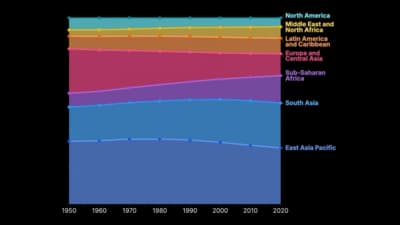
Area chart (proportional)
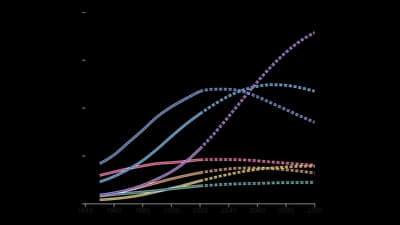
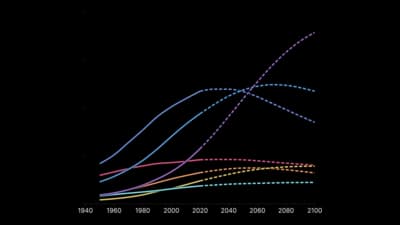
Line chart (projected)
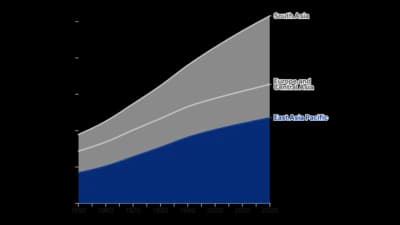
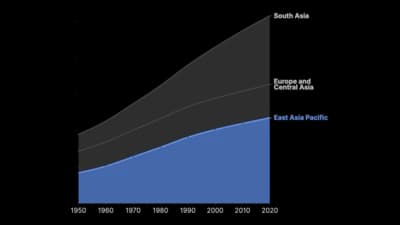
Area chart (with color highlight)
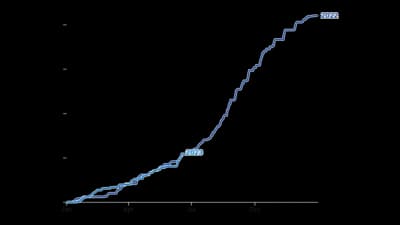
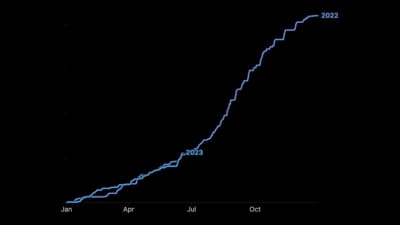
Line chart (year-on-year comparison)
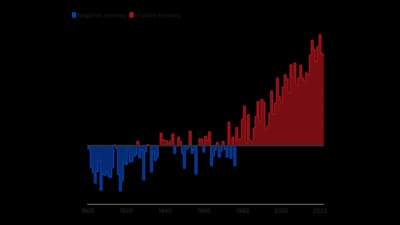
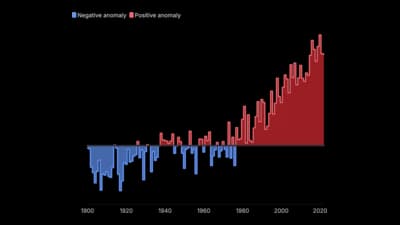
Surplus and Deficit Area Chart
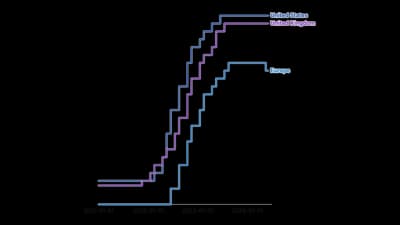
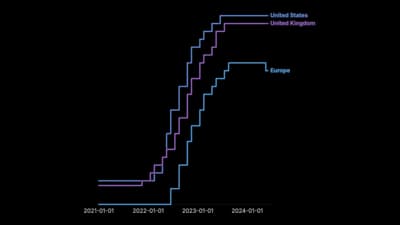
Step chart
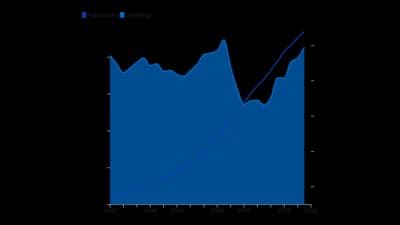
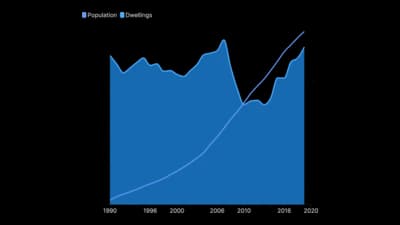
Line + area
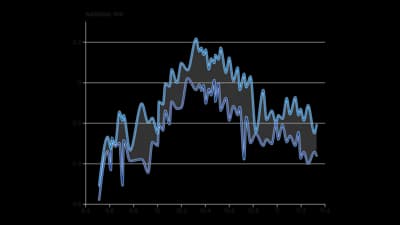
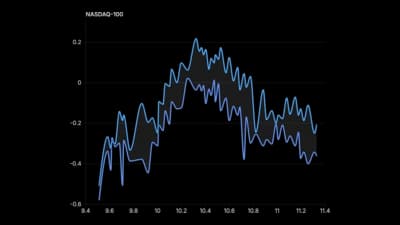
Shaded difference line chart
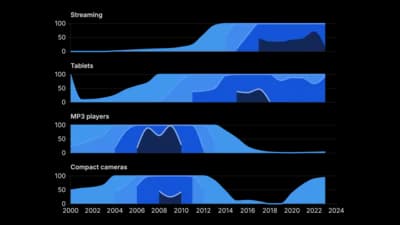
Horizon chart
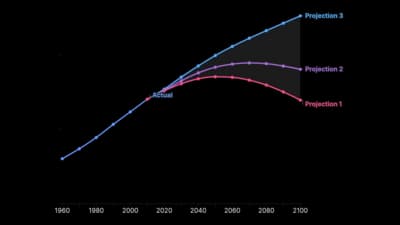
Fan chart
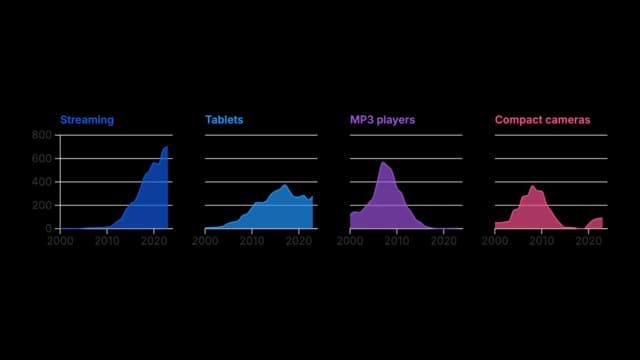
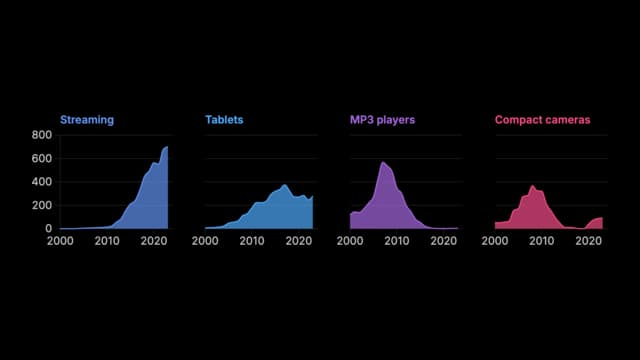
Grid of area charts
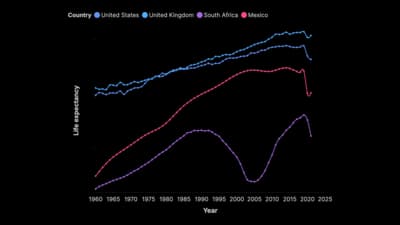
Line chart with markers
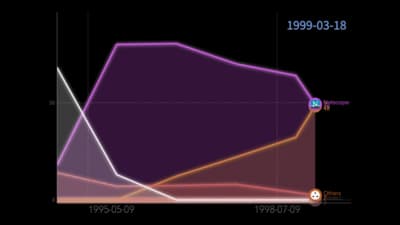
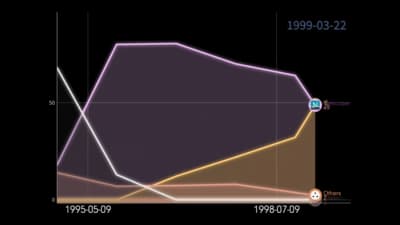
Racing Areas
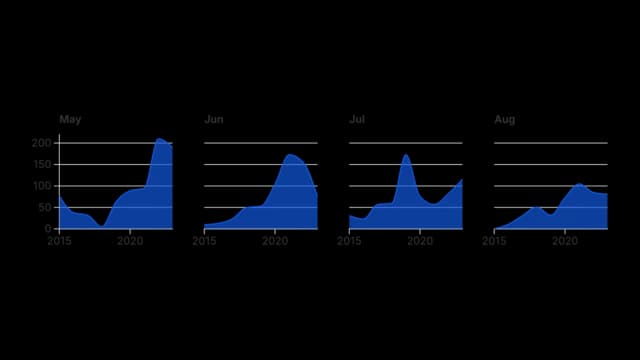
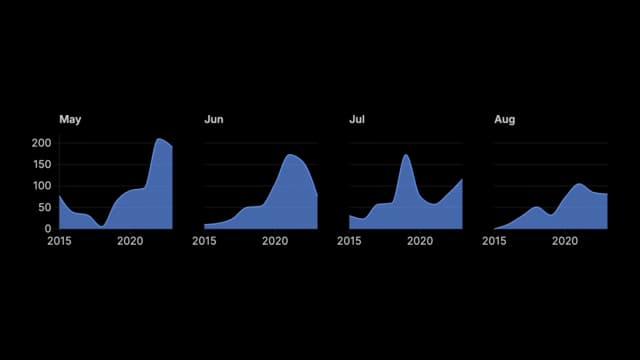
Cycle Plot
Show all 22 templates
Ready to Transform Your Data Storytelling?
Join +6,000 creating stunning charts and video visuals with the all-in-one AI data visualization platform.
PlotSet helps data analysts, marketers, and designers transform complex data into clear, compelling stories. start creating today.
Substack
Join our Substack community to share ideas and learn from fellow data visualization enthusiasts.

Discord
Collaborate with creators and data enthusiasts on our Discord server for real-time collaboration.