Scatter and bubble
Points on two axes that show how measures relate.
The idea
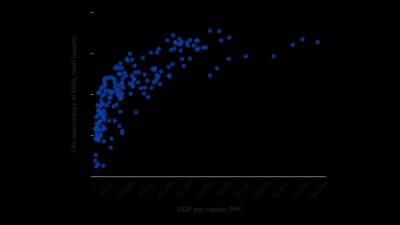
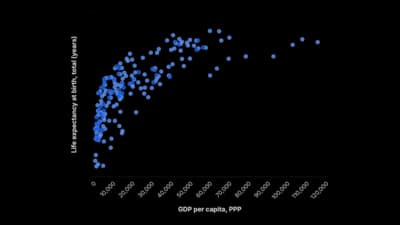
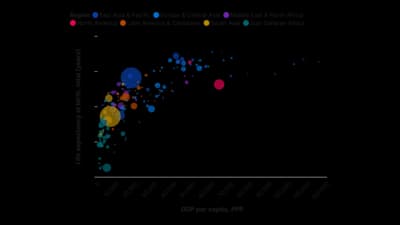
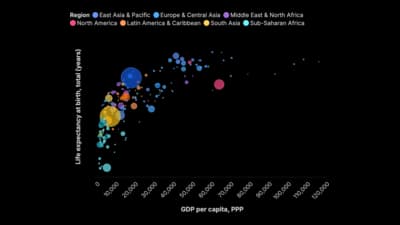
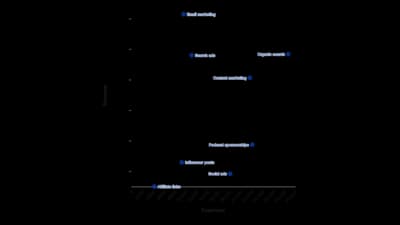
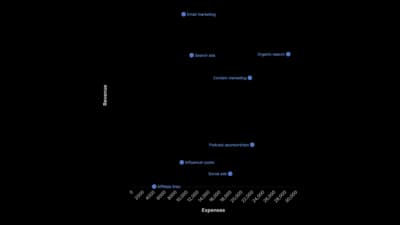
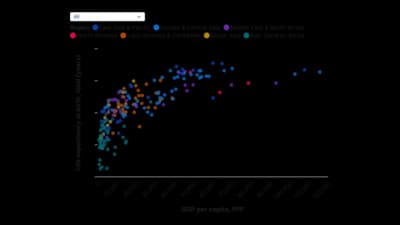
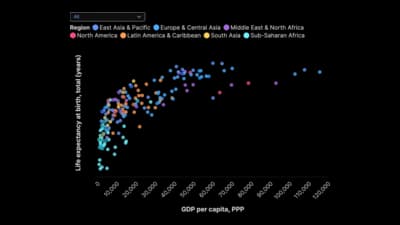
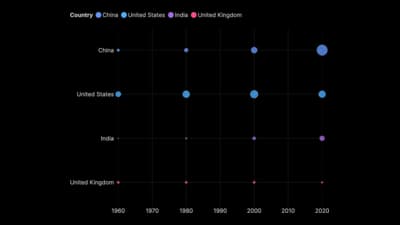
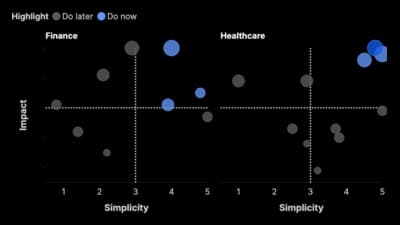
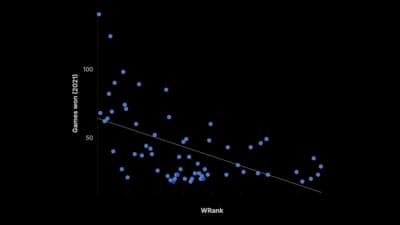
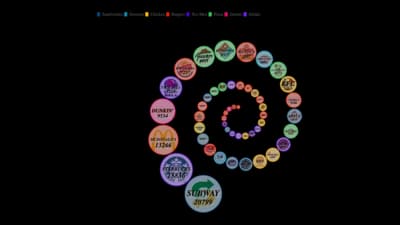
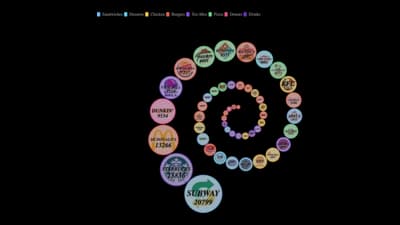
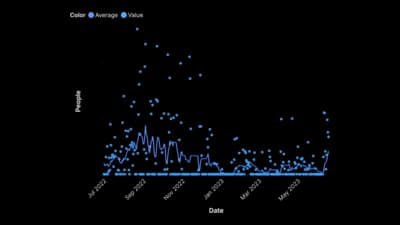
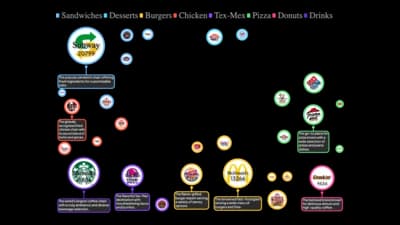
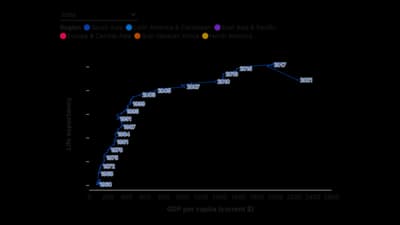
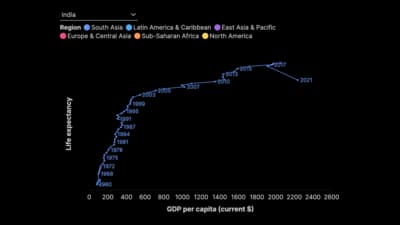
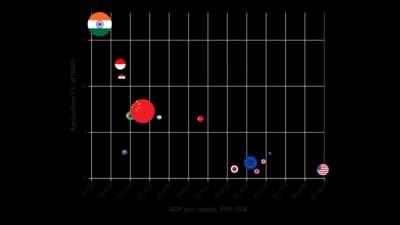
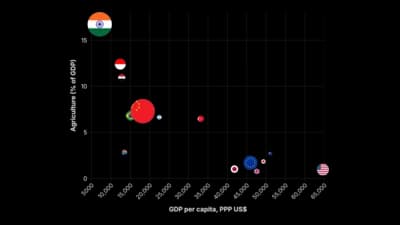
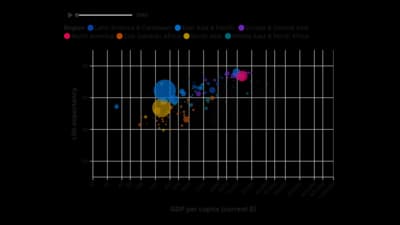
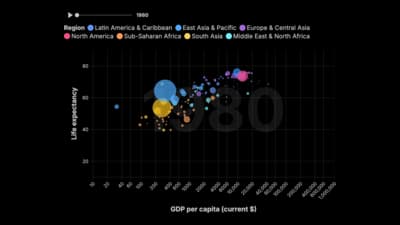
Scatter and bubble charts plot one measure against another, so each point is a thing placed by two values. They reveal correlation, clusters and outliers that tables hide, and a bubble's size can carry a third measure. They reward readers who explore, so give them labels and tooltips.
Where to use it
- Testing whether two measures move together
- Positioning items on two axes, such as cost against value
- Spotting outliers and clusters
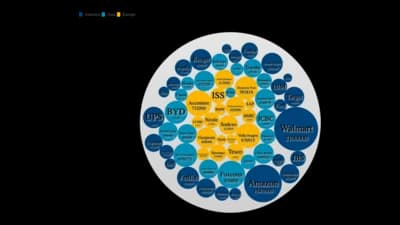
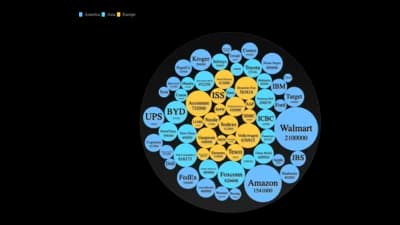
- Comparing countries or companies on three measures at once
Templates
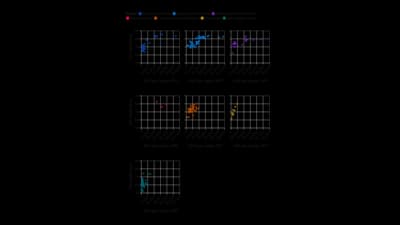
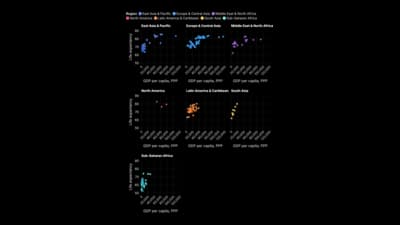
Start from any of these templates and swap in your own data.
Ready to Transform Your Data Storytelling?
Join +6,000 creating stunning charts and video visuals with the all-in-one AI data visualization platform.
PlotSet helps data analysts, marketers, and designers transform complex data into clear, compelling stories. start creating today.
Substack
Join our Substack community to share ideas and learn from fellow data visualization enthusiasts.

Discord
Collaborate with creators and data enthusiasts on our Discord server for real-time collaboration.