Tables and heatmaps
Rows, grids and calendars where colour carries the value.
The idea
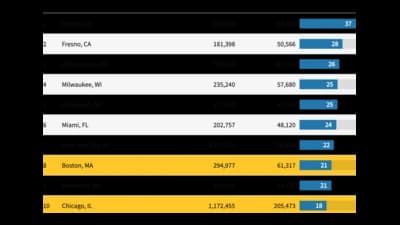
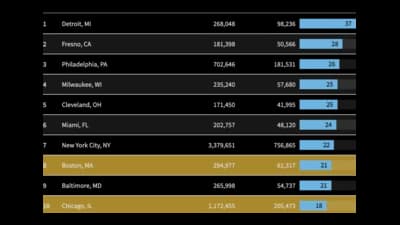
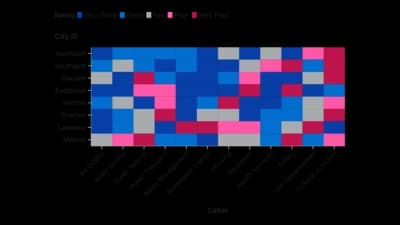
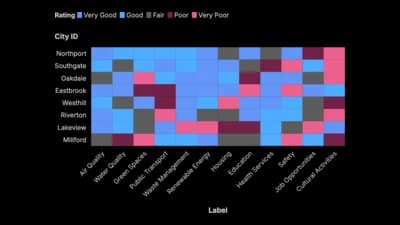
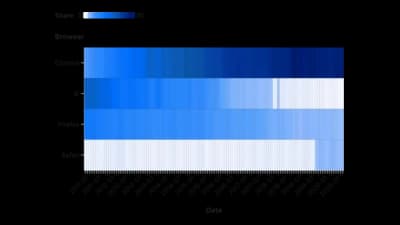
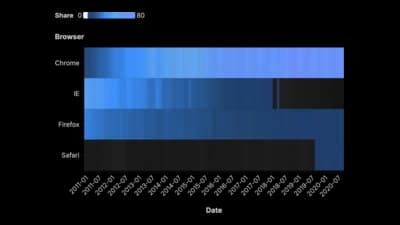
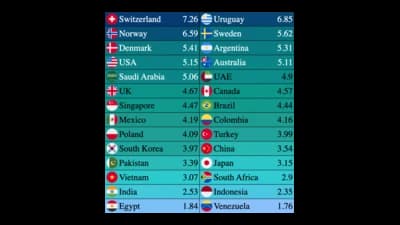
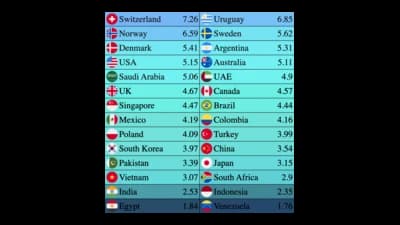
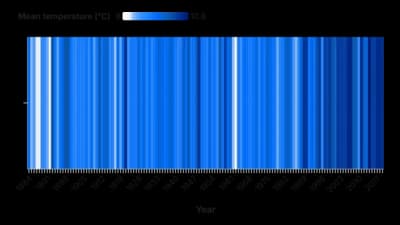
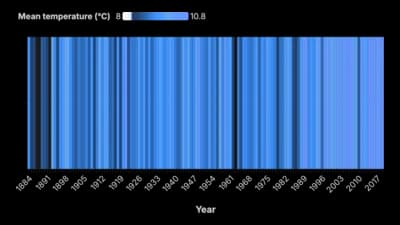
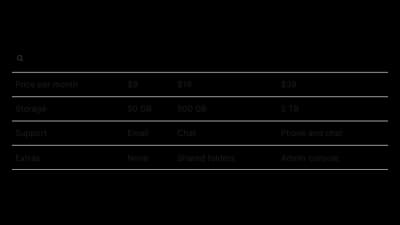
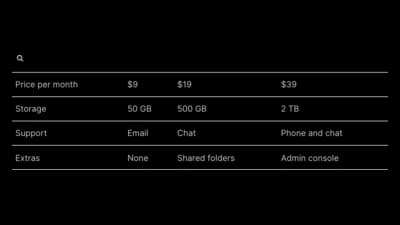
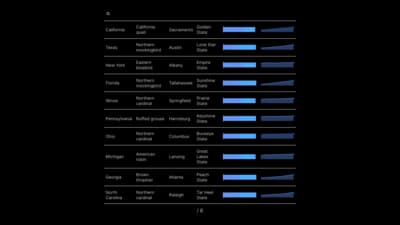
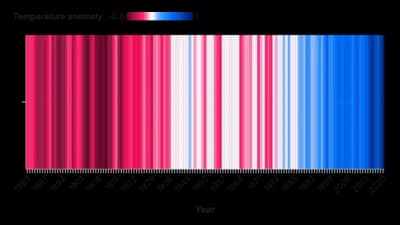
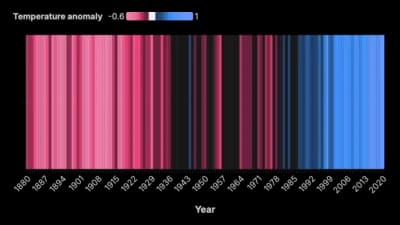
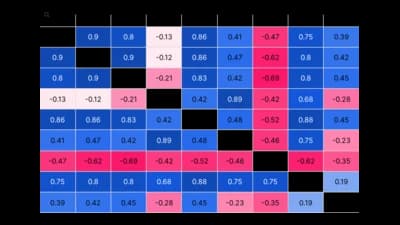
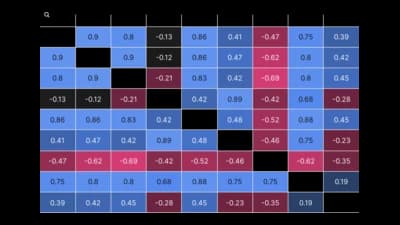
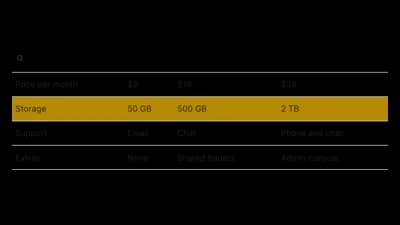
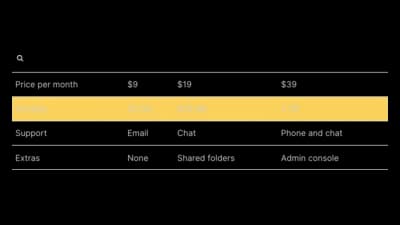
Tables and heatmaps keep every number on the page and let colour do the scanning. A good table is sortable and searchable; a heatmap turns a grid of numbers into a pattern, and a calendar heatmap shows habits across days and weeks. Use them when readers need exact values as well as the overall picture.
Where to use it
- Results tables people sort and search
- Patterns across hours, days or categories
- Activity and habits over a calendar year
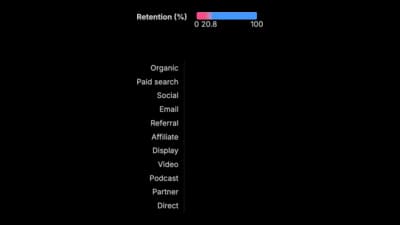
- Cohort and retention grids
Templates
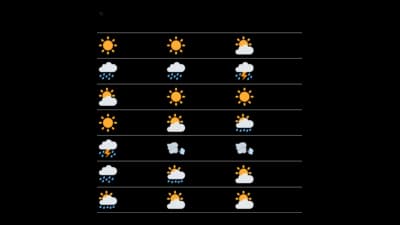
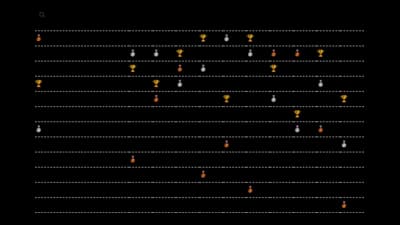
Start from any of these templates and swap in your own data.


Ready to Transform Your Data Storytelling?
Join +6,000 creating stunning charts and video visuals with the all-in-one AI data visualization platform.
PlotSet helps data analysts, marketers, and designers transform complex data into clear, compelling stories. start creating today.
Substack
Join our Substack community to share ideas and learn from fellow data visualization enthusiasts.

Discord
Collaborate with creators and data enthusiasts on our Discord server for real-time collaboration.