HierarchyFree
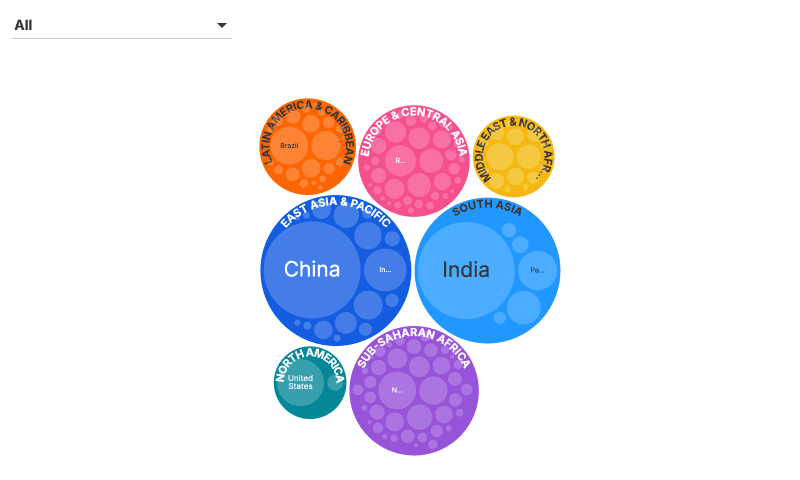
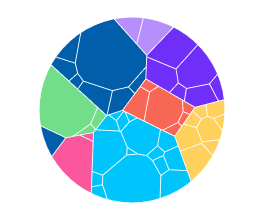
Voronoi treemap
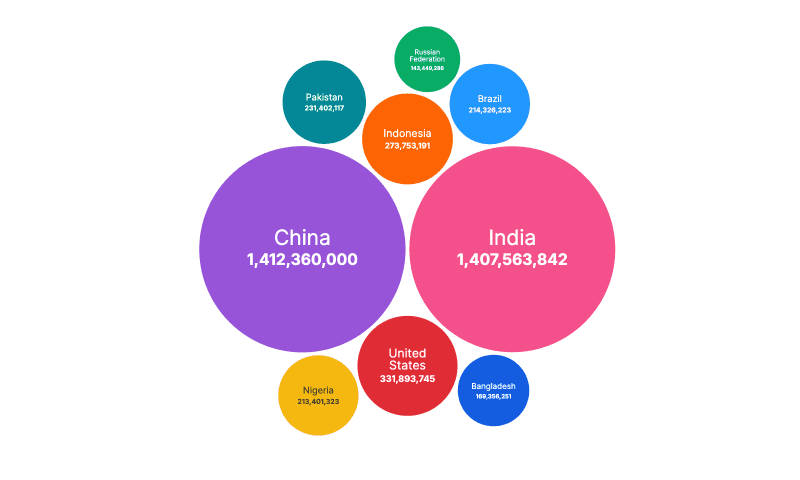
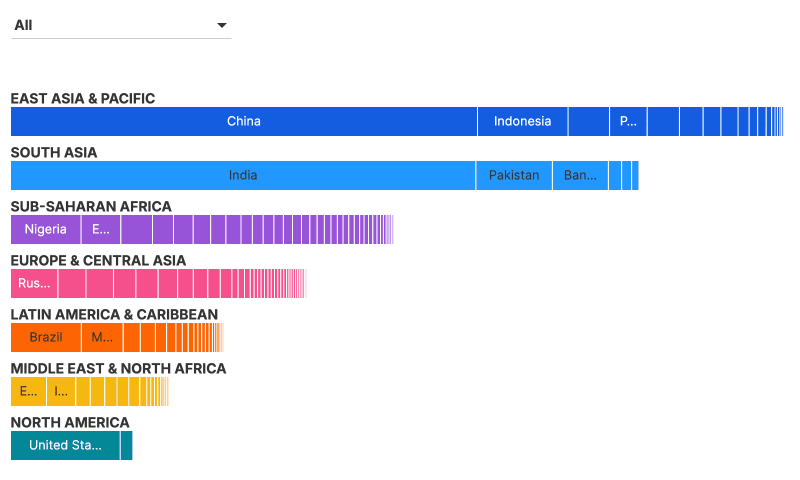
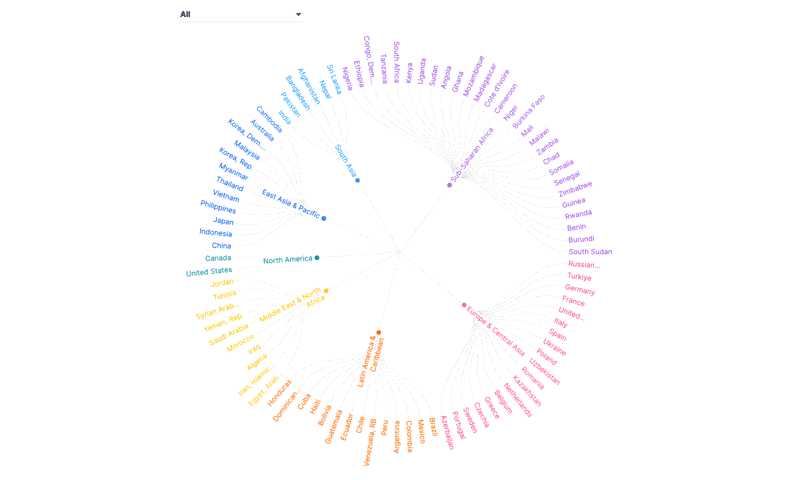
Make a Voronoi treemap chart in PlotSet: start from this template, swap in your own data, then embed it or export it as PNG, SVG or PDF.
(No Credit-Card Required)
Use cases
Where a chart like this does its best work.
Budgets, spending and revenue breakdowns
Market share and survey answer shares
Election results and seat counts
Nested categories, such as departments within divisions
Start from an example
Pick one to open your own editable copy.
 Formula 1 Winning Drivers
 Global CO2 Emissions by Country in 2017
 S&P 500 Sector Concentration Analysis
 Global Market Cap Distribution: 1900 vs. 2023
 The 10 Largest Sovereign Debt Defaults (1983-2022)
 Global IPOs in 2024 by Country
 Top Import Partner of Every U.S. State
 The World's Largest Companies by Revenue
 Global Plastic Waste Management
 How Americans Spend their Money
 Global Semiconductor Companies by Market Cap
 Average Monthly Budget in the U.S