Distribution
Charts that show how values spread out across a range.
The idea
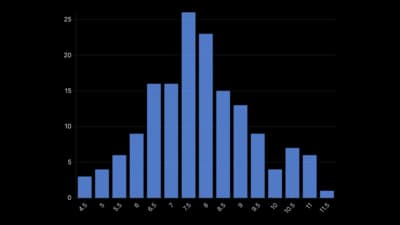
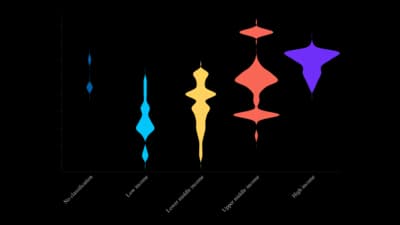
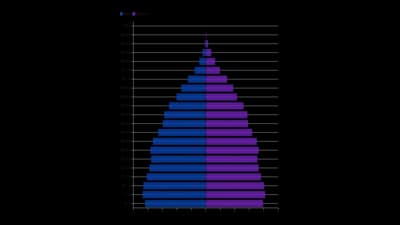
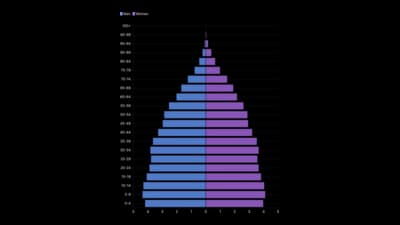
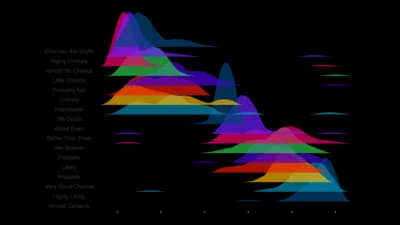
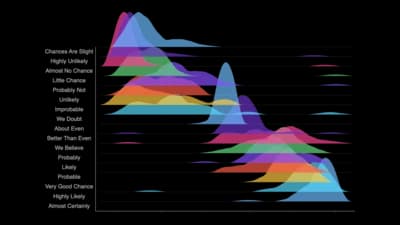
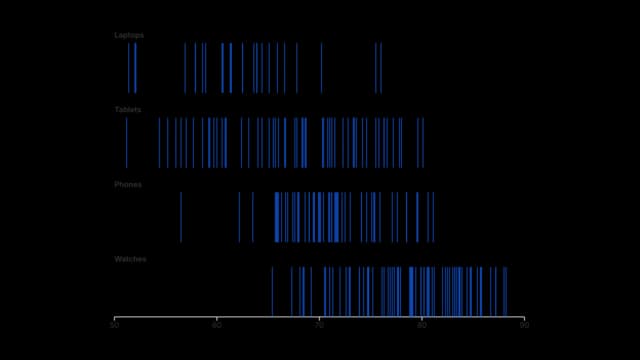
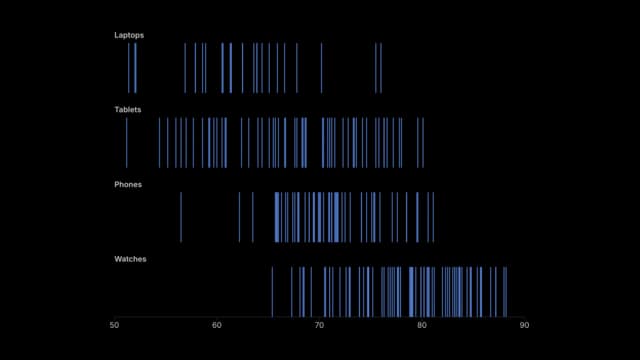
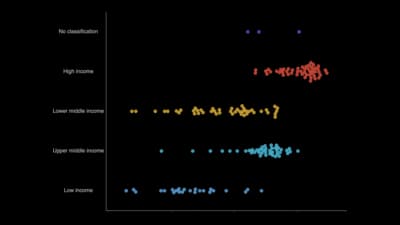
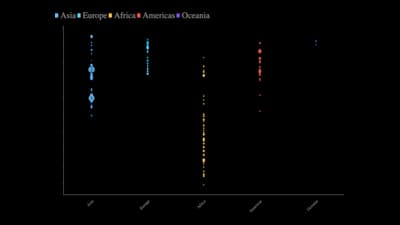
Distribution charts show how values spread across a range instead of summarising them as one average. They reveal the typical value, the spread, skew, gaps and outliers, and let you compare those shapes between groups. Reach for them before any average, because two groups with the same mean can look nothing alike.
Where to use it
- Salaries, test scores and response times
- Comparing the spread of a measure between groups
- Age and population structure
- Finding outliers before you summarise
Templates
Start from any of these templates and swap in your own data.

Ready to Transform Your Data Storytelling?
Join +6,000 creating stunning charts and video visuals with the all-in-one AI data visualization platform.
PlotSet helps data analysts, marketers, and designers transform complex data into clear, compelling stories. start creating today.
Substack
Join our Substack community to share ideas and learn from fellow data visualization enthusiasts.

Discord
Collaborate with creators and data enthusiasts on our Discord server for real-time collaboration.