Ranking
Charts that order things and show the gaps between them.
The idea
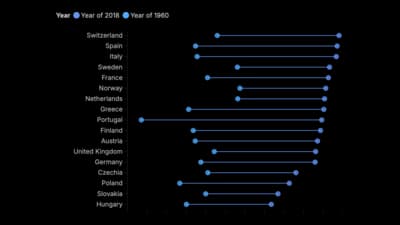
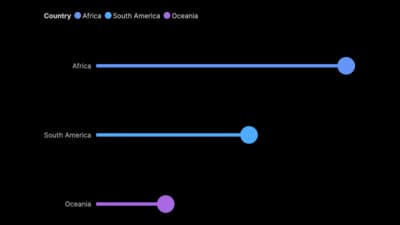
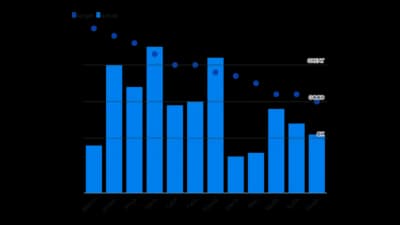
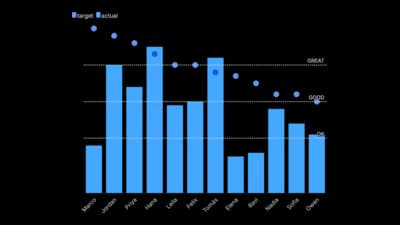
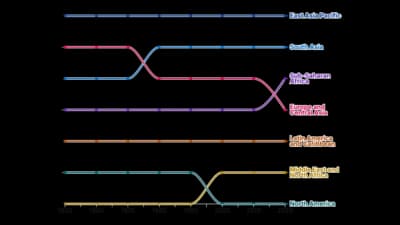
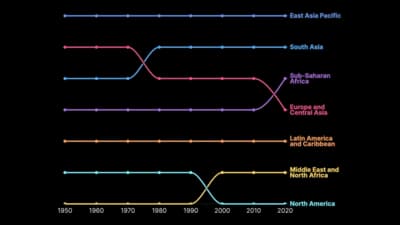
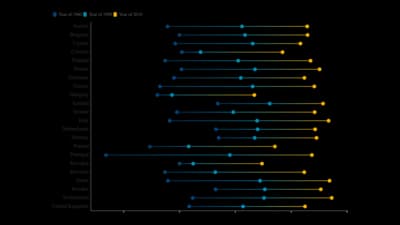
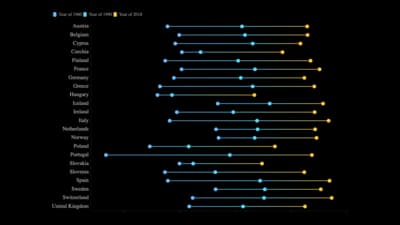
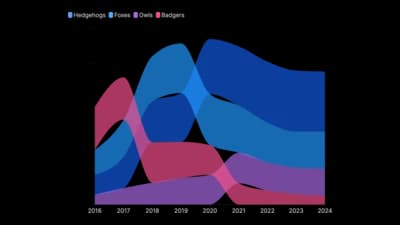
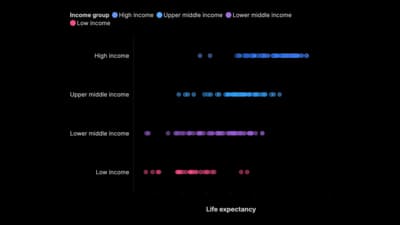
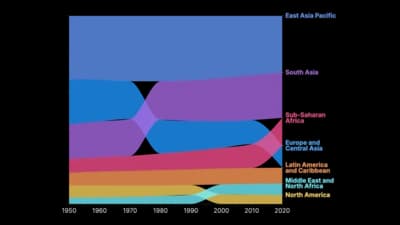
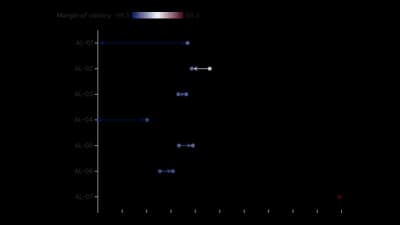
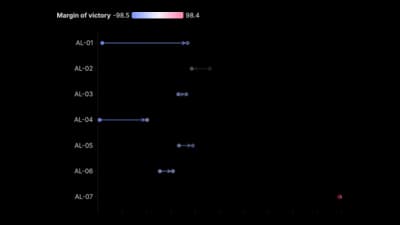
Ranking charts are about position: who is first, who moved, and how far apart they are. Dots, lollipops and dumbbells keep the focus on the value or the gap between two values, while bump and race charts follow ranks as they change over time. Sort the data, because order is the story.
Where to use it
- League tables and top-ten lists
- Before-and-after gaps, such as pay or prices
- Performance against a target
- Following ranks as they change year by year
Templates
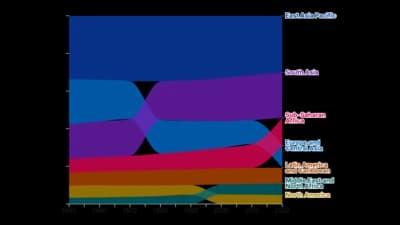
Start from any of these templates and swap in your own data.

Ready to Transform Your Data Storytelling?
Join +6,000 creating stunning charts and video visuals with the all-in-one AI data visualization platform.
PlotSet helps data analysts, marketers, and designers transform complex data into clear, compelling stories. start creating today.
Substack
Join our Substack community to share ideas and learn from fellow data visualization enthusiasts.

Discord
Collaborate with creators and data enthusiasts on our Discord server for real-time collaboration.