HierarchyFree
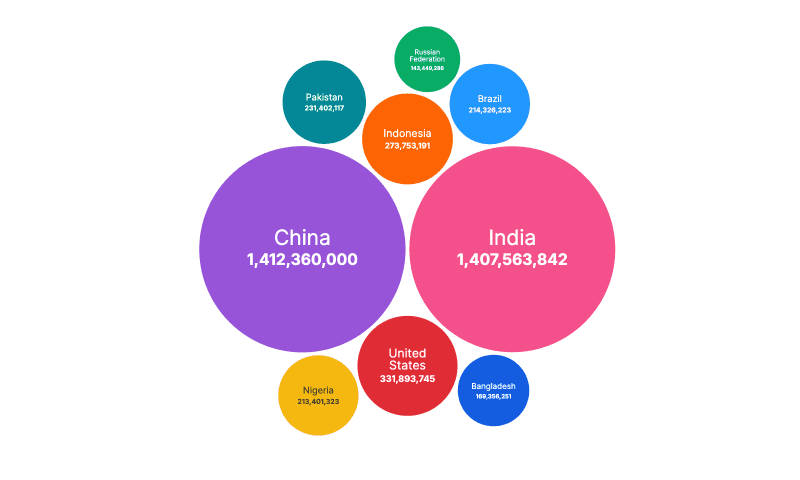
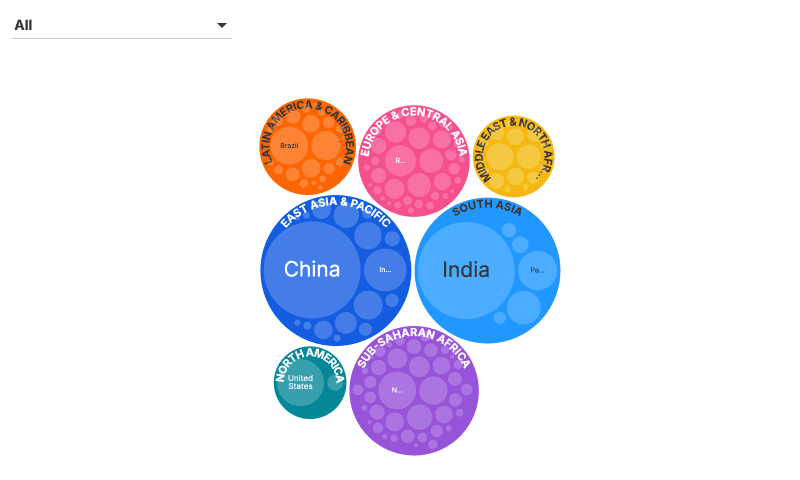
Packed circles
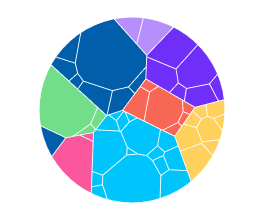
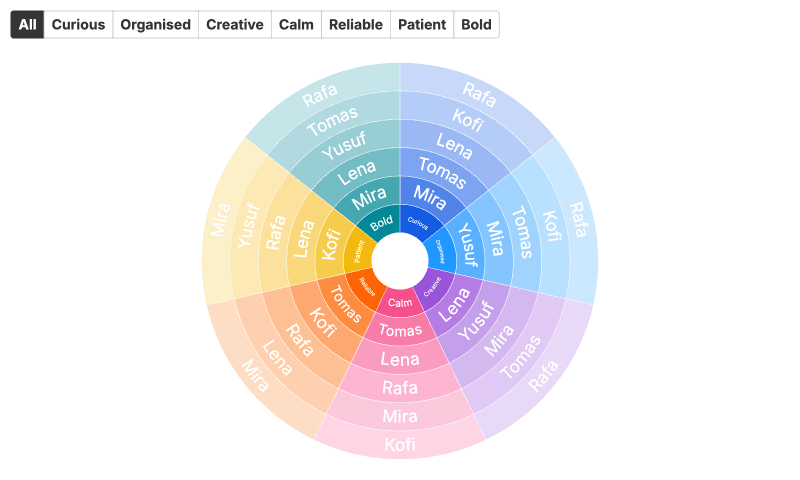
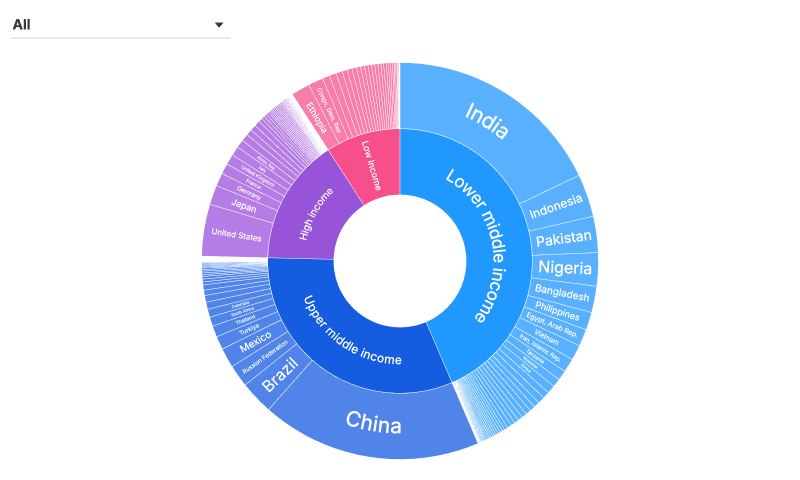
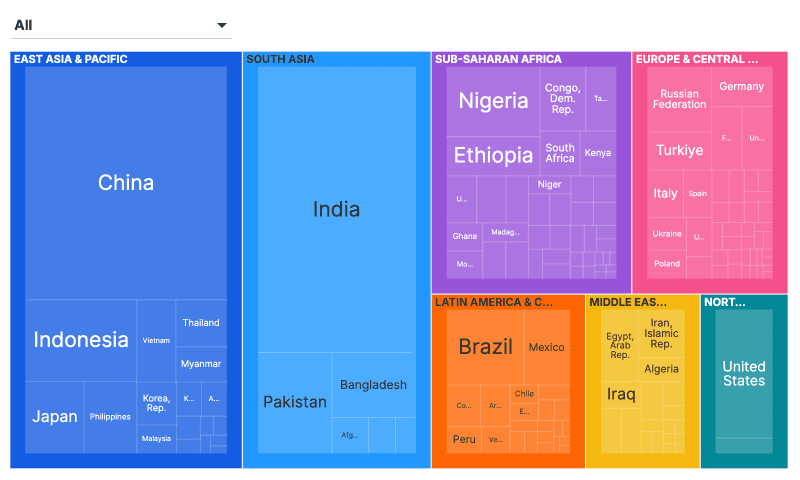
Make a Packed circles chart in PlotSet: start from this template, swap in your own data, then embed it or export it as PNG, SVG or PDF.
(No Credit-Card Required)
Use cases
Where a chart like this does its best work.
Budgets, spending and revenue breakdowns
Market share and survey answer shares
Election results and seat counts
Nested categories, such as departments within divisions