Bar chartFree
Split Bars
Make a Split Bars chart in PlotSet: start from this template, swap in your own data, then embed it or export it as PNG, SVG or PDF.
(No Credit-Card Required)
Use cases
Where a chart like this does its best work.
Salaries, test scores and response times
Comparing the spread of a measure between groups
Age and population structure
Finding outliers before you summarise
Start from an example
Pick one to open your own editable copy.
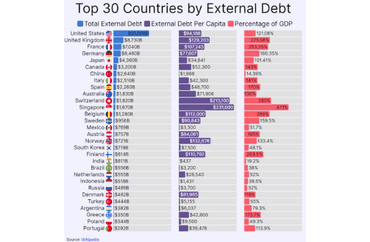 Top 30 Countries by External Debt
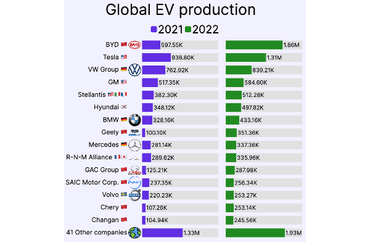 Global EV production
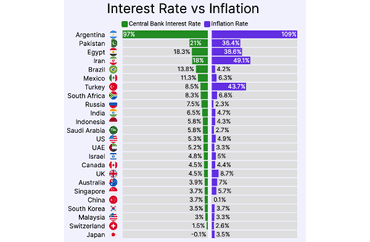 Interest Rate vs Inflation
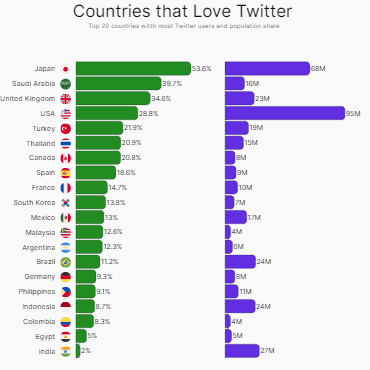 Countries That Love Twitter
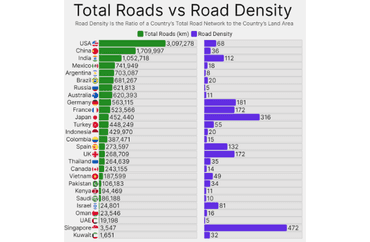 Total Roads vs Road Density
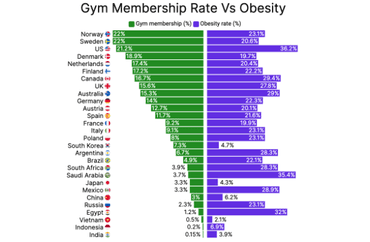 Gym vs Obesity
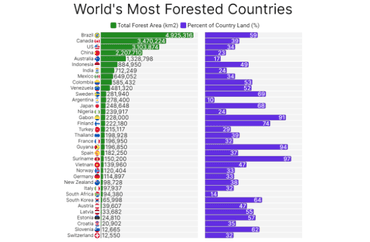 World's Most Forested Countries
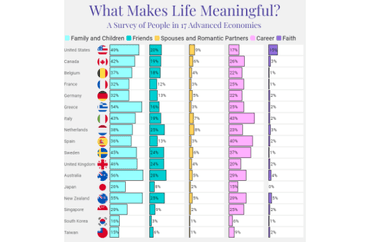 What Makes Life Meaningful?
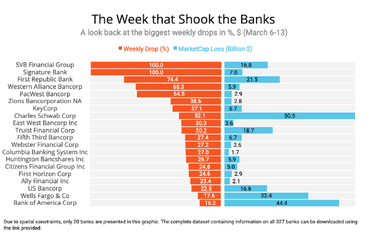 The Week that Shook the Banks (Data for 327 Banks)
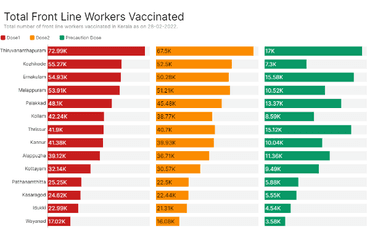 Total Front Line Workers Vaccinated
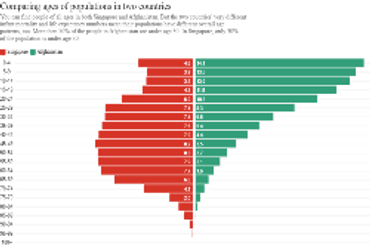 populations in Singapore and Afghanistan
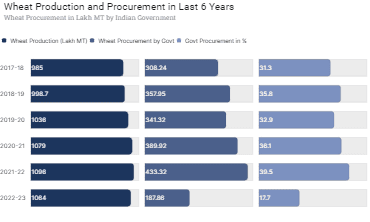 Wheat Production and Procurement in Last 6 Years