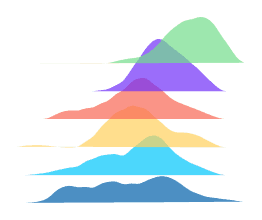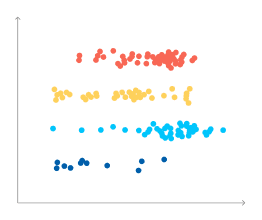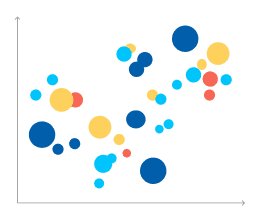
Distribution chartsFree
Swarm
Make a Swarm chart in PlotSet: start from this template, swap in your own data, then embed it or export it as PNG, SVG or PDF.
(No Credit-Card Required)
Use cases
Where a chart like this does its best work.
Salaries, test scores and response times
Comparing the spread of a measure between groups
Age and population structure
Finding outliers before you summarise
Start from an example
Pick one to open your own editable copy.