Line, bar and pie chartsFree
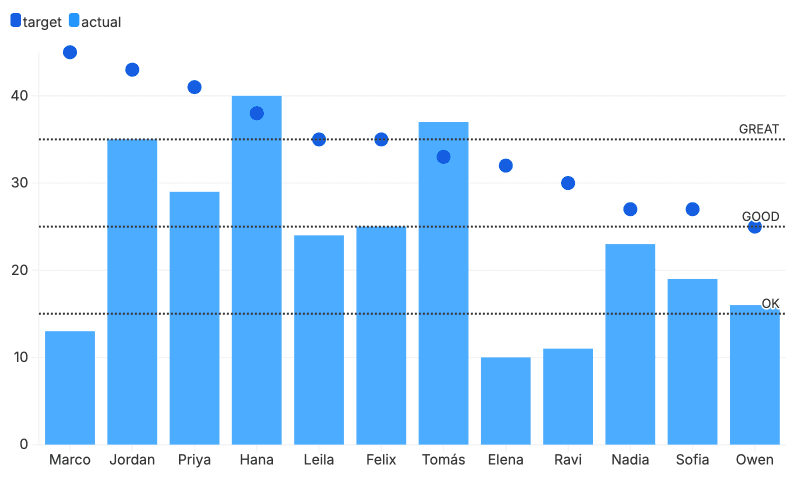
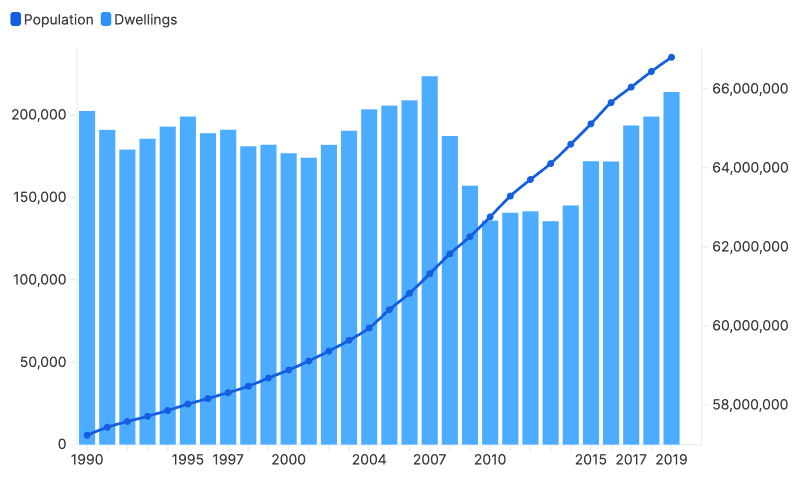
Line + column
Make a Line + column chart in PlotSet: start from this template, swap in your own data, then embed it or export it as PNG, SVG or PDF.
(No Credit-Card Required)
Use cases
Where a chart like this does its best work.
Comparing sales, votes or survey answers across categories
This year against last year, or target against actual
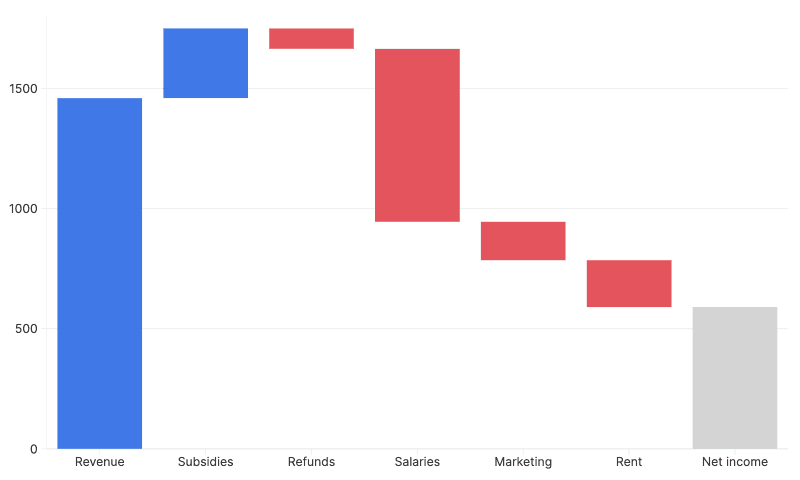
Totals broken into their parts with stacked bars
Showing many categories with long labels as horizontal bars