Bar chartFree
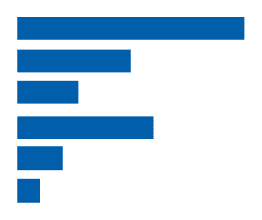
Grouped Bar Chart
Make a Grouped Bar chart in PlotSet: start from this template, swap in your own data, then embed it or export it as PNG, SVG or PDF.
(No Credit-Card Required)
Use cases
Where a chart like this does its best work.
Comparing sales, votes or survey answers across categories
This year against last year, or target against actual
Totals broken into their parts with stacked bars
Showing many categories with long labels as horizontal bars
Start from an example
Pick one to open your own editable copy.
 Paris 2024 Total Medals Standardized by GDP/capita
 A Cash Crop: Cannabis Leads in Value per Hectare
 Paris 2024 medal table - standardized by Population
 Economic Impact of the Great Lakes-St. Lawrence Region
 Example Items from the 1033 Program
 Energy Consumption Breakdown in EU Households (2018)
 Preferences for Online vs. In-Store Shopping Across Countries
 The Trade-off Between Time and Money
 Accountability & Performance in Business Leadership
 Age-Based Preferences for Time and Experiences Over Money
 Average Lifespan of U.S. Currency Denominations
 Comparison of Gender Diversity in Wall Street and Silicon Valley