ScatterFree
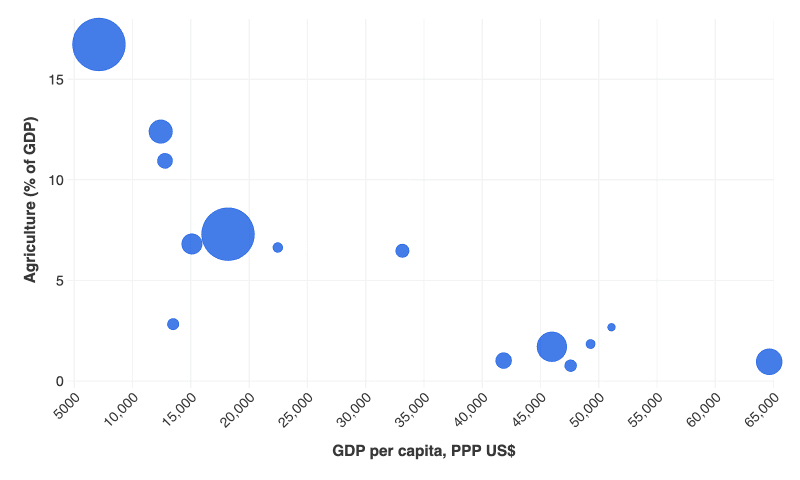
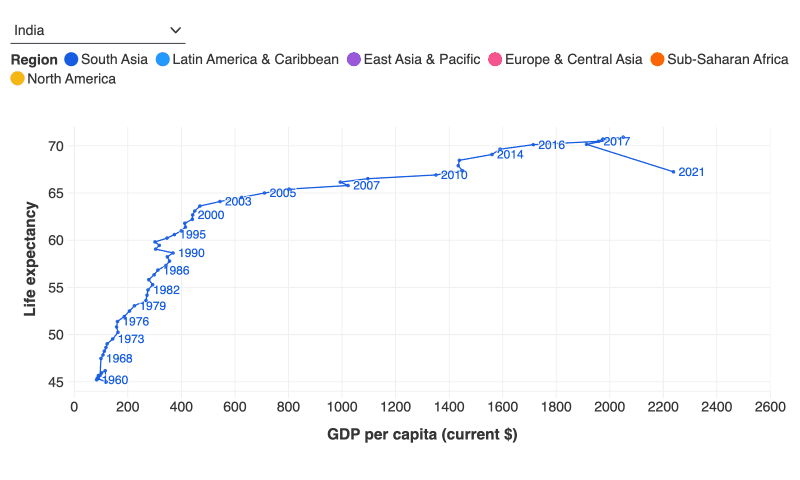
Connected scatter plot
Make a Connected scatter plot chart in PlotSet: start from this template, swap in your own data, then embed it or export it as PNG, SVG or PDF.
(No Credit-Card Required)
Use cases
Where a chart like this does its best work.
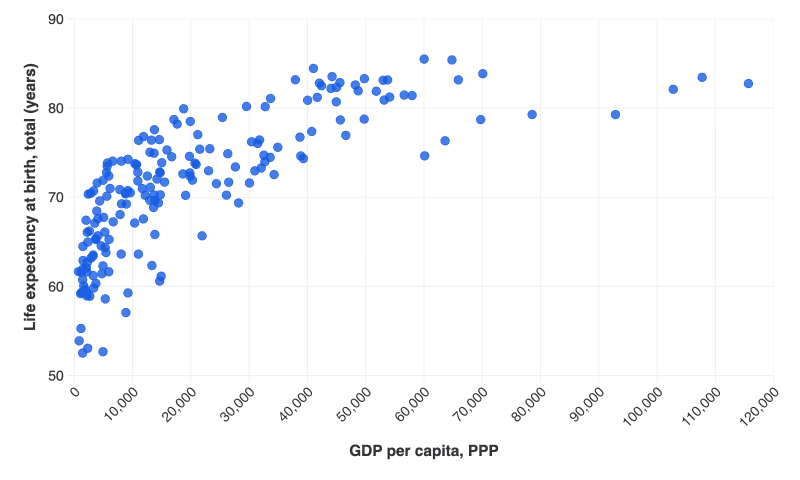
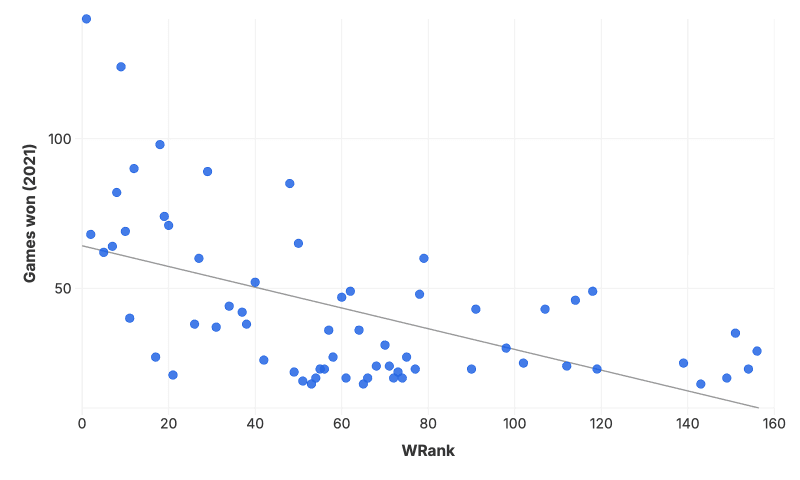
Testing whether two measures move together
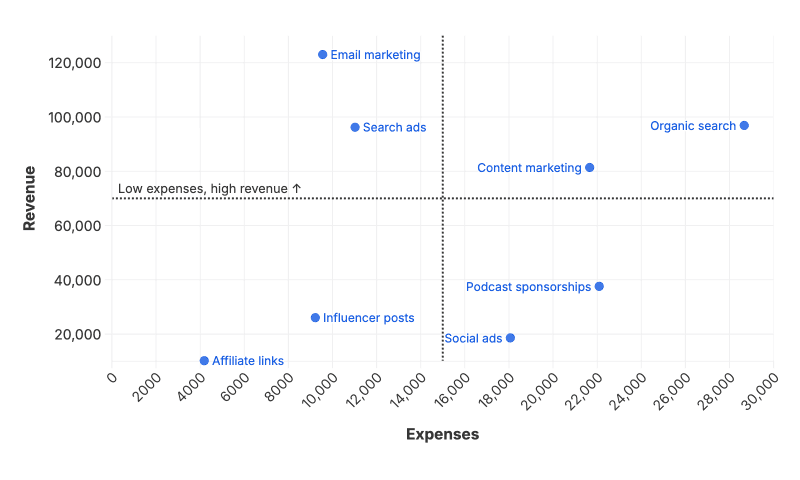
Positioning items on two axes, such as cost against value
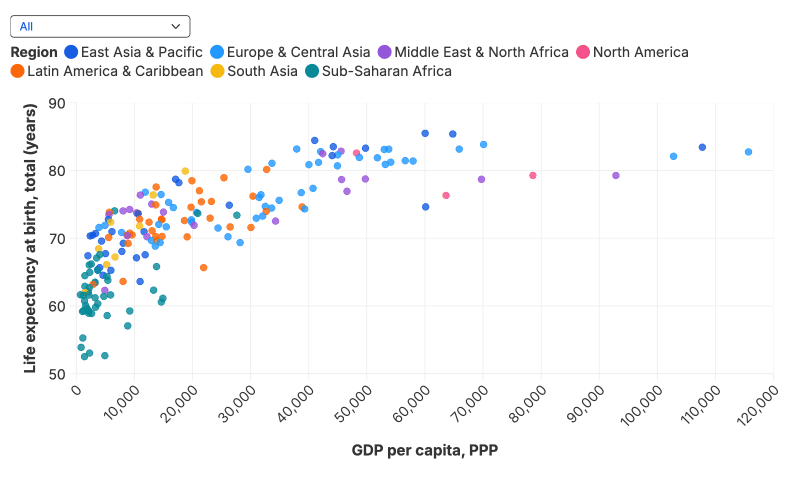
Spotting outliers and clusters
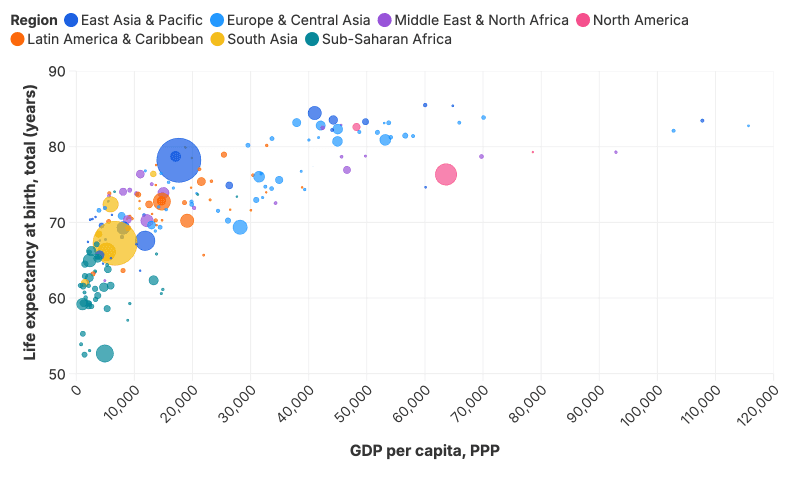
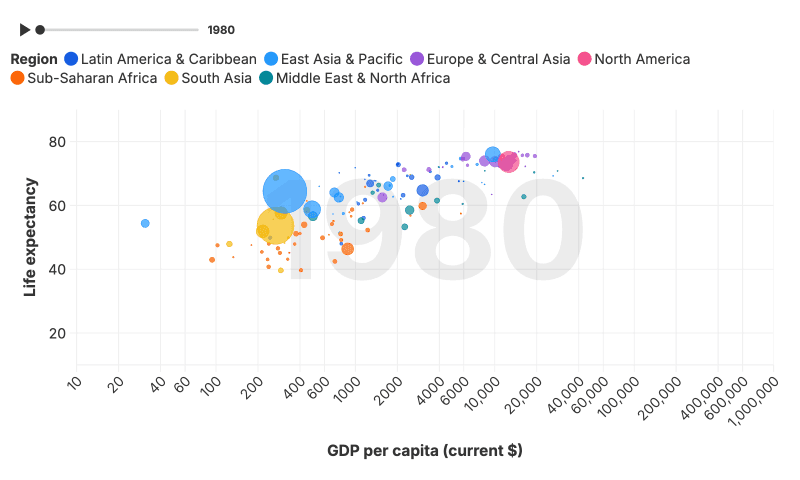
Comparing countries or companies on three measures at once