Line, bar and pie chartsFree
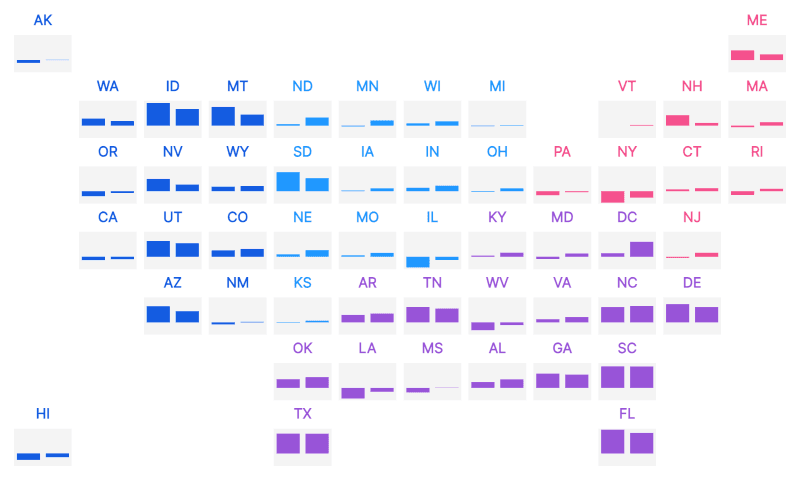
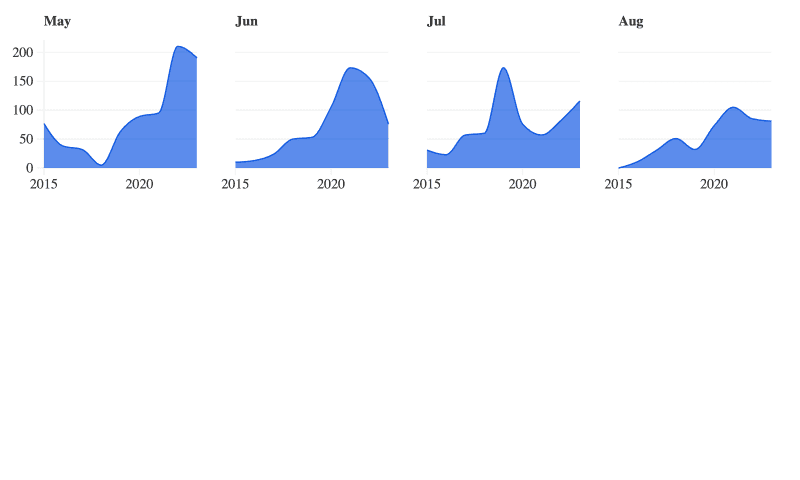
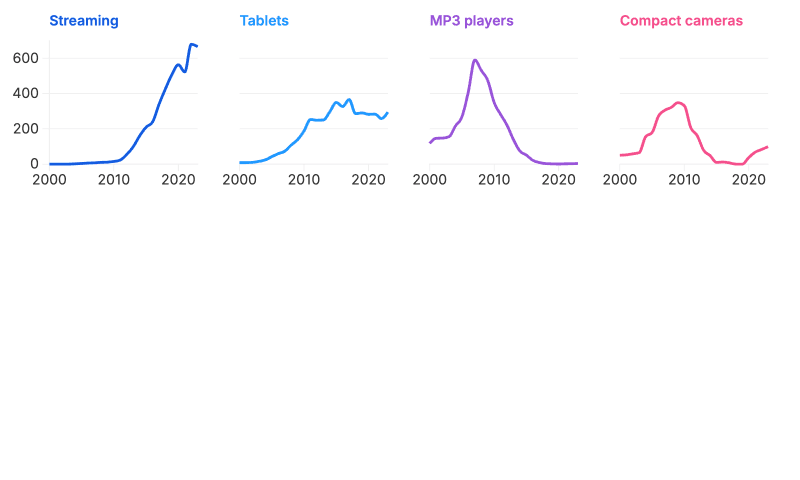
Grid of line charts
Make a Grid of line chart in PlotSet: start from this template, swap in your own data, then embed it or export it as PNG, SVG or PDF.
(No Credit-Card Required)
Use cases
Where a chart like this does its best work.
Sales, traffic and other metrics over months or years
Prices, rates and indices
Comparing a few series on the same time scale
Totals over time, split into their parts