
Sep 27, 2023
Step-by-Step Tutorial on Creating a Heatmap List (Most Polluted Cities)
Discover the process of generating a heatmap list to showcase your categorical data, specifically the most polluted cities.
Read more
Check out these data visualization examples to get inspired
Sep 27, 2023
Discover the process of generating a heatmap list to showcase your categorical data, specifically the most polluted cities.
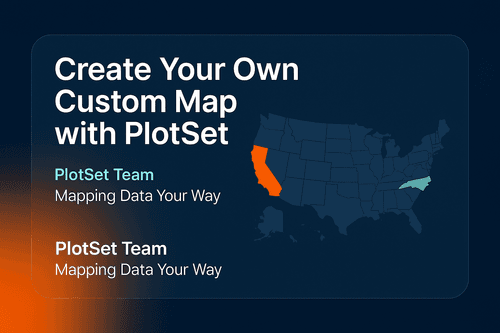
Sep 27, 2023
Learn how to create a detailed USA map using the PlotSet template with our comprehensive guide. Perfect for data visualization and presentations.
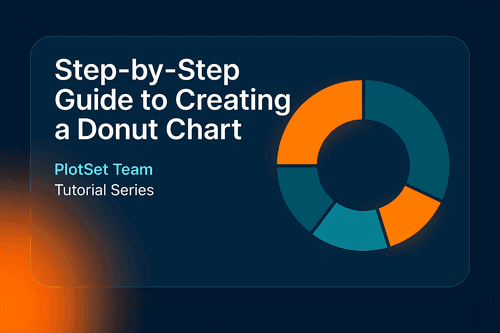
Sep 27, 2023
Learn how to create a stunning Donut Chart with PlotSet. Discover the steps to impress your audience.
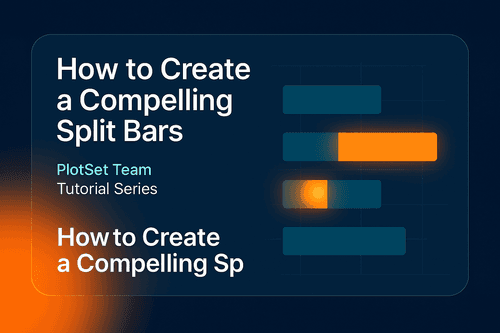
Sep 12, 2023
Learn how to create stunning Split Bars with this comprehensive tutorial. Get all the information you need to create amazing designs.

Sep 27, 2023
Learn how to create a stunning line chart with our comprehensive step-by-step tutorial. Perfect for data visualization and analysis.
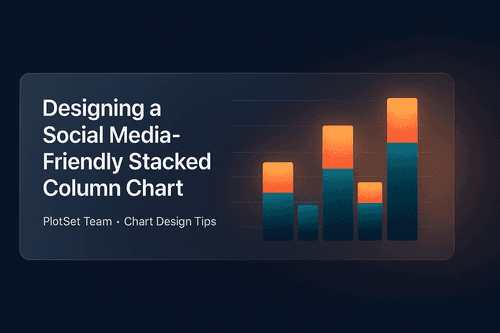
Sep 27, 2023
Discover the art of crafting a remarkable stacked column chart on YouTube viewership. Enhance your data visualization skills today.