
Every chart here started as a spreadsheet.
Maps, bar chart races, treemaps, pictograms and more. Open one and remake it with your own data.
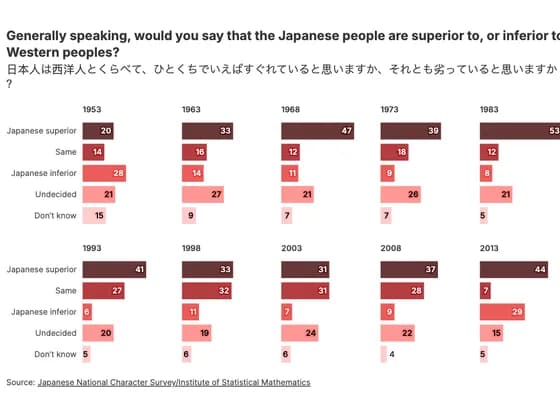 Line, bar and pie chartsGenerally speaking, would you say that the Japanese people are superior to, or inferior to…
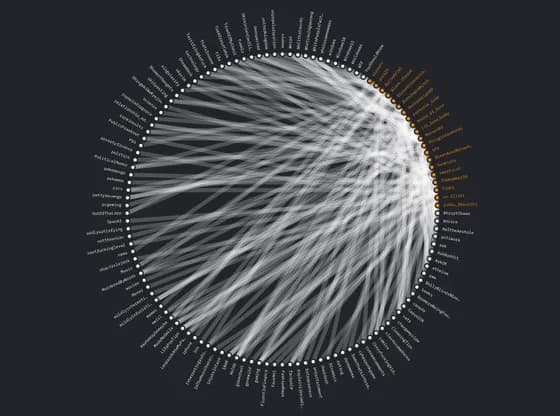 Network graph#784 Connections
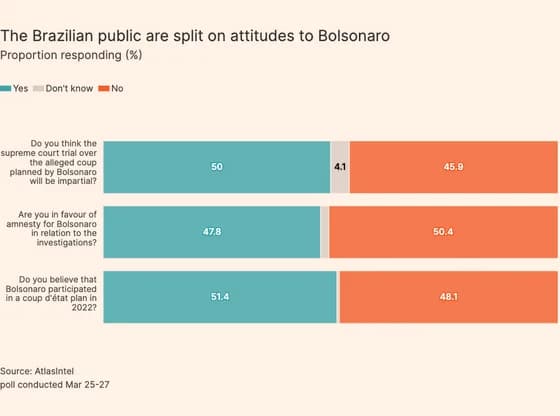 Line, bar and pie chartsThe Brazilian public are split on attitudes to Bolsonaro
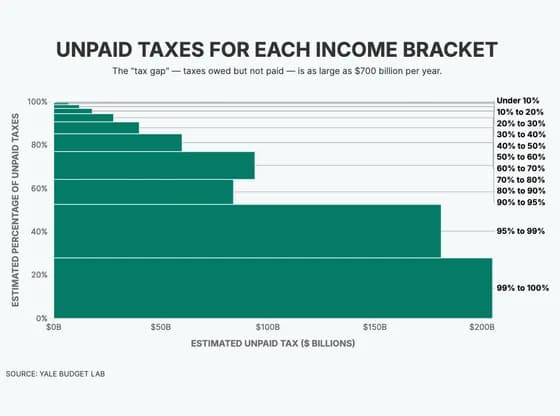 MarimekkoUNPAID TAXES FOR EACH INCOME BRACKET
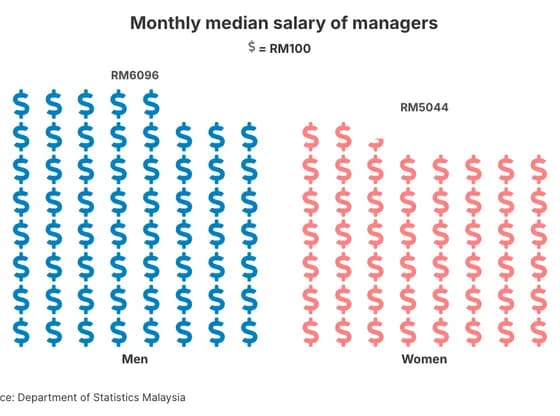 PictogramMonthly median salary of managers
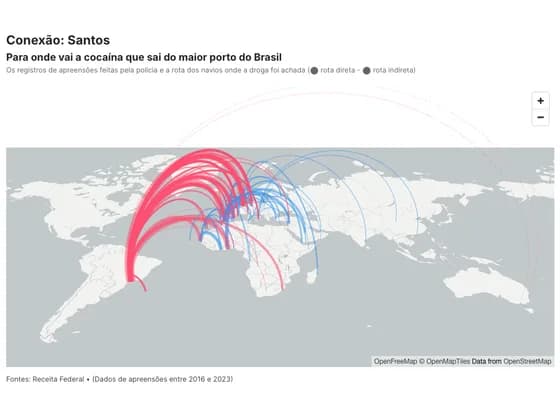 3D mapConexão: Santos
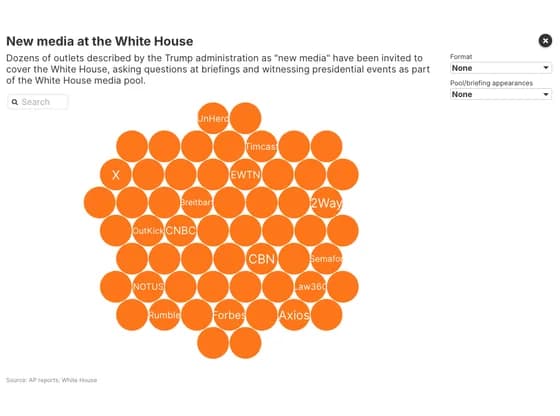 Interactive toolsNew media at the White House
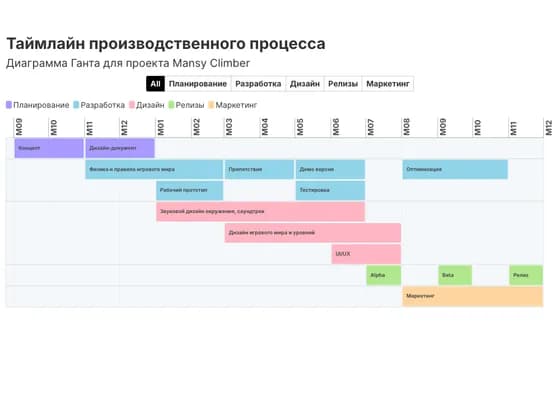 Gantt chartТаймлайн производственного процесса
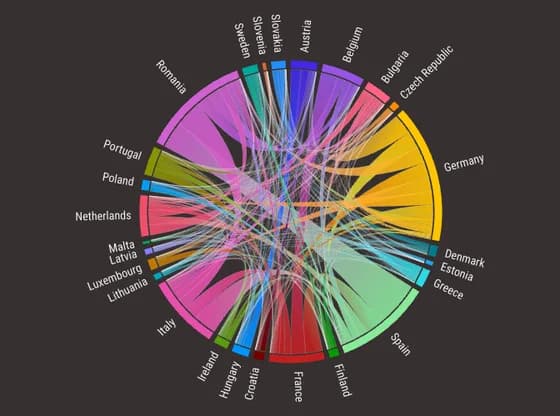 Network graphFlujos migratorios entre países de la UE (2022)
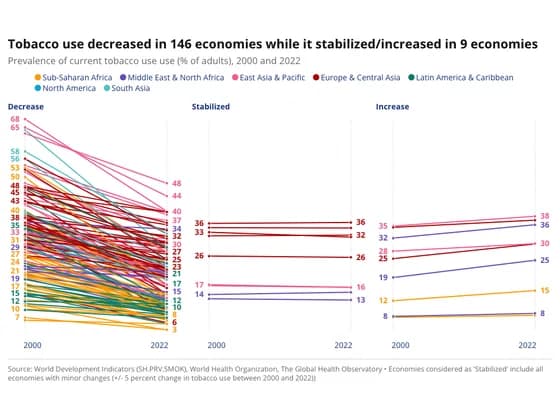 Slope chartTobacco use decreased in 146 economies while it stabilized/increased in 9 economies
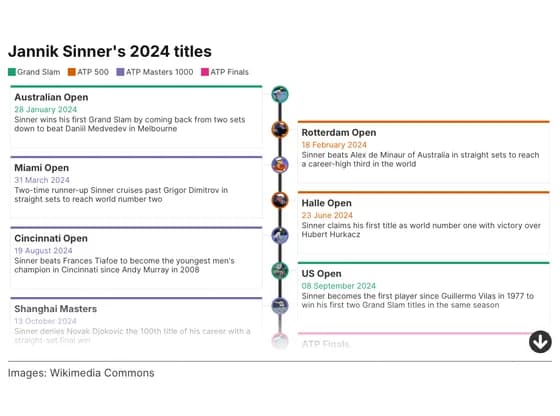 TimelineJannik Sinner's 2024 titles
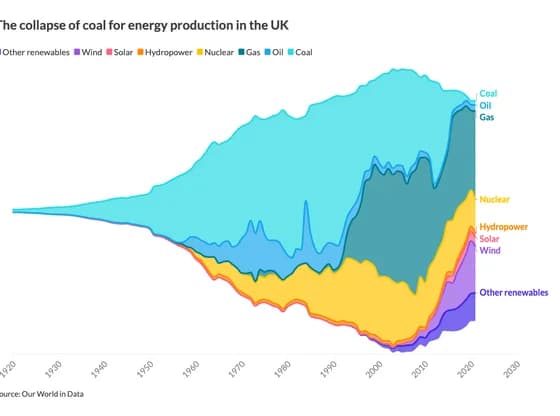 Line, bar and pie chartsThe collapse of coal for energy production in the UK
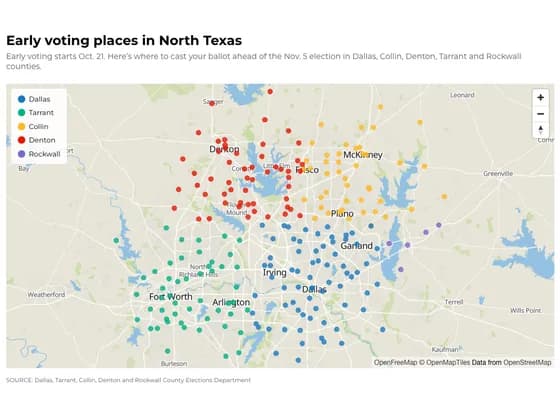 3D mapEarly voting places in North Texas
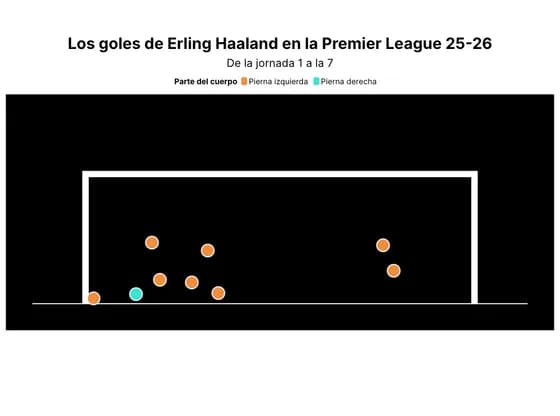 SportsLos goles de Erling Haaland en la Premier League 25-26
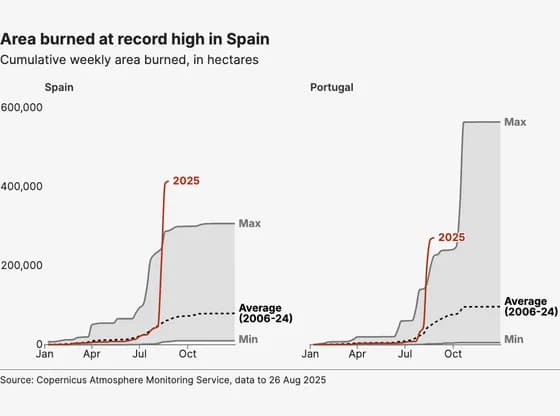 Line, bar and pie chartsArea burned at record high in Spain
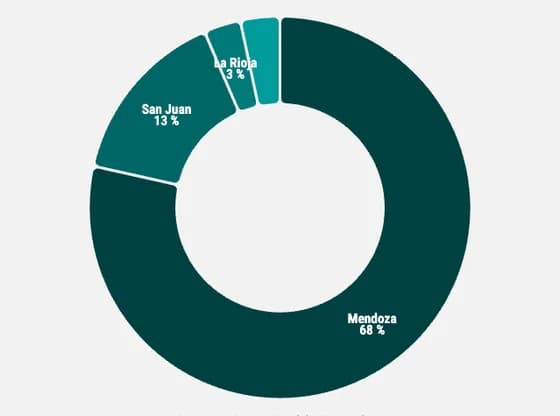 Line, bar and pie chartsDistribution of wine production volume in argentina by region
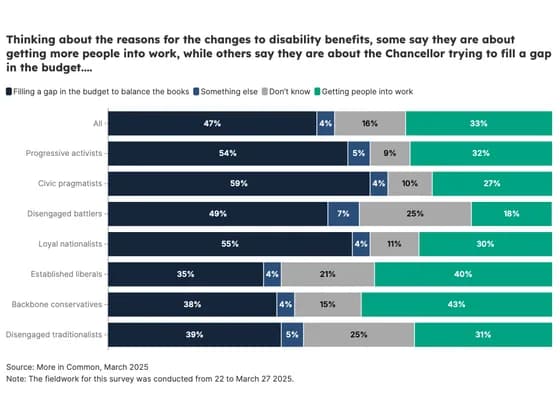 Line, bar and pie chartsThinking about the reasons for the changes to disability benefits, some say they are about…
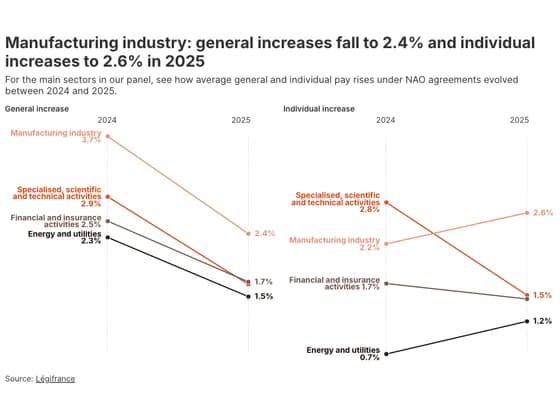 Slope chartManufacturing industry: general increases fall to 2.4% and individual increases to 2.6% in 2025
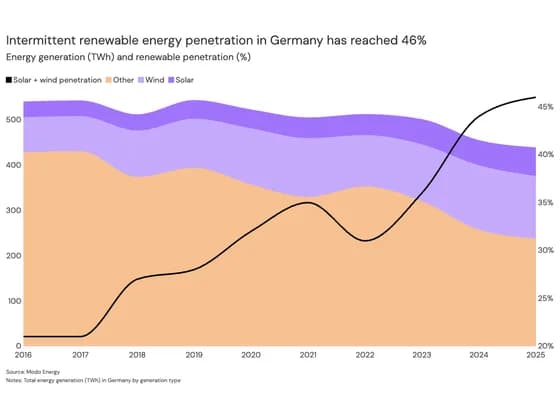 Line, bar and pie chartsIntermittent renewable energy penetration in Germany has reached 46%
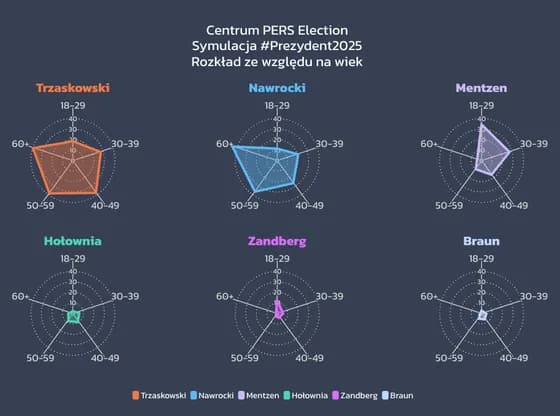 Radar chartPajęczyny wieku