
Charts that move.
Video charts made with PlotSet, ready for a post or a slide, and animated templates you can fill with your own numbers.
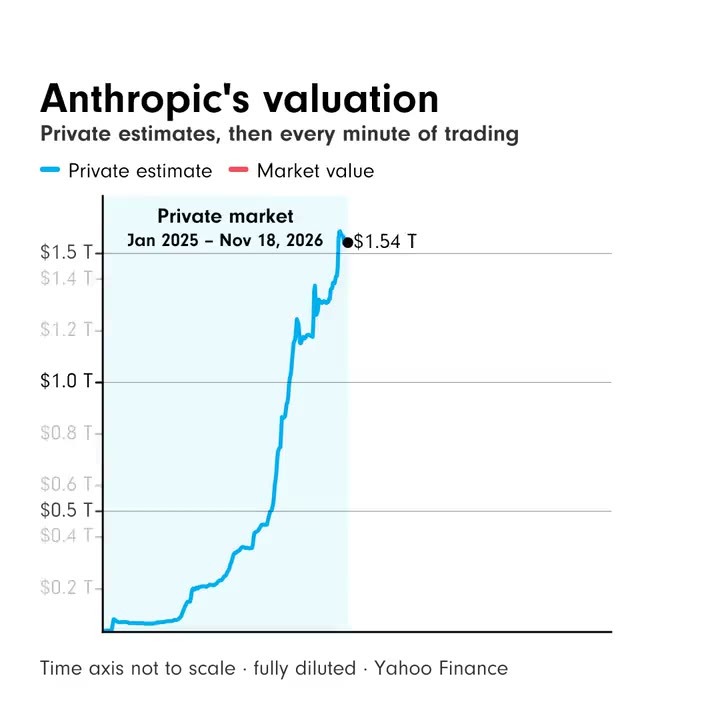 Anthropic gave back most of its first-day pop by Friday
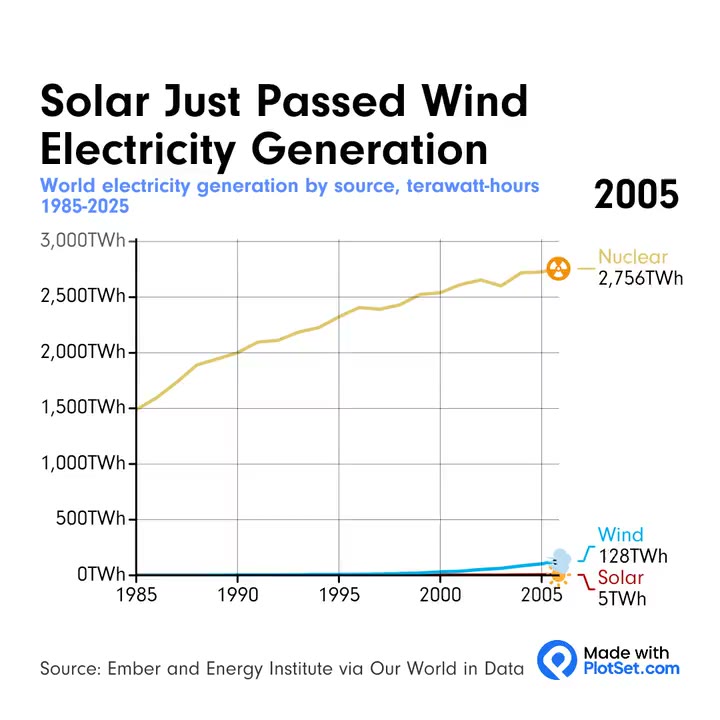 Solar overtakes wind in world electricity generation
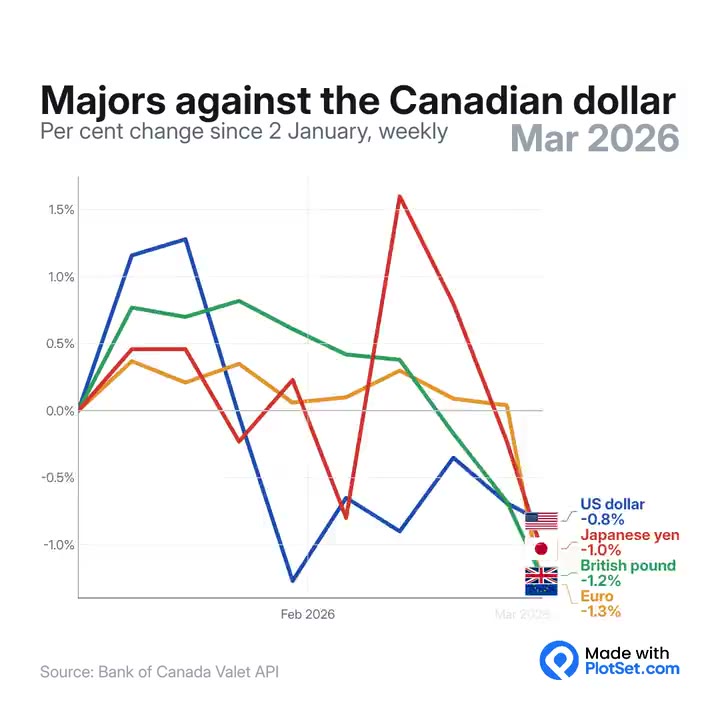 Pound and US dollar gain on the Canadian dollar in 2026
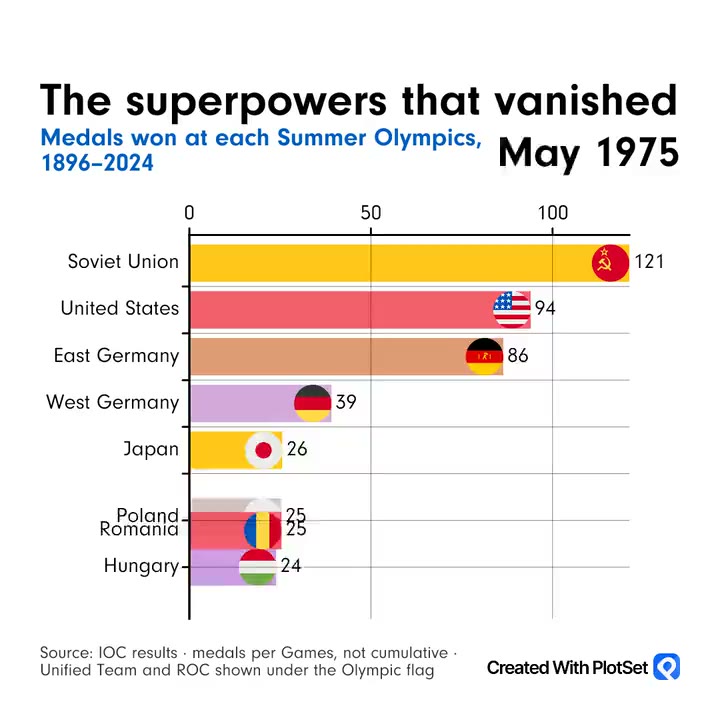 Soviet Union and East Germany once led the Olympic medals
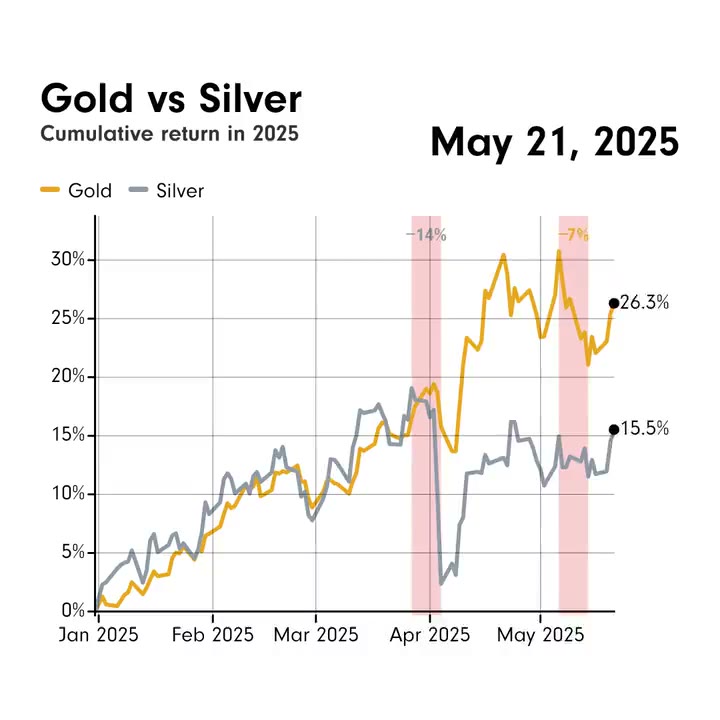 Silver returned more than twice as much as gold in 2025
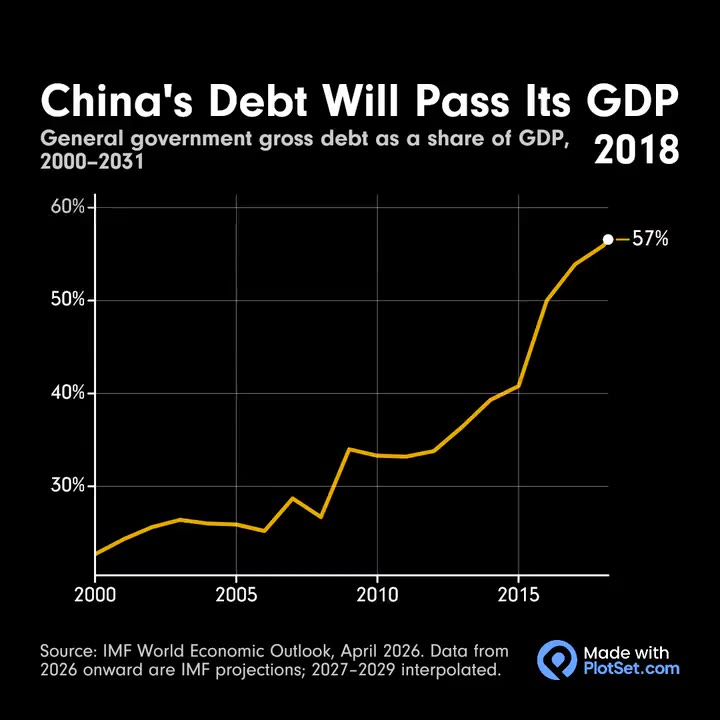 China's government debt is on course to pass its GDP
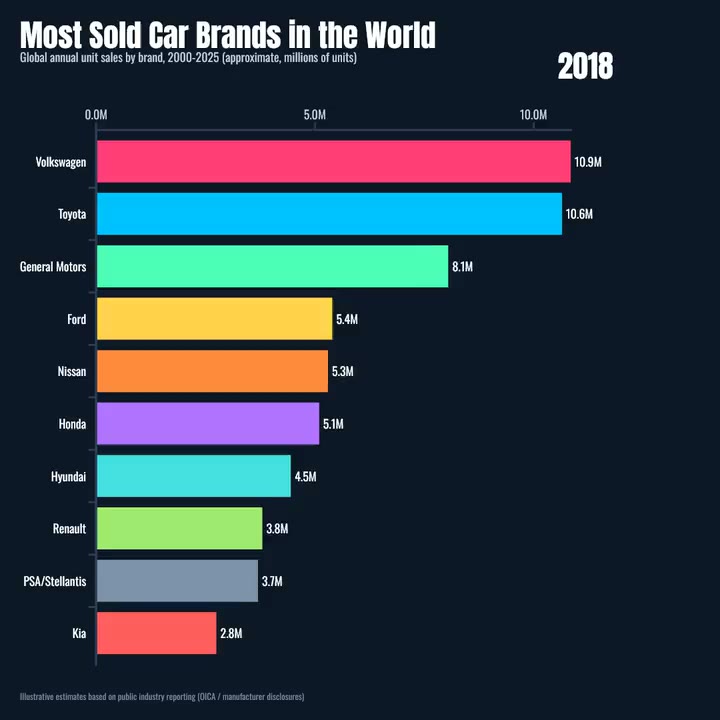 Toyota now sells the most cars, a spot GM held in 2000
 Italy tops the UNESCO World Heritage list by a single site
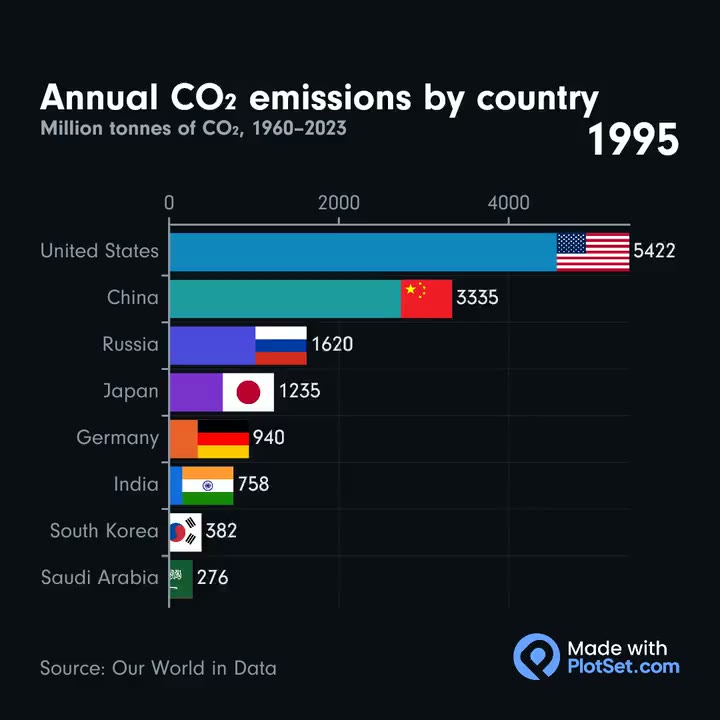 China emits more CO2 than the US, India and Russia combined
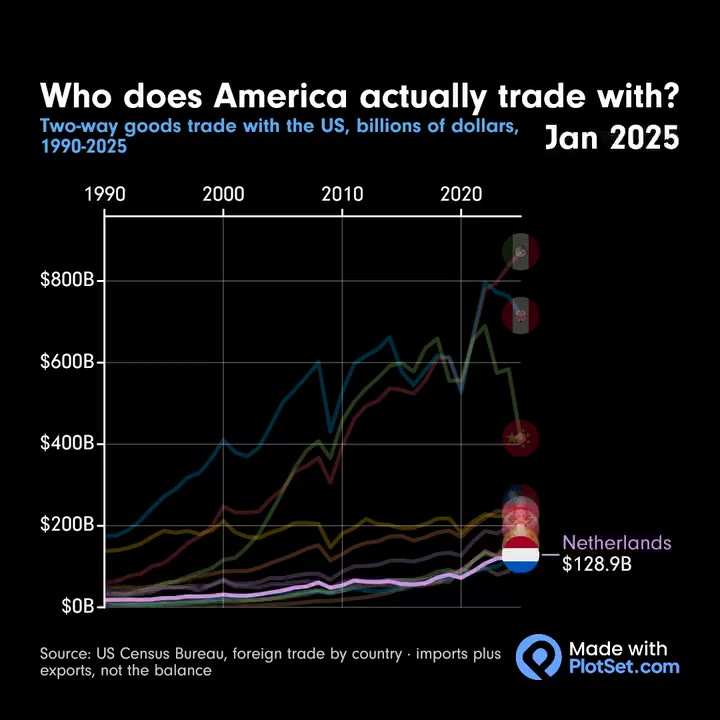 Mexico, not China, is now America's biggest trading partner
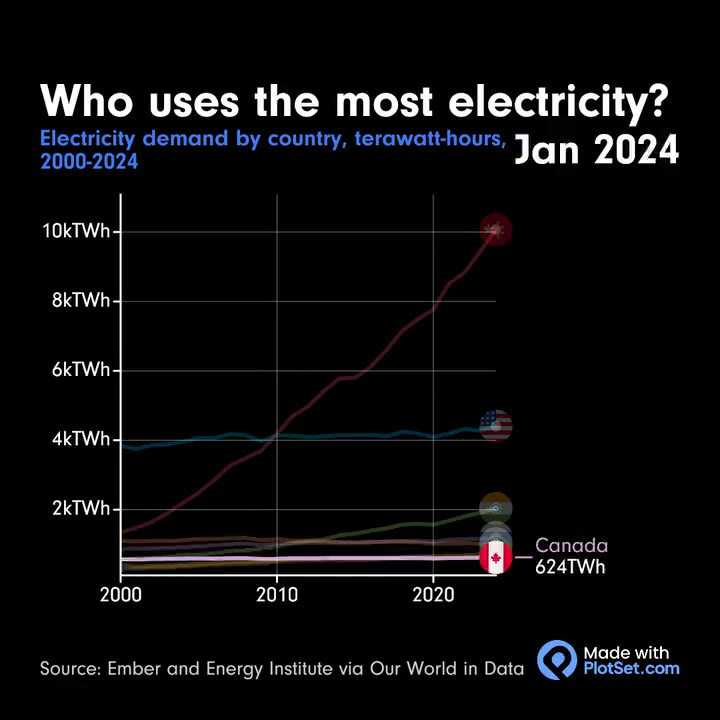 China uses more than twice as much electricity as the US
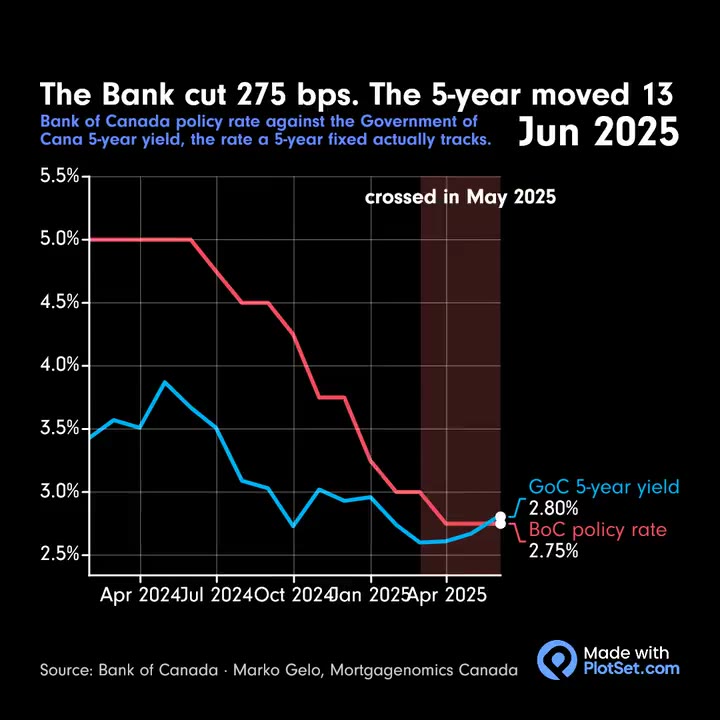 Bank of Canada cuts barely moved the 5-year yield
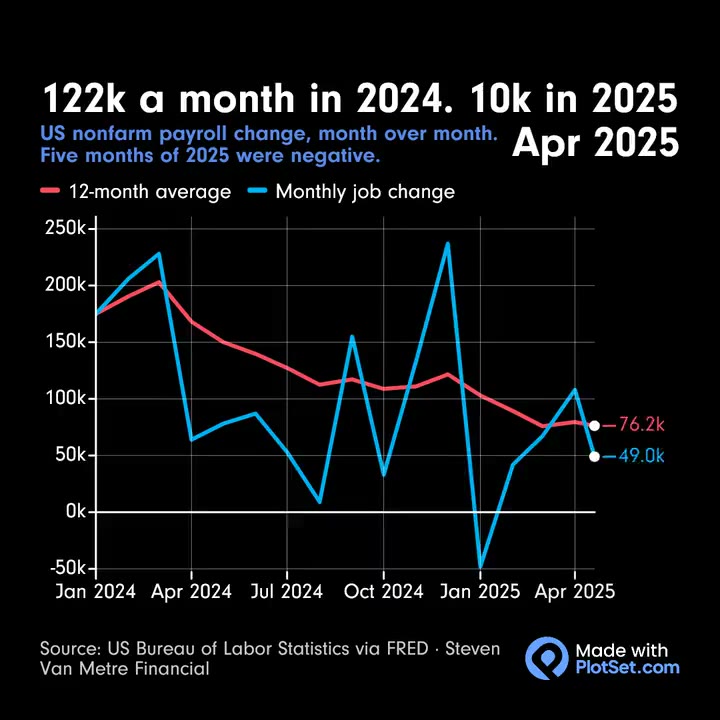 US job growth slowed to 10k a month in 2025
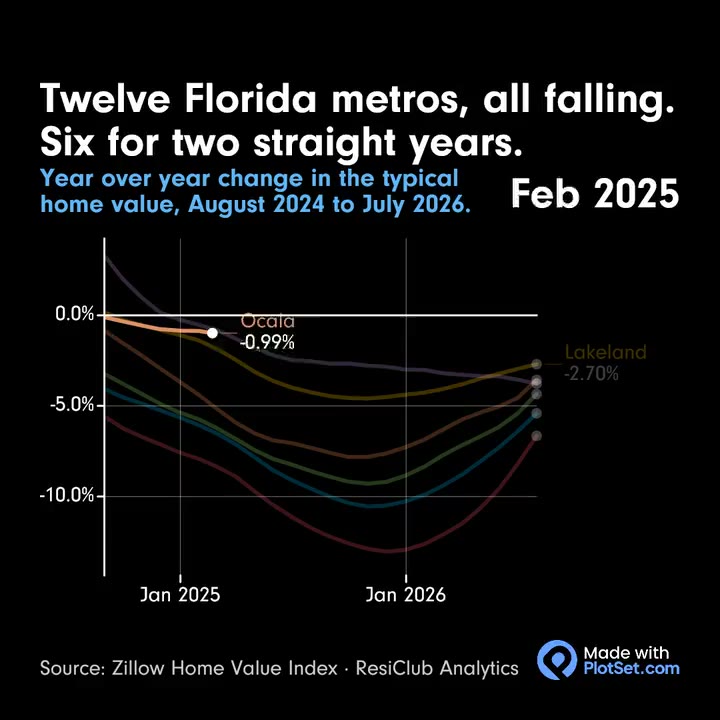 Home values are falling in all 12 Florida metros tracked
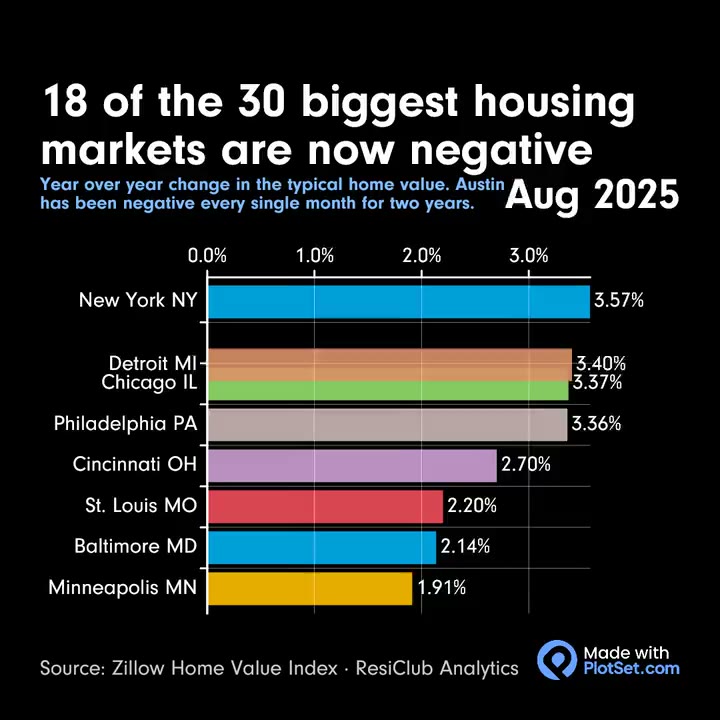 Most of the 30 biggest US housing markets are losing value
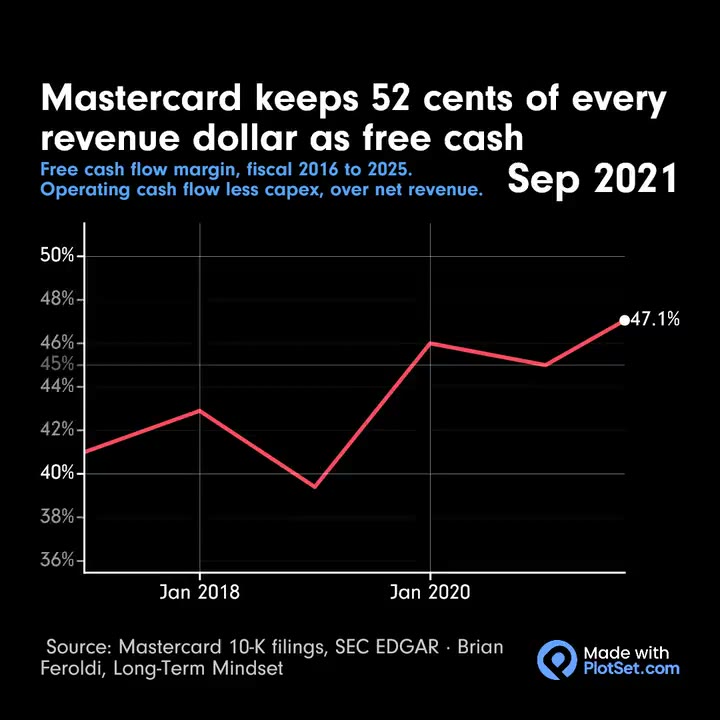 More than half of Mastercard's revenue ends up as free cash
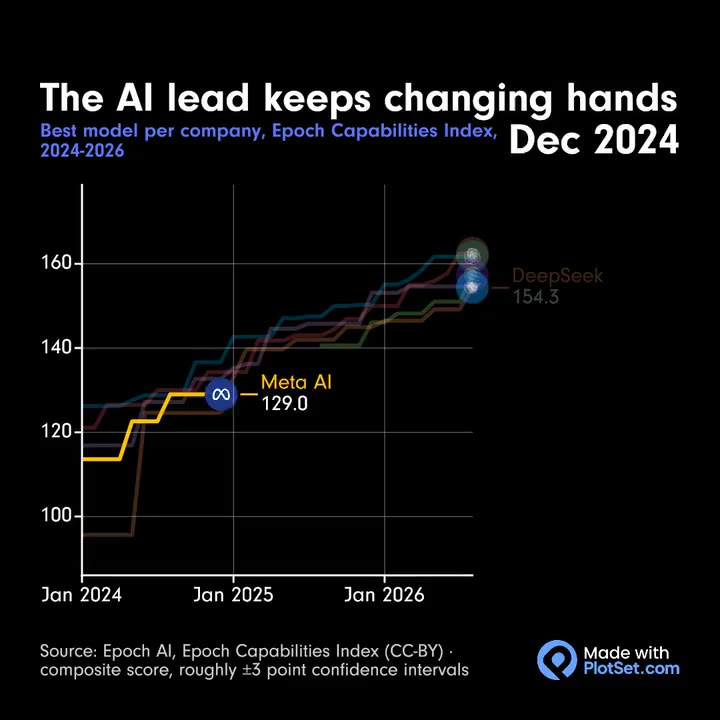 Anthropic edges OpenAI at the top of Epoch's AI index
 Radiology dominates the FDA's list of AI medical devices
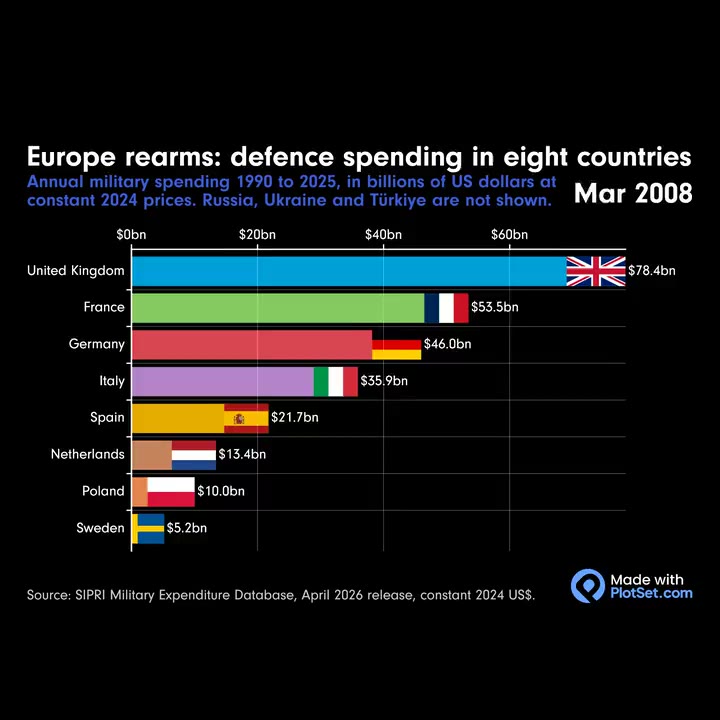 Germany now outspends the UK and France on defence
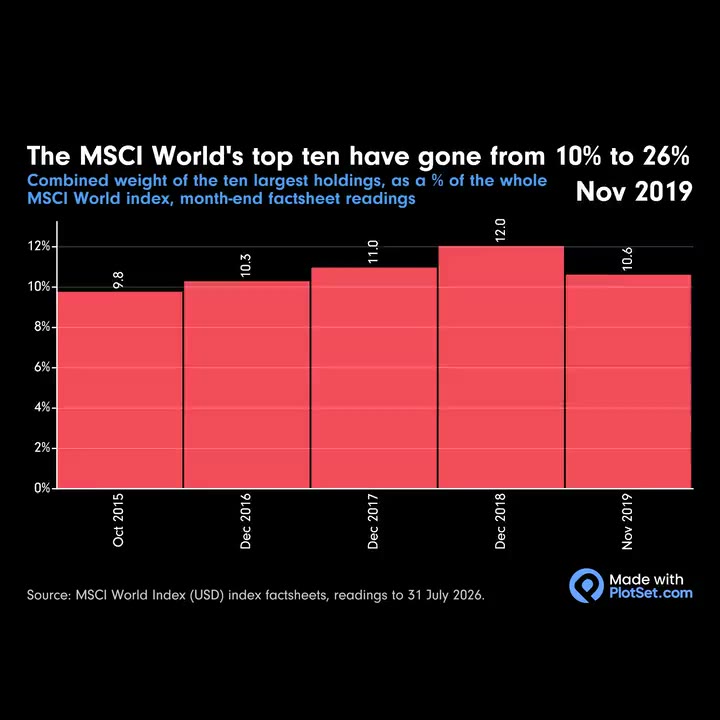 Ten holdings now make up 26% of the MSCI World index
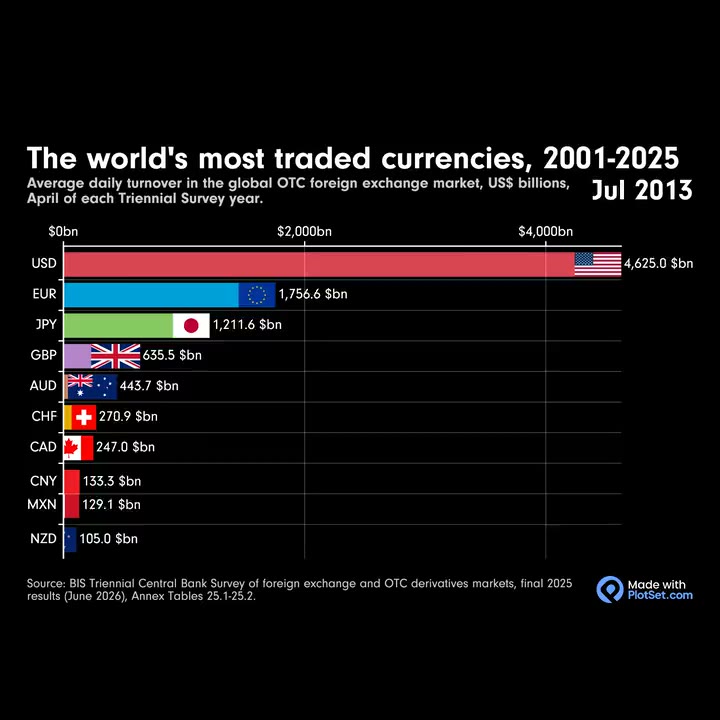 China's yuan is now the fifth most traded currency
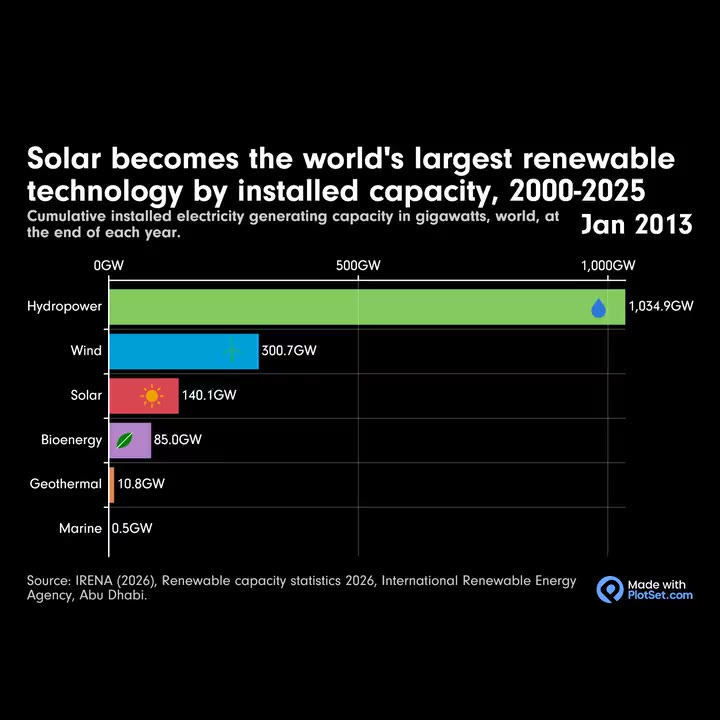 Solar overtakes hydropower in installed renewable capacity
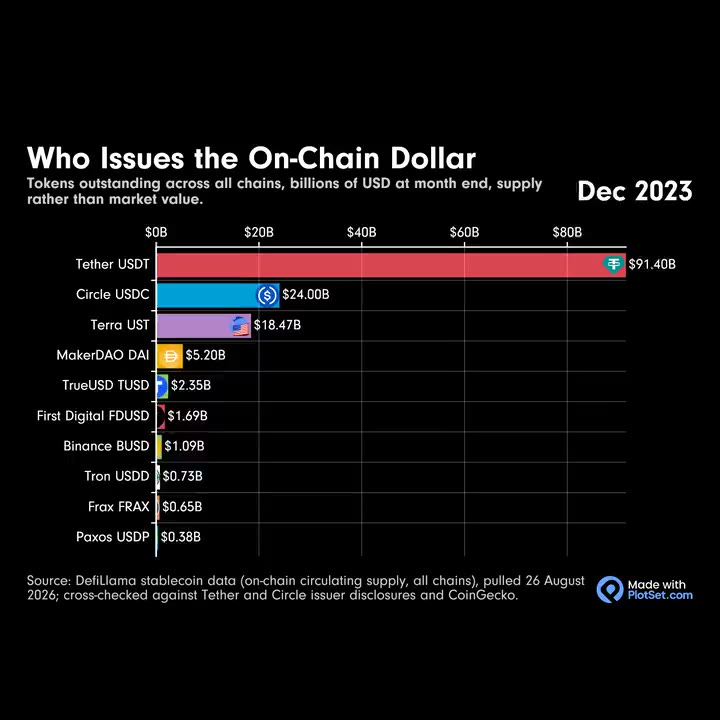 Tether issues more than twice as many dollars as Circle
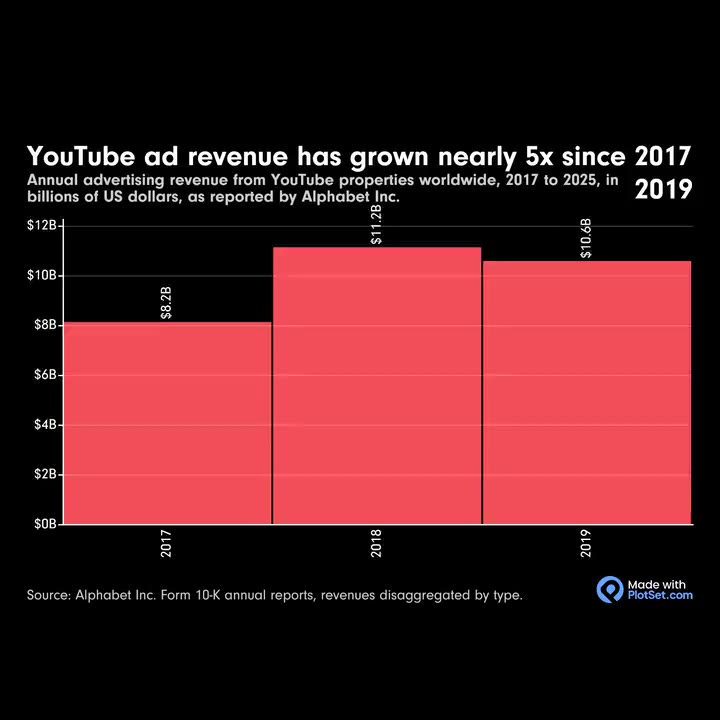 YouTube ad revenue topped $40 billion in 2025
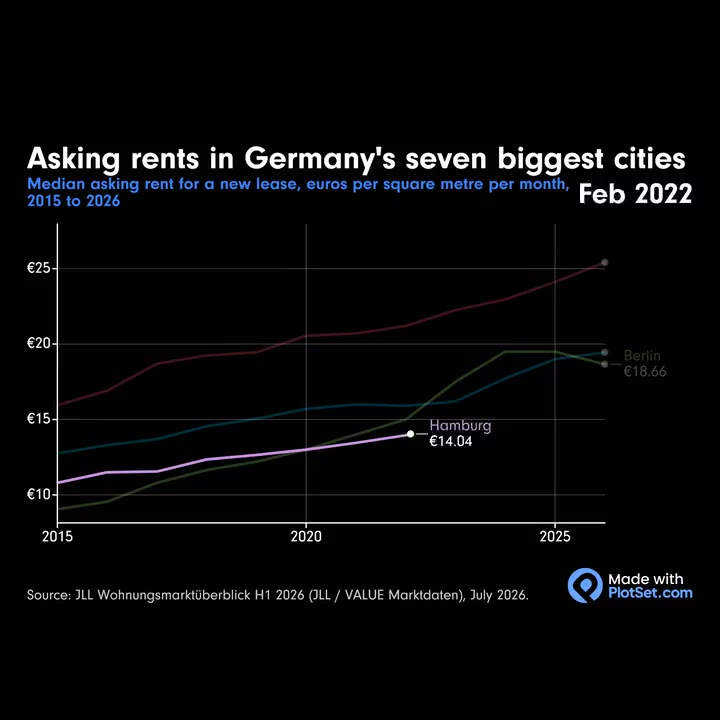 Munich asking rents pass €25, far above other German cities
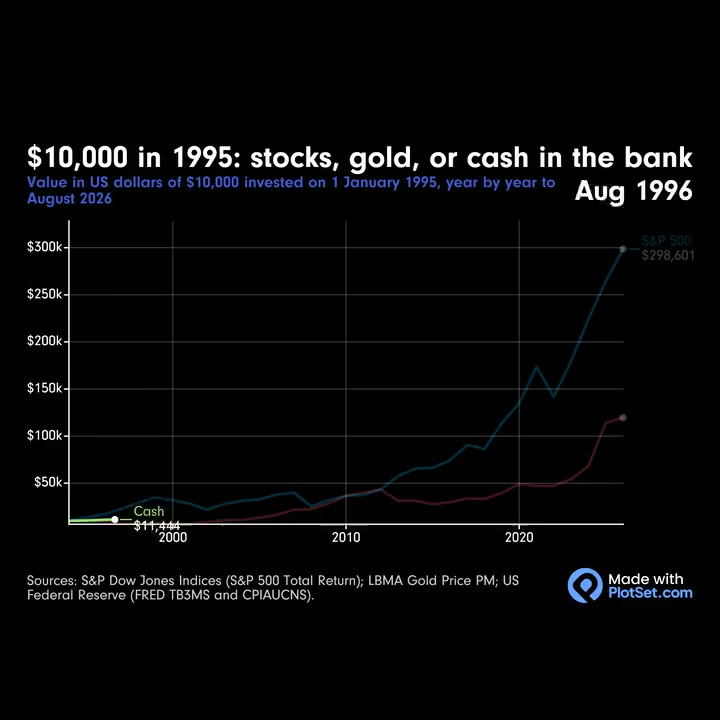 Cash in the bank since 1995 has not kept up with inflation
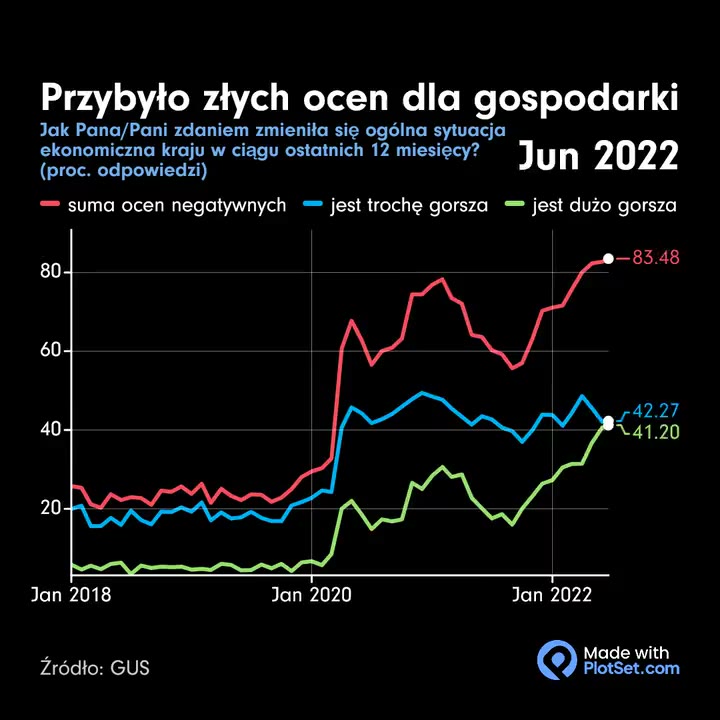 Half of Poles say the economy got worse over the past year
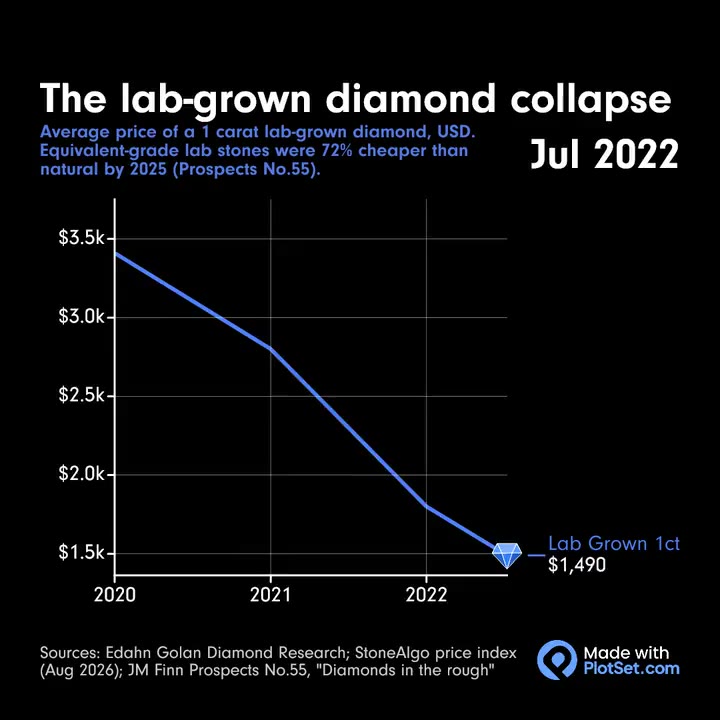 A one-carat lab-grown diamond averaged $516 by early 2026
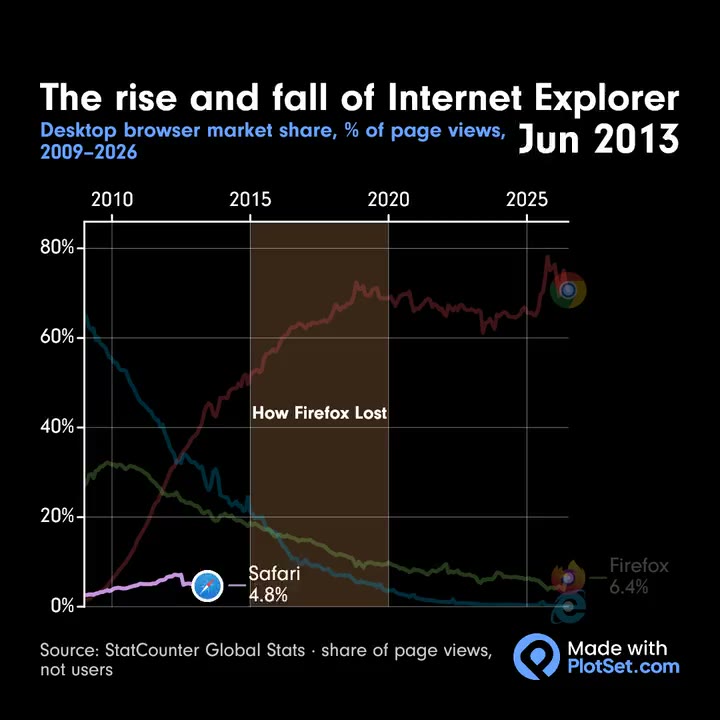 Chrome climbs to 70.7% of desktop browsing as IE fades
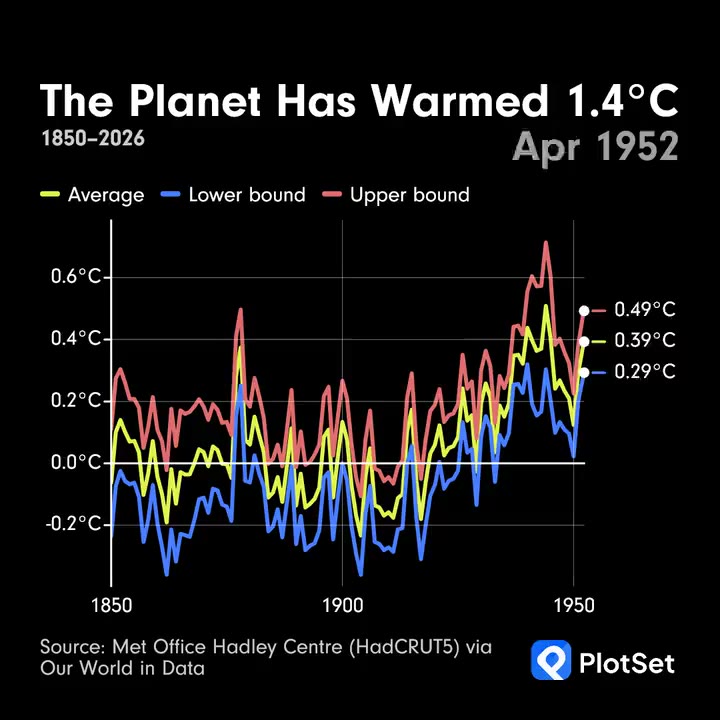 Planet's average temperature is up 1.4°C on Met Office data
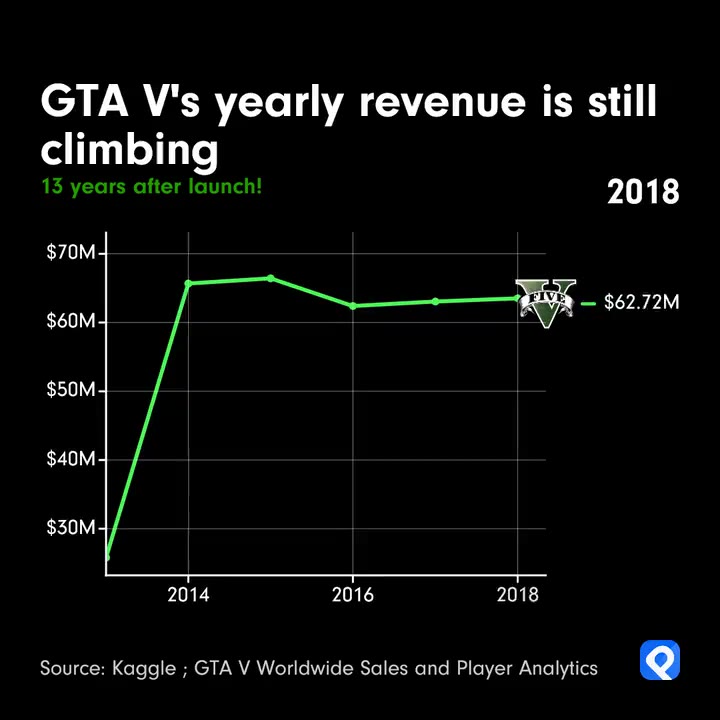 GTA V revenue is still growing 13 years after launch
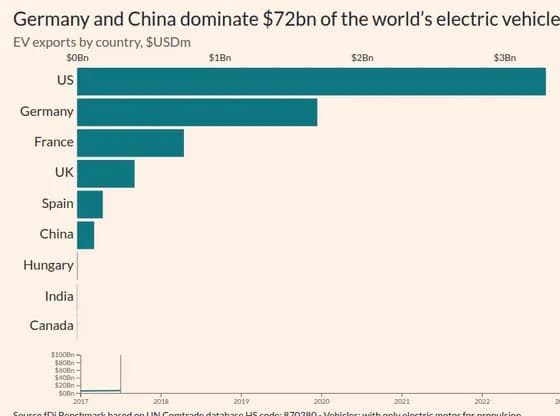 Animated chartsGermany and China dominate $72bn of the world’s electric vehicle exports
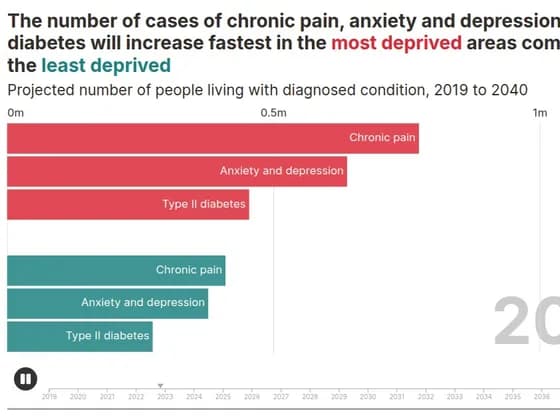 Animated chartsThe number of cases of chronic pain, anxiety and depression and diabetes will increase fastest…
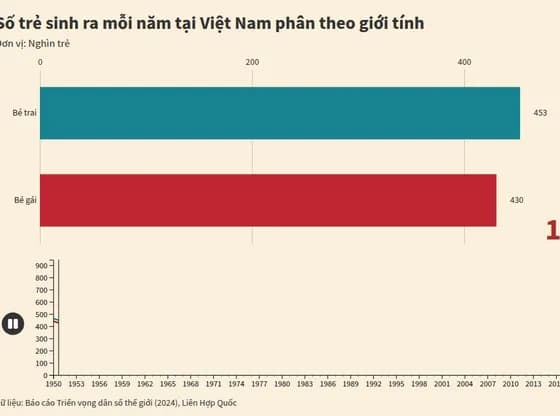 Animated chartsSố trẻ sinh ra mỗi năm tại Việt Nam phân theo giới tính
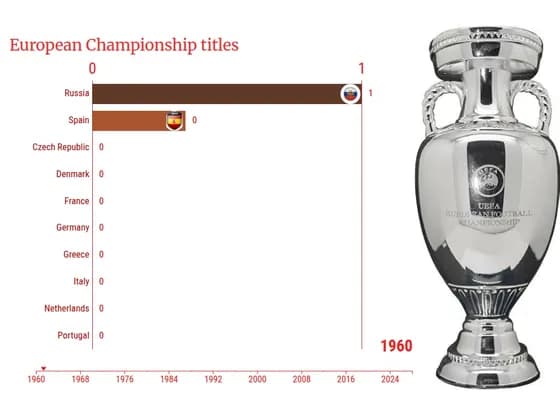 Animated chartsEuropean Championship titles
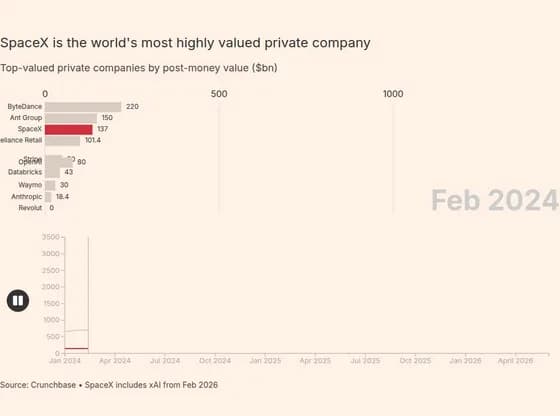 Animated chartsSpaceX is the world's most highly valued private company
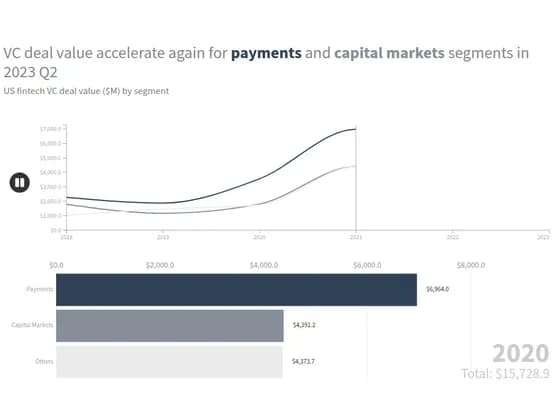 Animated chartsVC deal value accelerate again for payments and capital markets segments in 2023 Q2
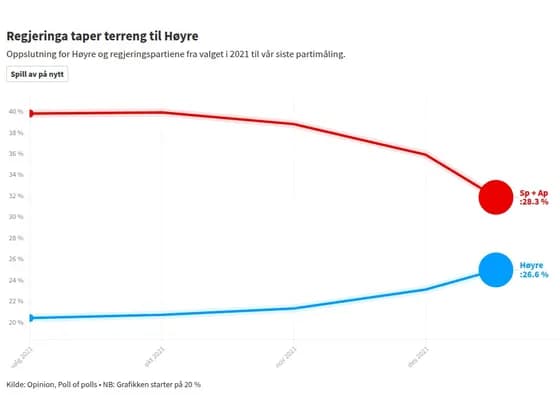 Animated chartsRegjeringa taper terreng til Høyre
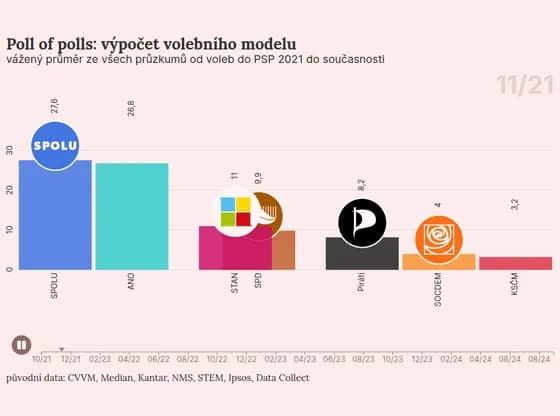 Animated chartsPoll of polls: výpočet volebního modelu
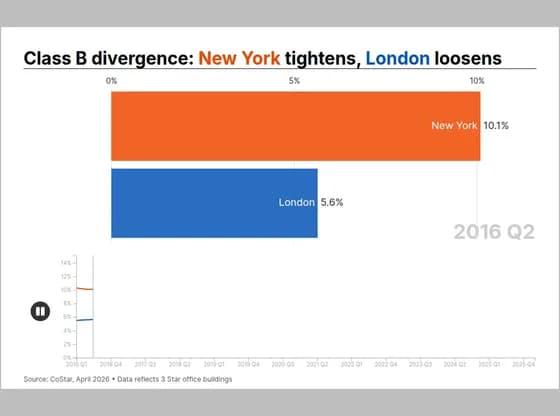 Animated chartsClass B divergence: New York tightens, London loosens
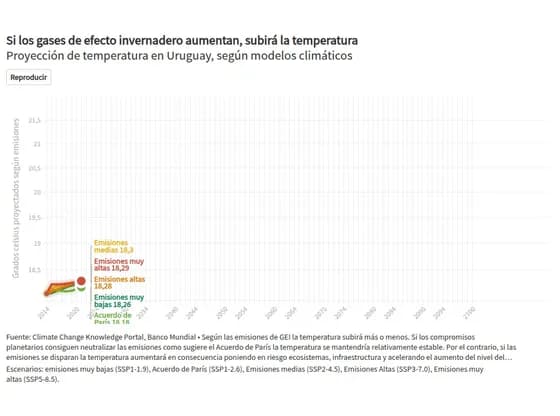 Animated chartsSi los gases de efecto invernadero aumentan, subirá la temperatura
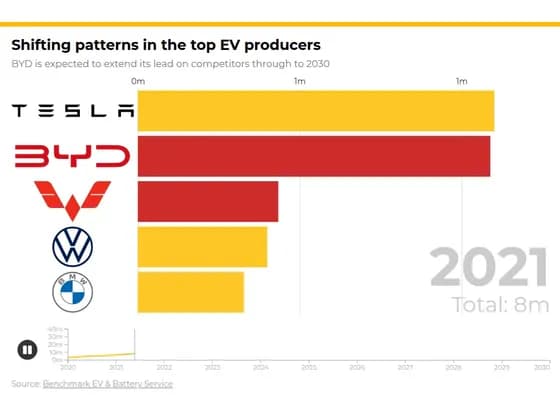 Animated chartsShifting patterns in the top EV producers
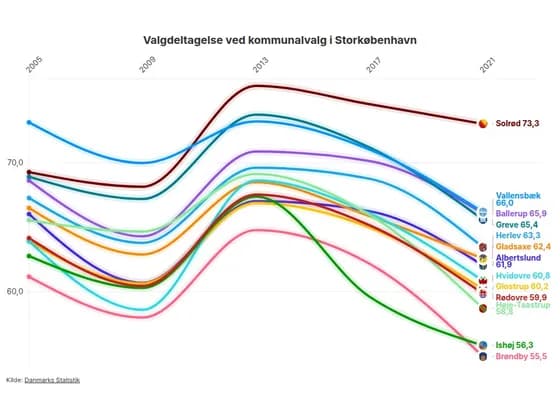 Animated chartsValgdeltagelse ved kommunalvalg i Storkøbenhavn
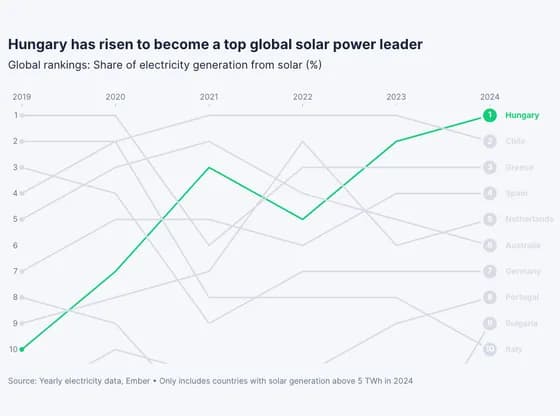 Animated chartsHungary has risen to become a top global solar power leader
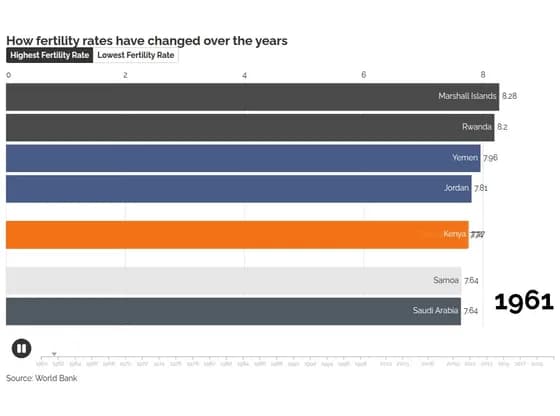 Animated chartsHow fertility rates have changed over the years
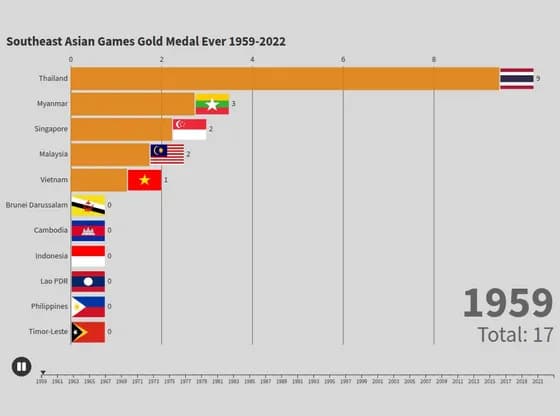 Animated chartsSoutheast Asian Games Gold Medal Ever 1959-2022
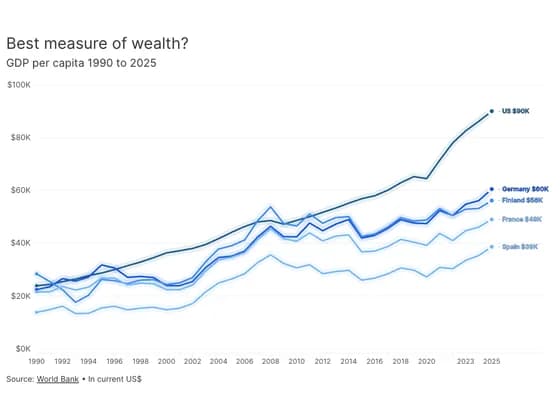 Animated chartsBest measure of wealth?
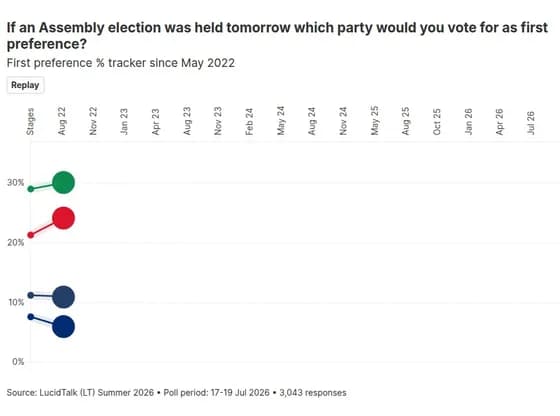 Animated chartsIf an Assembly election was held tomorrow which party would you vote for as first preference?
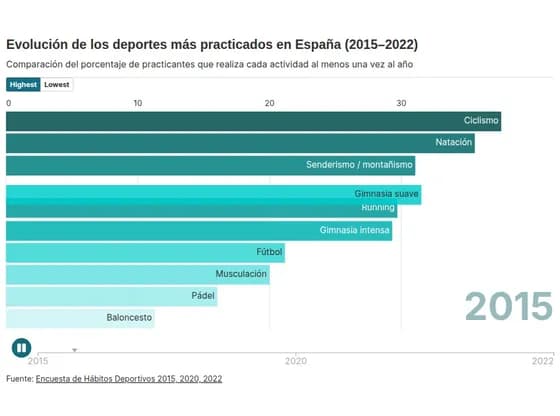 Animated chartsEvolución de los deportes más practicados en España (2015–2022)
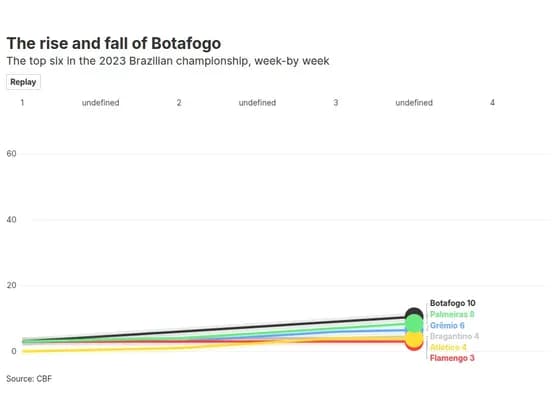 Animated chartsThe rise and fall of Botafogo
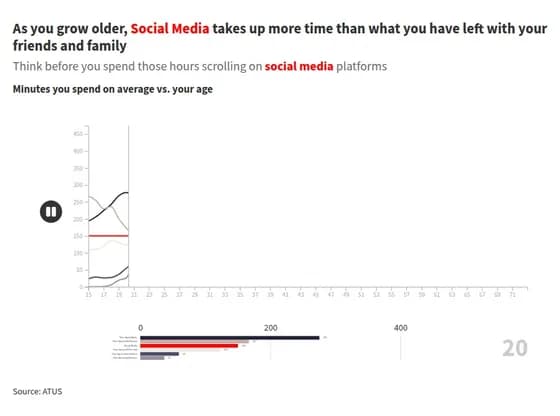 Animated chartsAs you grow older, Social Media takes up more time than what you have left with your friends and…
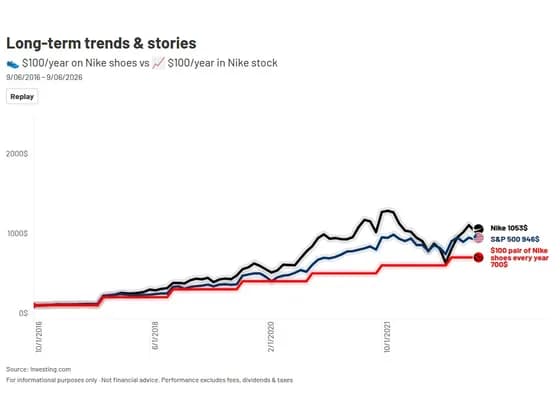 Animated chartsLong-term trends & stories
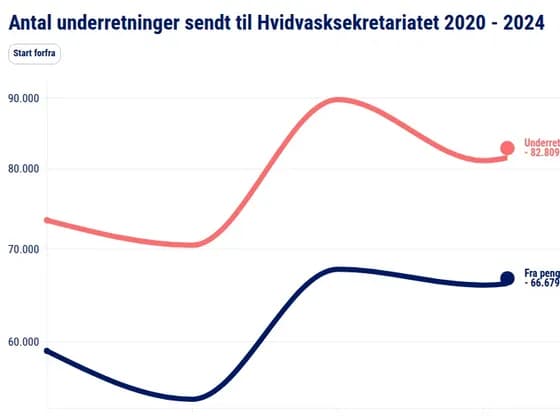 Animated chartsAntal underretninger sendt til Hvidvasksekretariatet 2020 - 2024
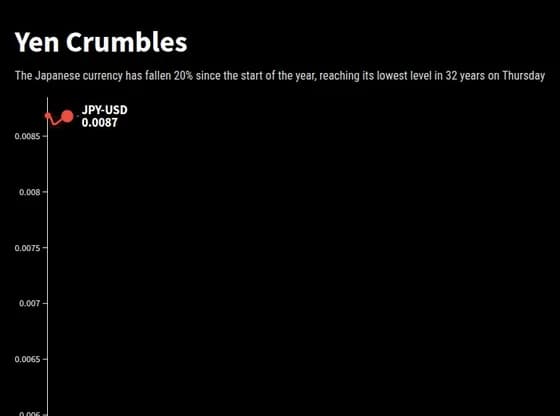 Animated chartsYen Crumbles
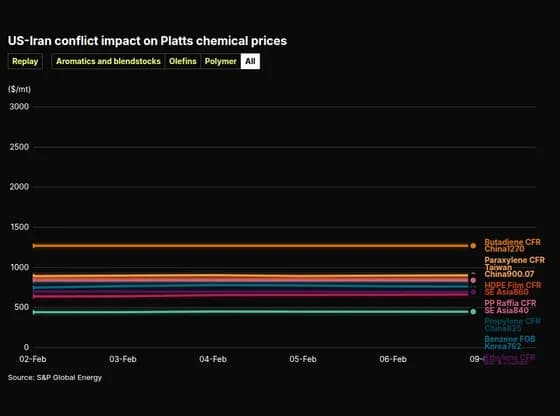 Animated chartsUS-Iran conflict impact on Platts chemical prices
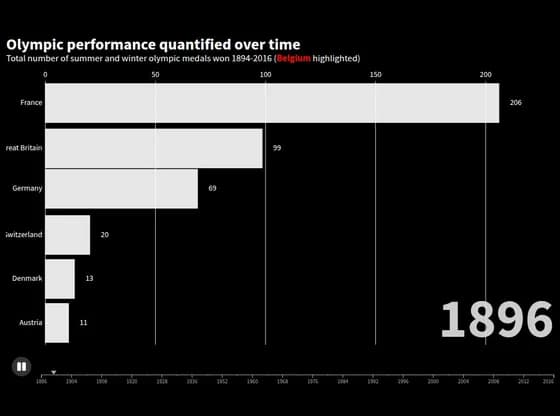 Animated chartsOlympic performance quantified over time
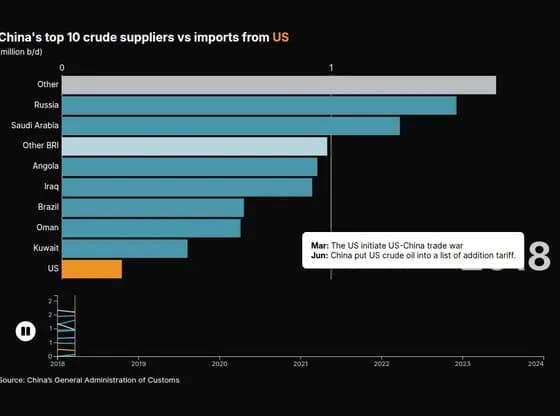 Animated chartsChina's top 10 crude suppliers vs imports from US
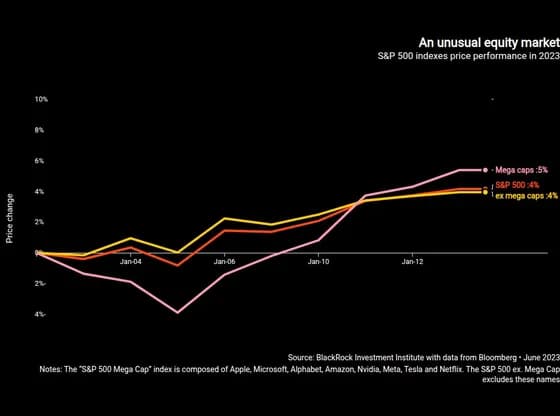 Animated chartsAn unusual equity market
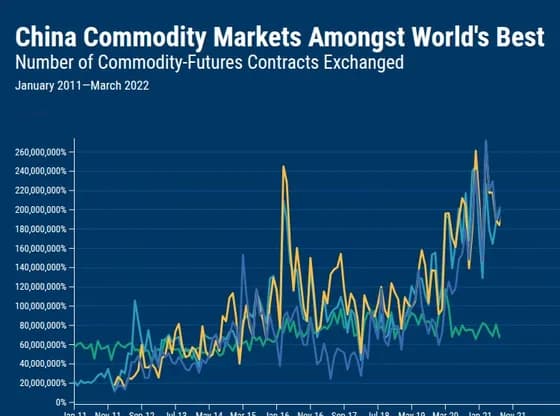 Animated chartsChina Commodity Markets Amongst World's Best
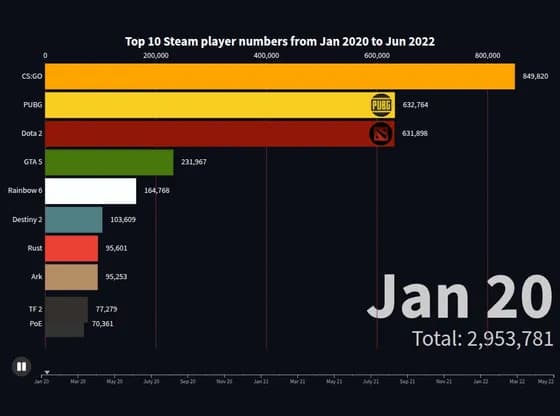 Animated chartsTop 10 Steam player numbers from Jan 2020 to Jun 2022
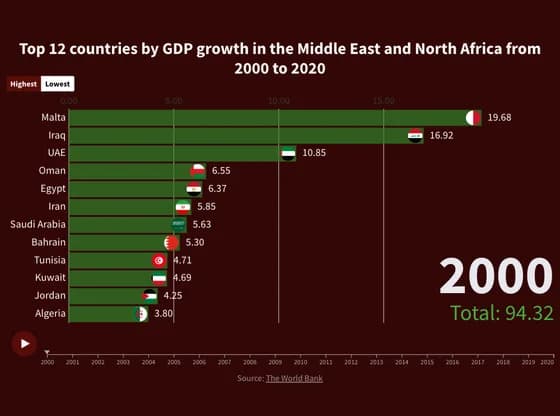 Animated chartsTop 12 countries by GDP growth in the Middle East and North Africa from 2000 to 2020
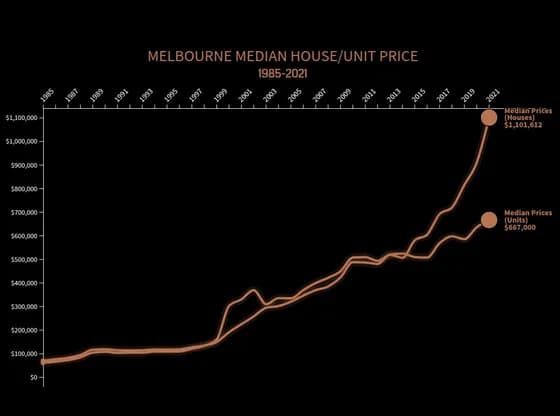 Animated chartsMELBOURNE MEDIAN HOUSE/UNIT PRICE
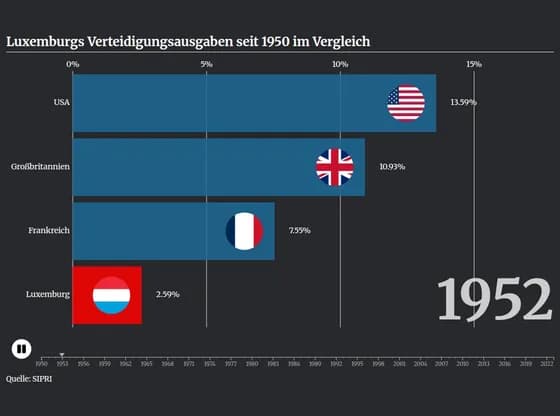 Animated chartsLuxemburgs Verteidigungsausgaben seit 1950 im Vergleich
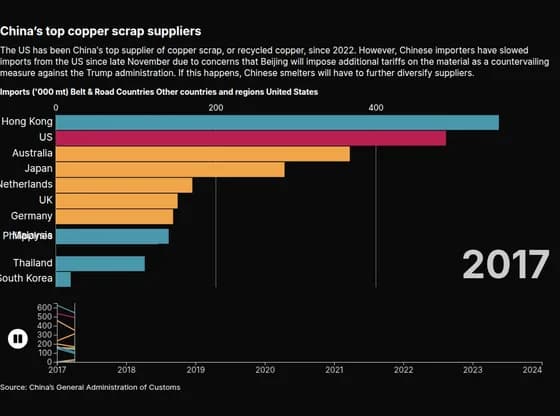 Animated chartsChina’s top copper scrap suppliers
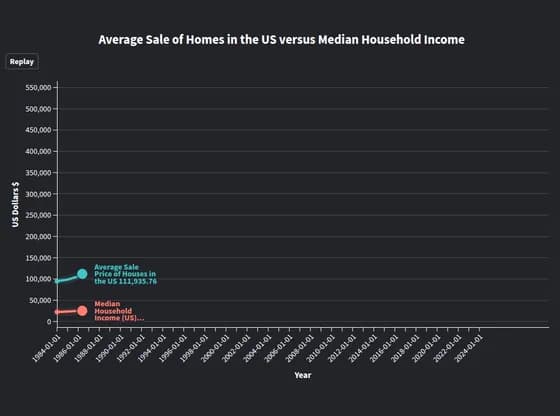 Animated chartsAverage Sale of Homes in the US versus Median Household Income
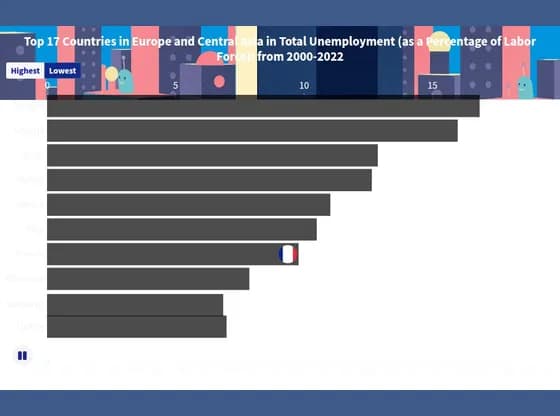 Animated chartsTop 17 Countries in Europe and Central Asia in Total Unemployment (as a Percentage of Labor…
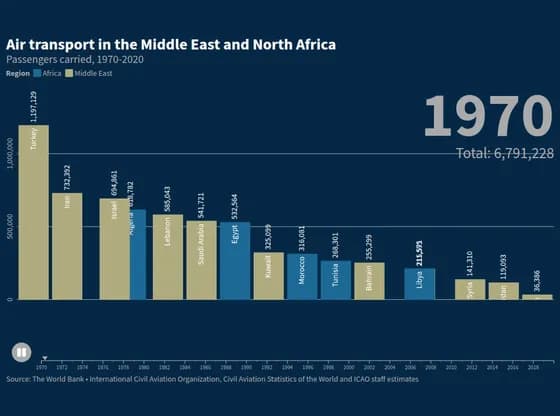 Animated chartsAir transport in the Middle East and North Africa
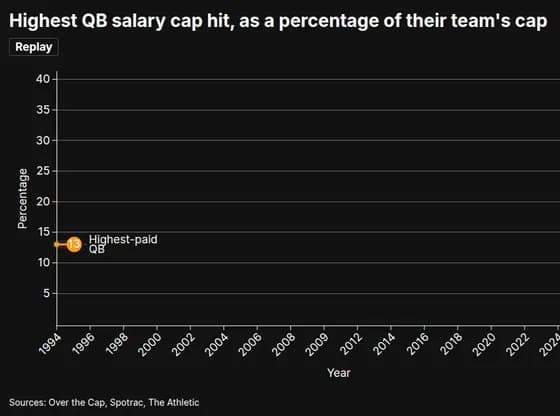 Animated chartsHighest QB salary cap hit, as a percentage of their team's cap
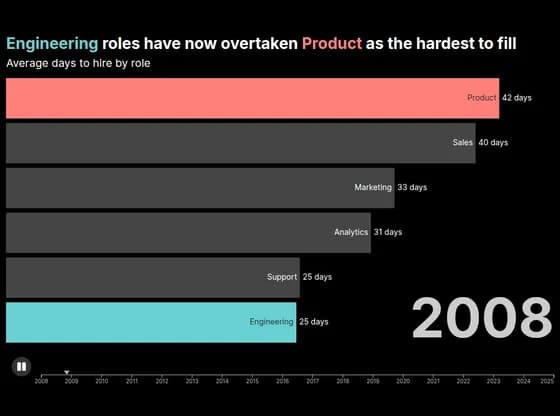 Animated chartsEngineering roles have now overtaken Product as the hardest to fill
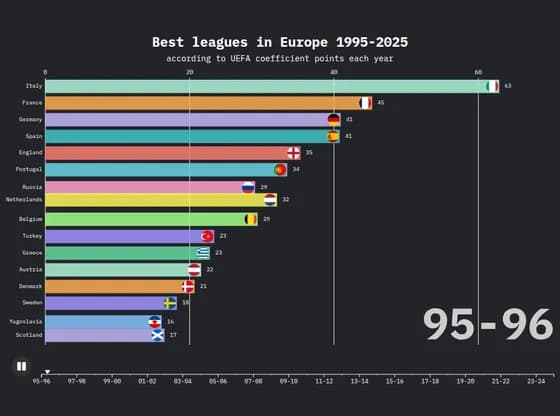 Animated chartsBest leagues in Europe 1995-2025
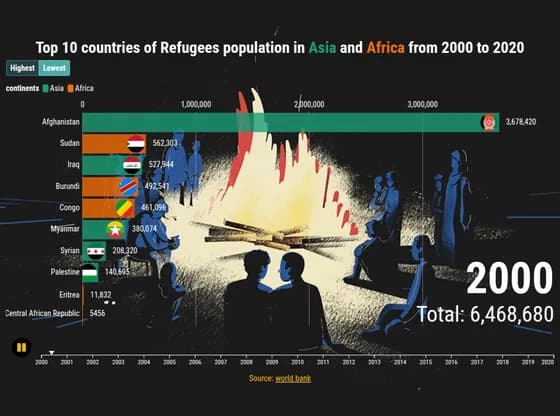 Animated chartsTop 10 countries of Refugees population in Asia and Africa from 2000 to 2020