
Every chart here started as a spreadsheet.
Maps, bar chart races, treemaps, pictograms and more. Open one and remake it with your own data.
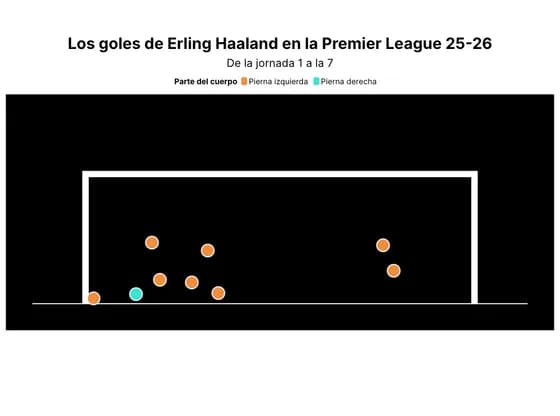 SportsLos goles de Erling Haaland en la Premier League 25-26
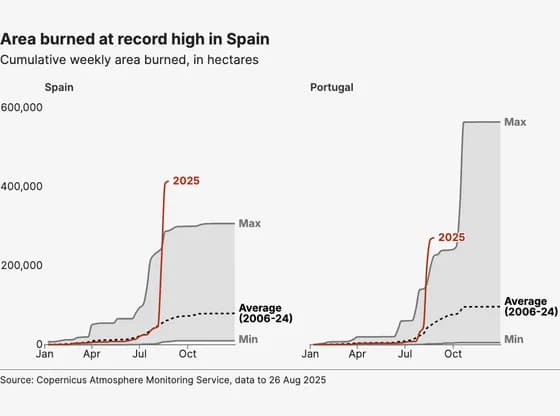 Line, bar and pie chartsArea burned at record high in Spain
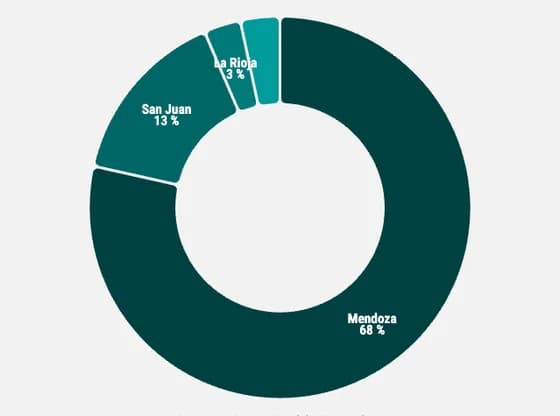 Line, bar and pie chartsDistribution of wine production volume in argentina by region
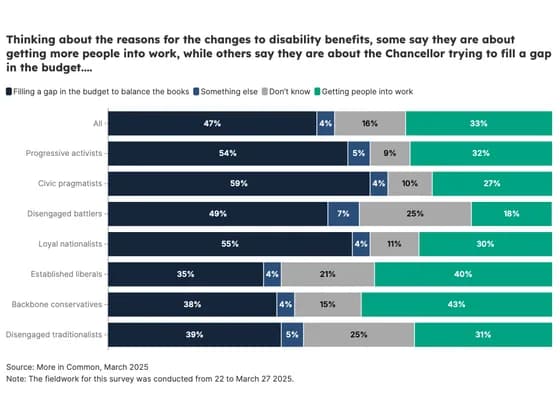 Line, bar and pie chartsThinking about the reasons for the changes to disability benefits, some say they are about…
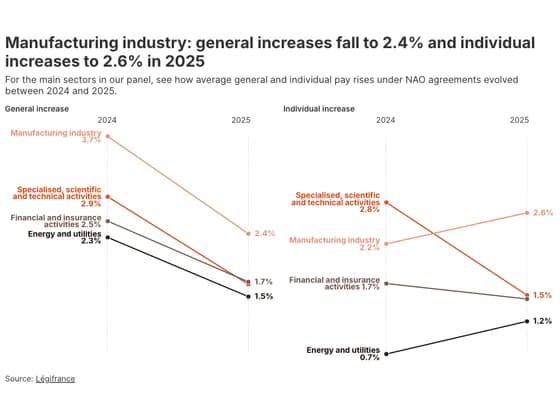 Slope chartManufacturing industry: general increases fall to 2.4% and individual increases to 2.6% in 2025
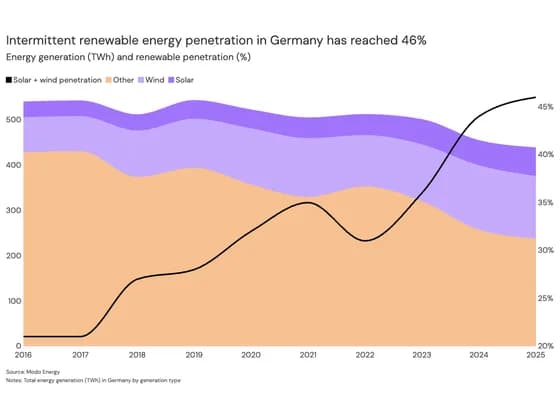 Line, bar and pie chartsIntermittent renewable energy penetration in Germany has reached 46%
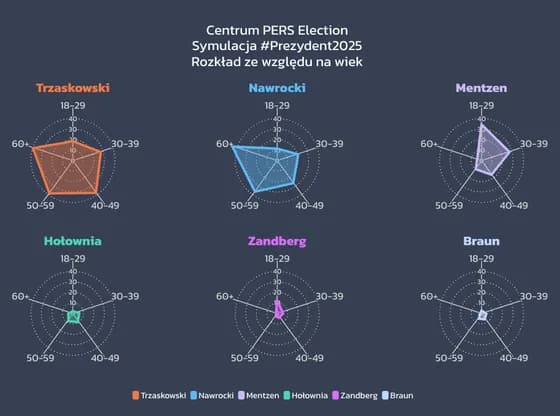 Radar chartPajęczyny wieku
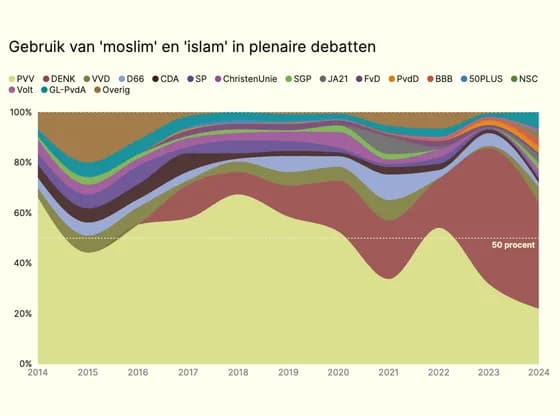 Line, bar and pie chartsGebruik van 'moslim' en 'islam' in plenaire debatten
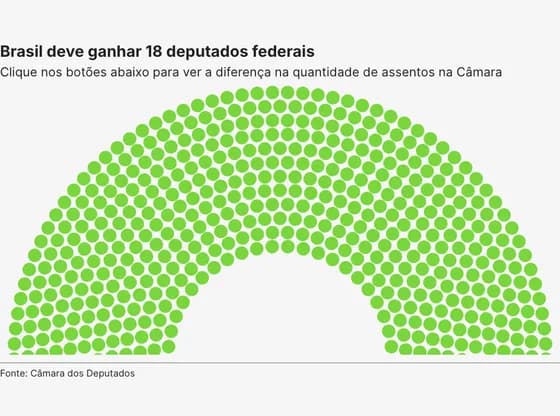 Elections and parliamentsBrasil deve ganhar 18 deputados federais
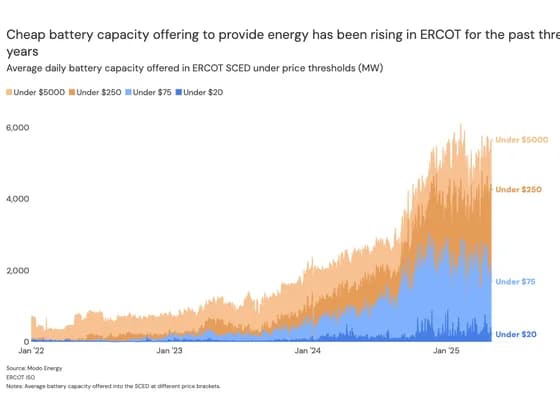 Line, bar and pie chartsCheap battery capacity offering to provide energy has been rising in ERCOT for the past three years
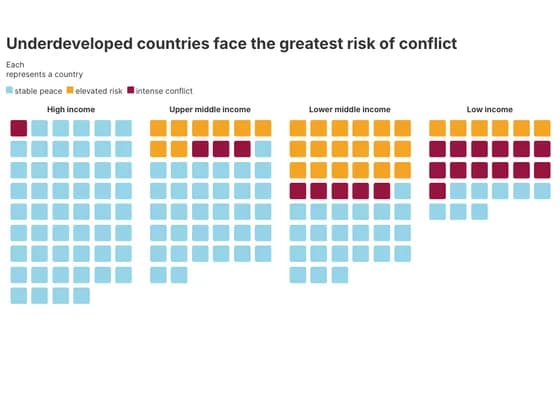 PictogramUnderdeveloped countries face the greatest risk of conflict
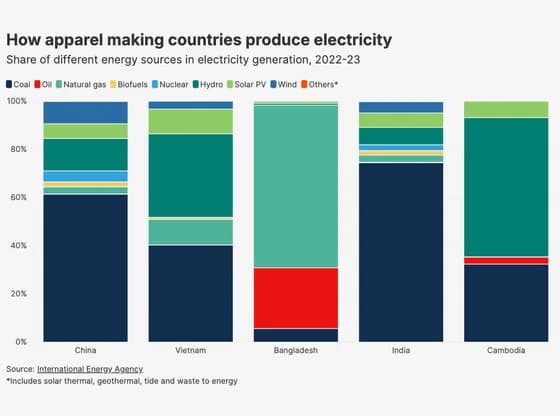 Line, bar and pie chartsHow apparel making countries produce electricity
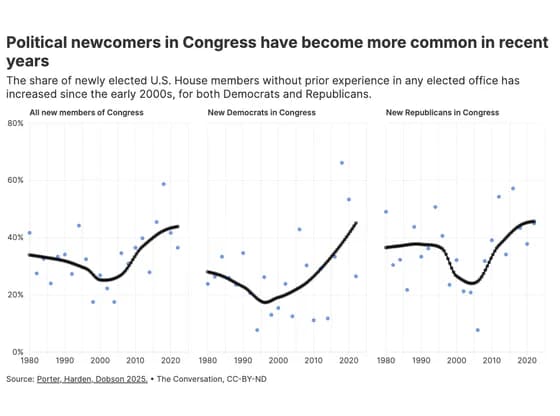 ScatterPolitical newcomers in Congress have become more common in recent years
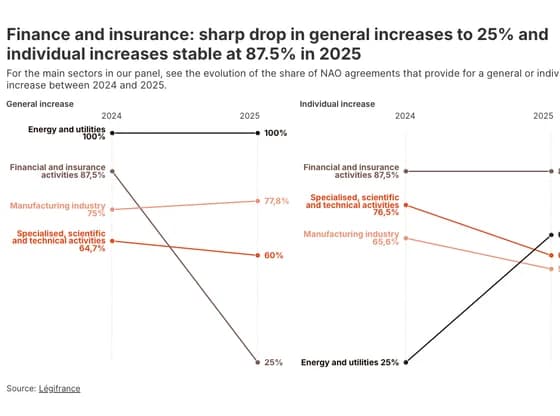 Slope chartFinance and insurance: sharp drop in general increases to 25% and individual increases stable at…
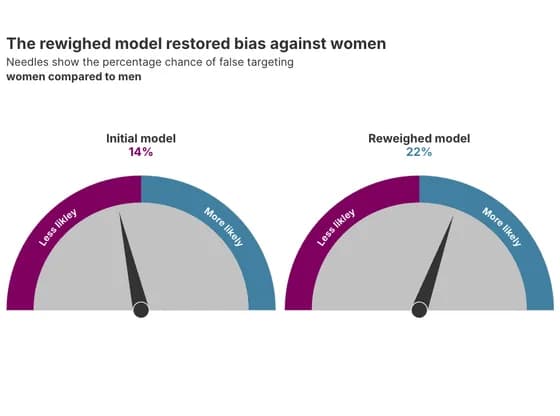 Counters and gaugesThe rewighed model restored bias against women
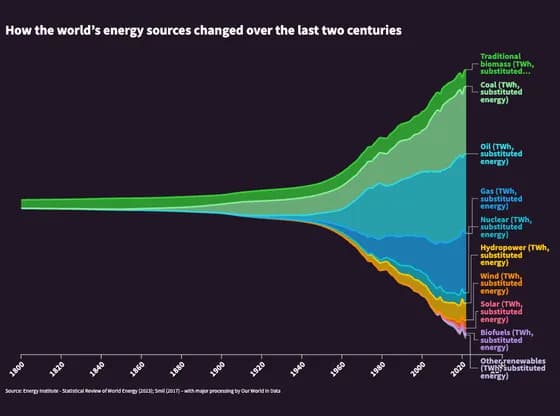 Line, bar and pie chartsHow the world’s energy sources changed over the last two centuries
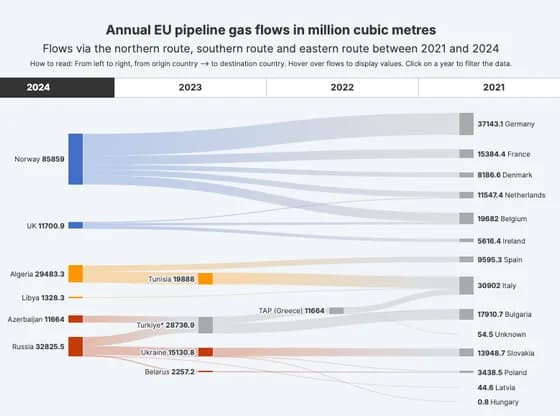 Sankey diagramAnnual EU pipeline gas flows in million cubic metres
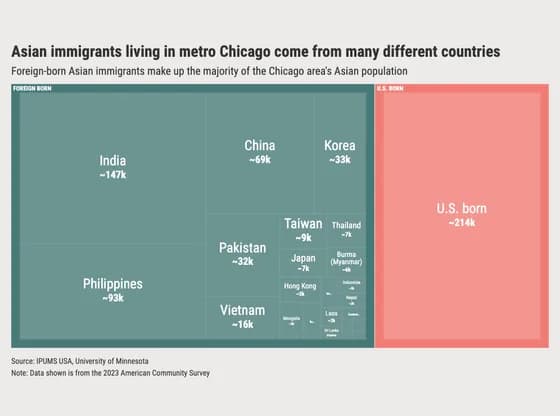 HierarchyAsian immigrants living in metro Chicago come from many different countries
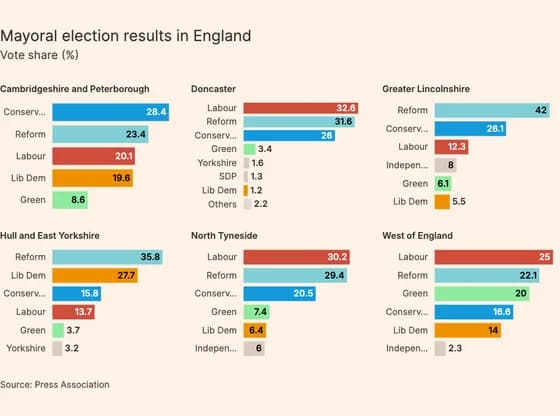 Line, bar and pie chartsMayoral election results in England
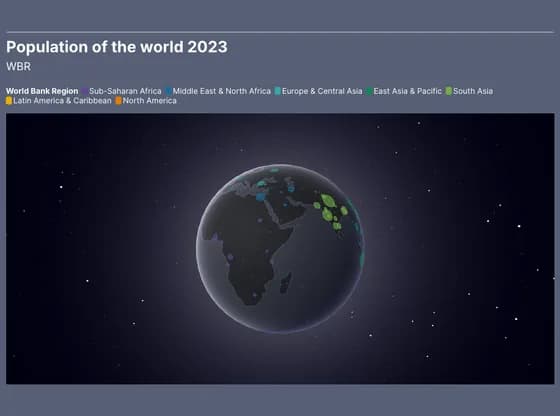 3D globePopulation of the world 2023