
Every chart here started as a spreadsheet.
Maps, bar chart races, treemaps, pictograms and more. Open one and remake it with your own data.
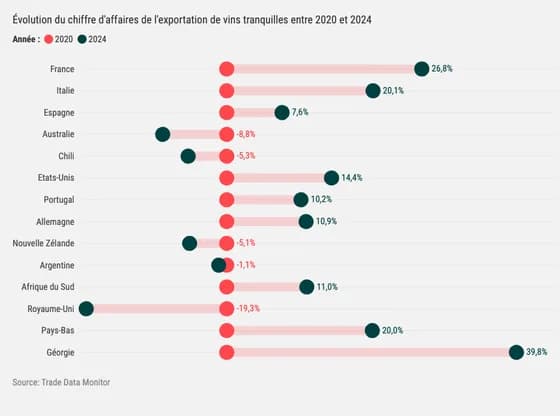 ScatterÉvolution du chiffre d'affaires de l'exportation de vins tranquilles entre 2020 et 2024
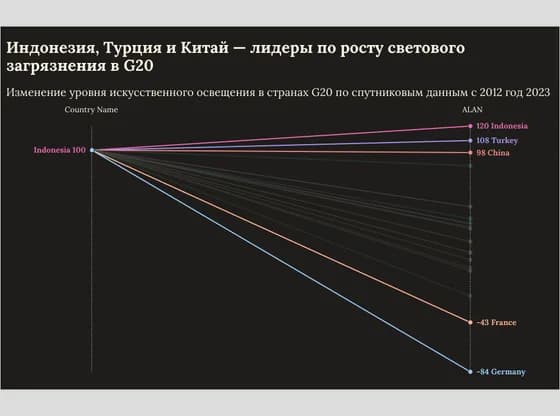 Slope chartИндонезия, Турция и Китай — лидеры по росту светового загрязнения в G20
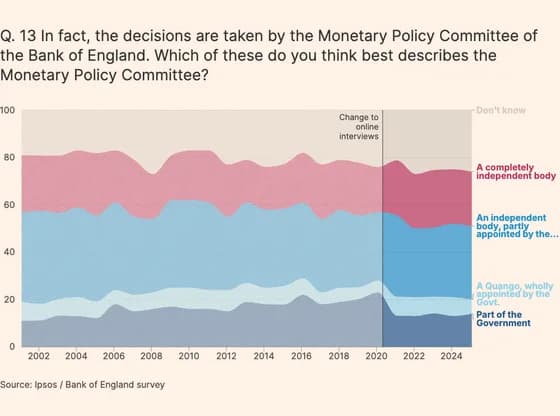 Line, bar and pie chartsQ. 13 In fact, the decisions are taken by the Monetary Policy Committee of the Bank of England.…
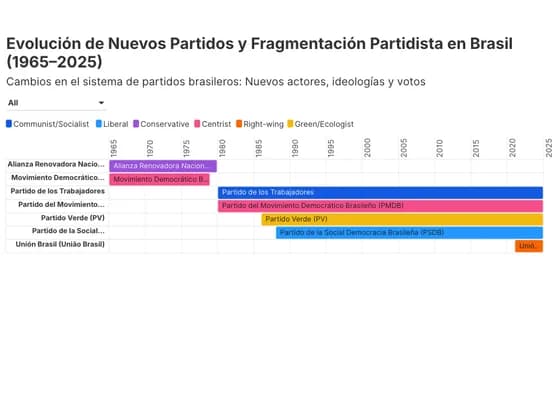 Gantt chartEvolución de Nuevos Partidos y Fragmentación Partidista en Brasil (1965–2025)
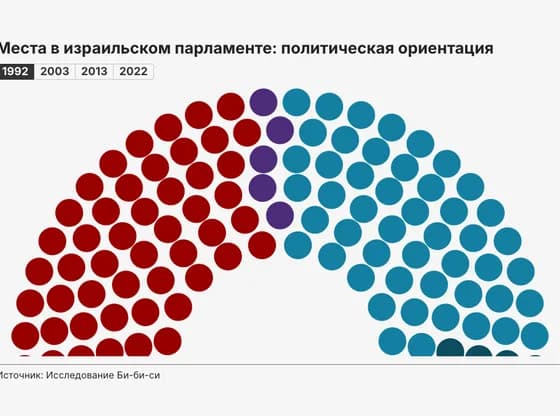 Elections and parliamentsМеста в израильском парламенте: политическая ориентация
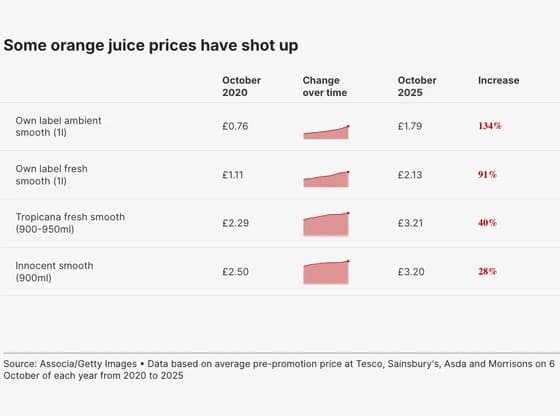 TableSome orange juice prices have shot up
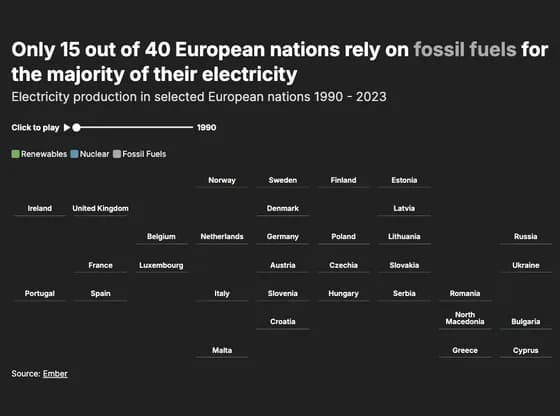 Line, bar and pie chartsOnly 15 out of 40 European nations rely on fossil fuels for the majority of their electricity
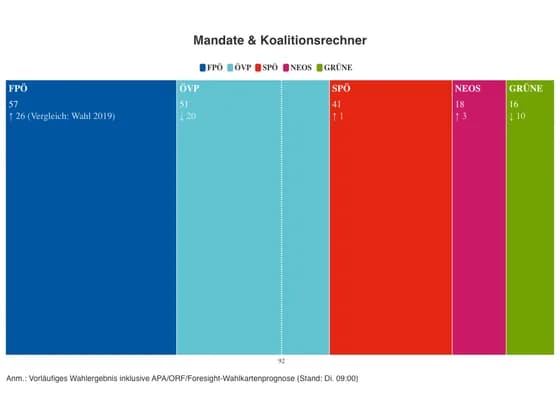 Elections and parliamentsMandate & Koalitionsrechner
 3D globeMIT Jameel Clinic AI Hospital Network
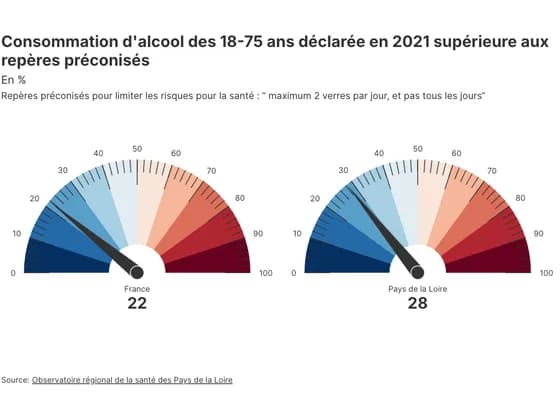 Counters and gaugesConsommation d'alcool des 18-75 ans déclarée en 2021 supérieure aux repères préconisés
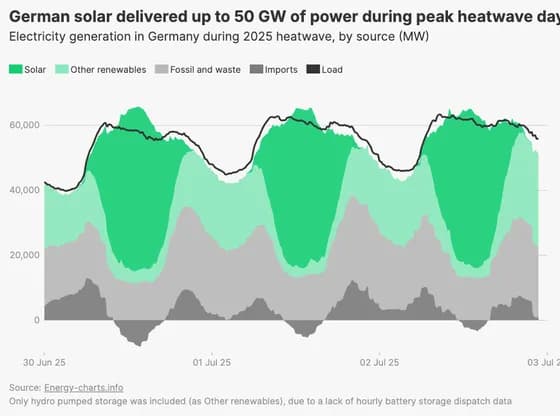 Line, bar and pie chartsGerman solar delivered up to 50 GW of power during peak heatwave days
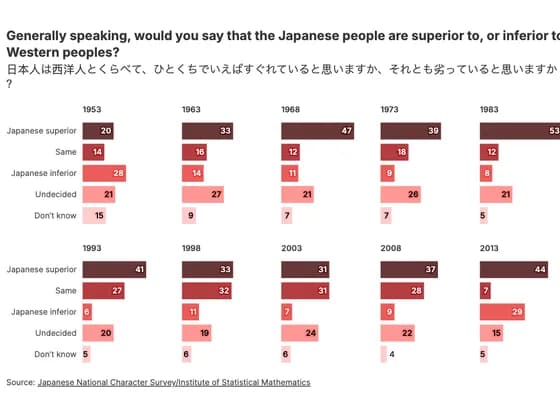 Line, bar and pie chartsGenerally speaking, would you say that the Japanese people are superior to, or inferior to…
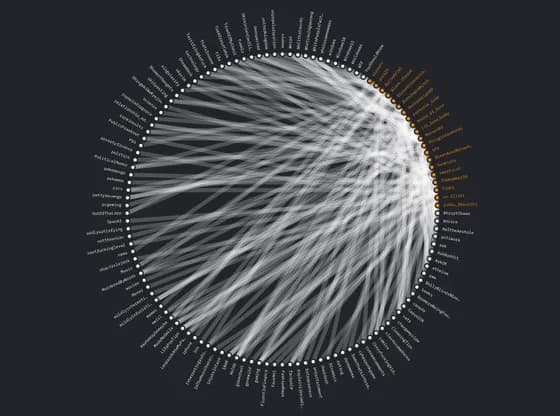 Network graph#784 Connections
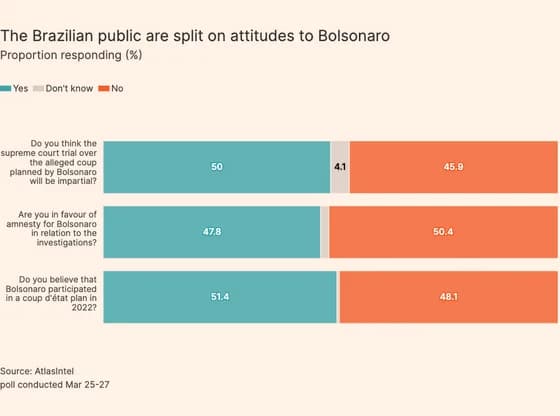 Line, bar and pie chartsThe Brazilian public are split on attitudes to Bolsonaro
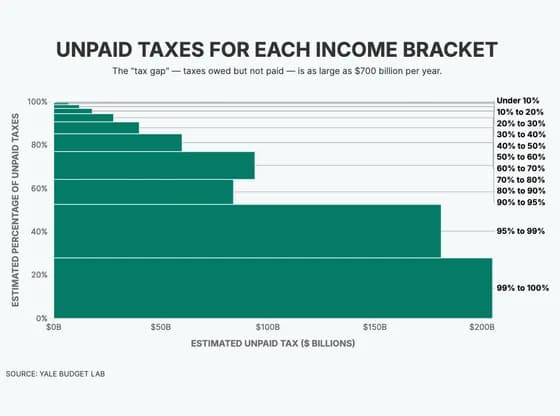 MarimekkoUNPAID TAXES FOR EACH INCOME BRACKET
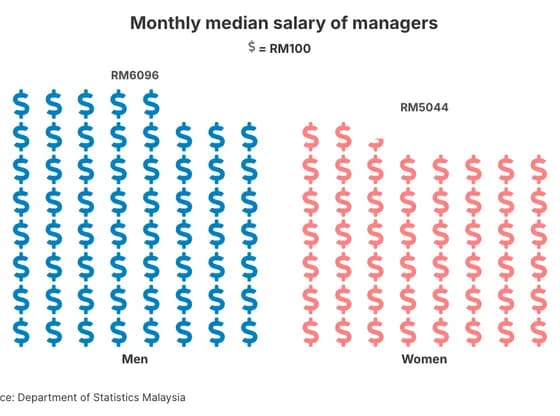 PictogramMonthly median salary of managers
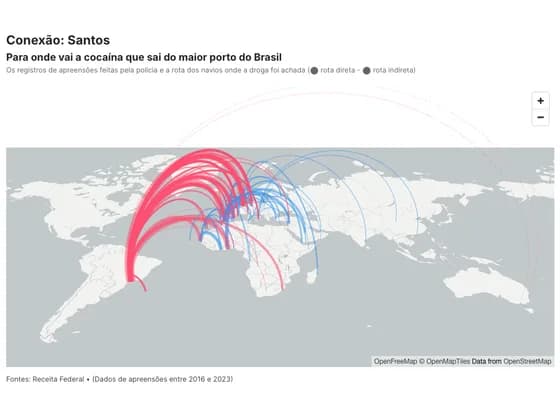 3D mapConexão: Santos
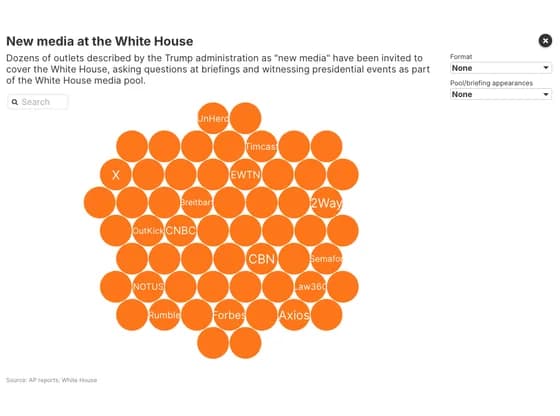 Interactive toolsNew media at the White House
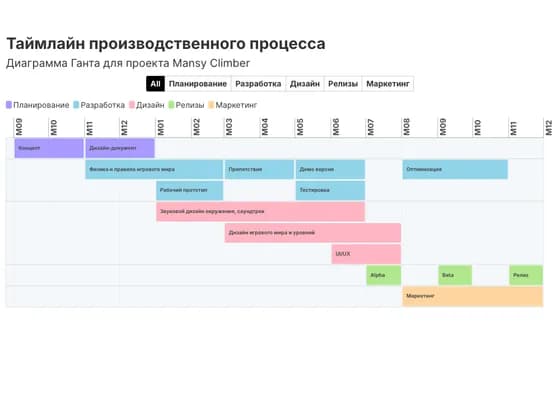 Gantt chartТаймлайн производственного процесса
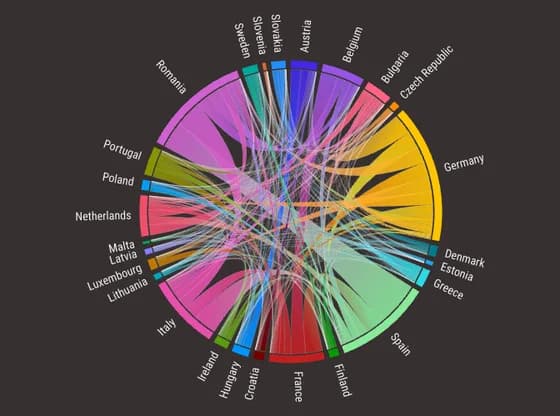 Network graphFlujos migratorios entre países de la UE (2022)