
Beispiel-CSV
| Department | Headcount |
|---|---|
| Engineering | 84 |
| Sales | 52 |
| Customer Support | 37 |
| Marketing | 29 |
| Finance | 18 |
| Operations | 15 |
A step by step walkthrough for turning a spreadsheet into a published bar chart in PlotSet, from shaping the sheet to exporting or embedding the finished chart.
Etwa 6 MinutenBy the end of this guide you will have a published, interactive bar chart built from your own spreadsheet: sorted, labelled, coloured on purpose, and either embedded on a page or exported as an image for a deck. Not a screenshot of someone else's example, your own categories and your own numbers, going through the same click path a real PlotSet chart takes from upload to publish.
If your spreadsheet is already in two columns, category and value, this takes about five minutes. Add ten more if you are still cleaning up a messier export: merging duplicate category names, deciding what to do with a stray blank row, or pulling one column out of a wider report. Budget the six minutes below and treat the rest as a buffer.
Two columns, one row per category: the category name first, the number second. No totals row, no merged cells, one header row.
| Department | Headcount |
|---|---|
| Engineering | 84 |
| Sales | 52 |
| Customer Support | 37 |
| Marketing | 29 |
| Finance | 18 |
| Operations | 15 |
Keep the category column as plain text. If a spreadsheet turns "Q1" or a department code into a date or a formula result, PlotSet will chart the underlying value, not the label you intended.
One number per category. If you are tracking a category across several time periods, that is a grouped or stacked bar chart, not this one: see the grouped bar chart guide for the extra column that setup needs.
Delete any totals or subtotals row before uploading. A "Total" row uploaded as data becomes a bar of its own, usually the tallest one, and throws off the sort.
Blank cells in the value column render as zero-length bars rather than being skipped. Fill them in or remove the row.
Der genaue Klickpfad in PlotSet, von einer leeren Vorlage bis zum fertigen Diagramm.
From the PlotSet dashboard, start a new project and choose the Bar Chart template. It loads with sample data already in place so you can see the exact column layout PlotSet expects before you touch your own file.

Put the category name in the first column and its number in the second, one row per category. If your source data is a pivot table or a report with subtotals, strip those out first: the upload should be nothing but categories and values.
Use the data panel to import a CSV or .xlsx file, paste rows directly from a spreadsheet, or connect a Google Sheet if you want the chart to pick up edits later without a re-upload. PlotSet reads the first row as headers automatically.

Confirm which column feeds the category axis and which feeds the bar length. This is usually automatic when your headers are clear, but check it manually if your sheet has extra columns PlotSet might have guessed wrong on.

Switch the sort to descending by value unless your categories already have a natural order, such as age brackets or survey ratings. A sorted chart shows the ranking at a glance; an unsorted one makes the reader hunt for it.
Turn on labels at the end of each bar so the exact number is readable without measuring against the axis. Once every bar carries its own number, the background gridlines are usually redundant and the chart reads cleaner without them.
With a single series, one consistent colour is correct: colour is not carrying any information here, so a rainbow of bar colours only adds visual noise. Save a second colour for a highlight if you want to draw attention to one specific bar. Add a chart title that states the comparison, not just the metric.
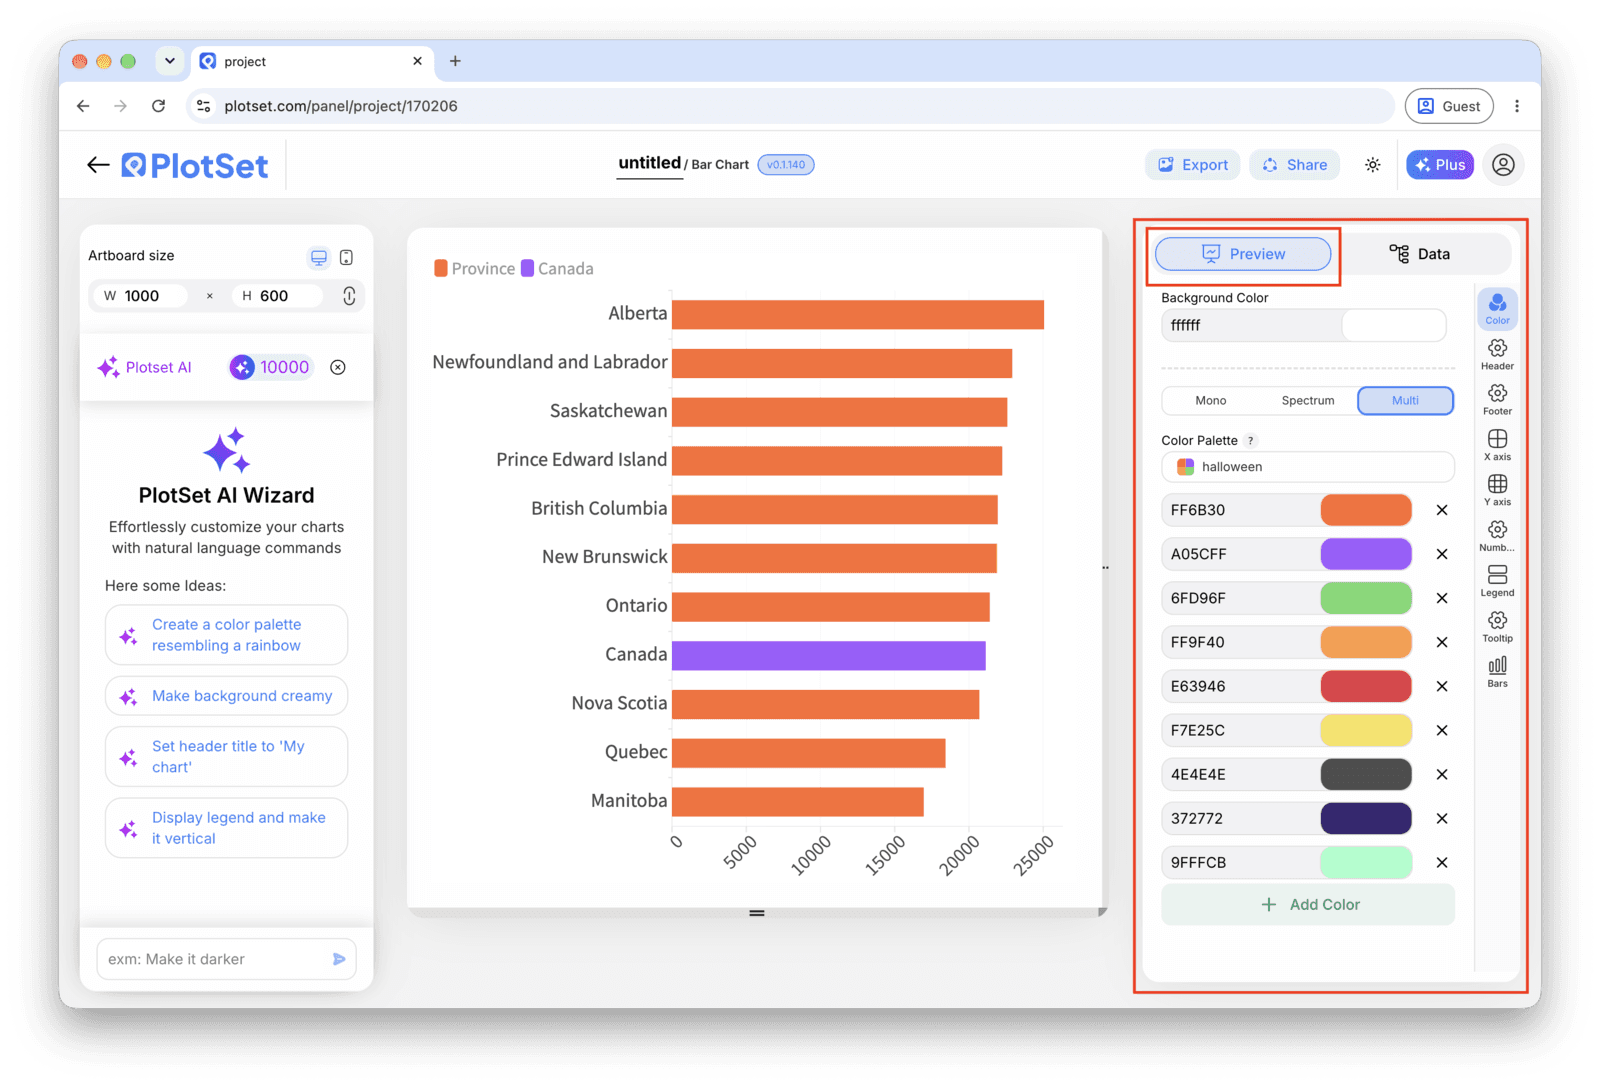
Publish for a live, interactive chart with hover tooltips and a shareable link, grab the embed code to drop it into a page, or export a PNG, SVG or PDF if you need a static image for a deck or a report.
Starten Sie mit der Bar Chart-Vorlage samt bereits geladenen Beispieldaten und ersetzen Sie diese durch Ihre eigenen.
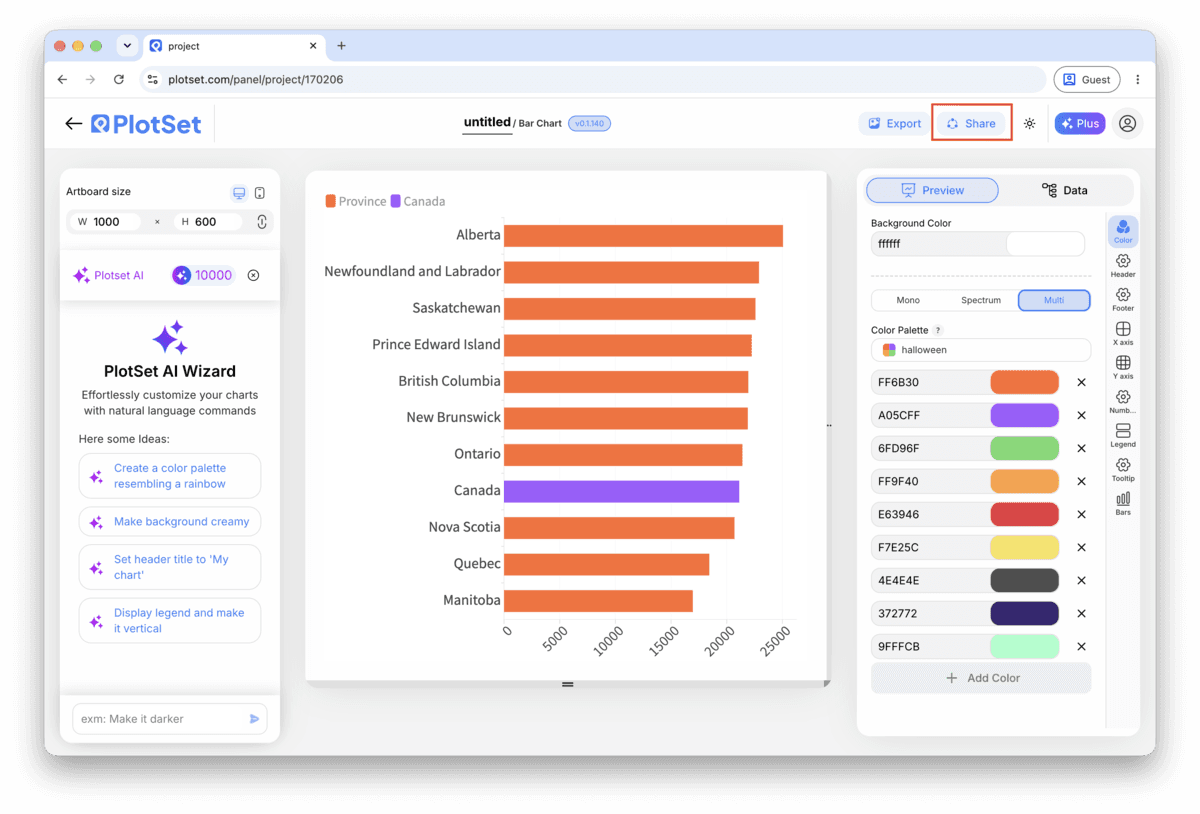
Vorlage öffnenDer letzte Abschnitt ist bei jedem Diagrammtyp gleich: "Share" macht aus dem Diagramm einen öffentlichen Live-Link und einen Einbettungscode, "Export" schreibt es als statische Datei heraus.
Aktivieren Sie den Einbettungscode und den öffentlichen Link, um das Diagramm zu veröffentlichen. Den Link können Sie bedenkenlos an alle weitergeben, und der Einbettungscode fügt sich als iframe in jede Seite ein. Die Tooltips beim Überfahren mit der Maus und die volle Interaktivität bleiben erhalten. Wenn Sie das Diagramm später bearbeiten, überträgt "Recreate" die Änderungen auf Link und Einbettung.

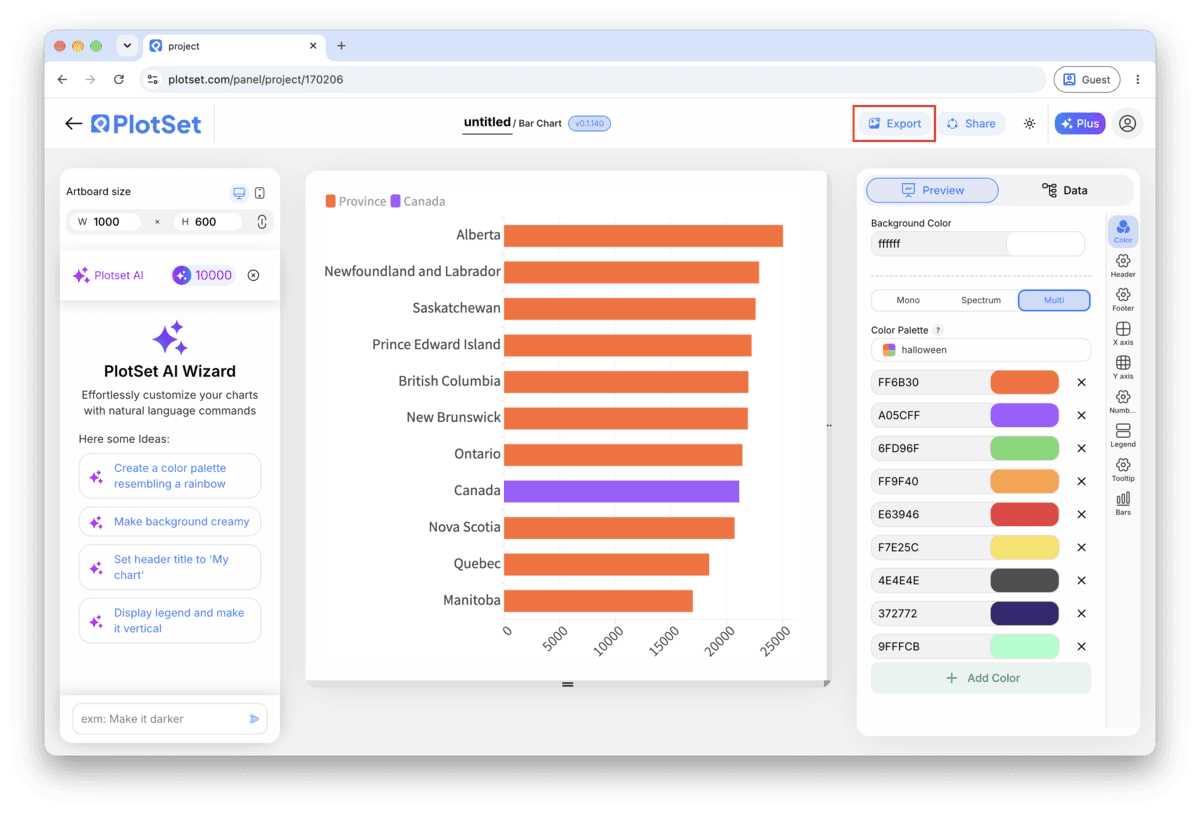
"Export" schreibt eine statische Kopie in der Größe heraus, die Sie brauchen. SVG bleibt in jeder Skalierung scharf und lässt sich weiterhin in einem Design-Tool bearbeiten; PNG und JPG sind die sichere Wahl für Folien und Dokumente. Der Skalierungsfaktor sorgt dafür, dass das Bild auf einem Retina-Display gestochen scharf wirkt.

If your categories are anything longer than a short code, department names, product names, survey questions, keep the chart horizontal. Long labels get a full line each with no rotating or truncating, which is the main reason to reach for a bar chart over a column chart in the first place.
Bar length is the encoding, so a truncated axis exaggerates every gap on the chart. If you are tempted to zoom in on a narrow range of similar values, add value labels instead and leave the axis at zero.
Past roughly twenty five categories, a bar chart turns into a wall of thin lines nobody can compare. Filter to your top group (top 10, top N by region, whatever the story actually needs) and mention in the title or a caption that it is a subset.
If you do need a second colour, use it for exactly one thing: the category you are calling out, or a threshold like "above target" versus "below target." Two colours used for one clear reason read better than four colours used for none.
This means the sort setting is still on the default (usually by category, not by value). Open the sort control in the chart settings and switch it to sort by the value column, descending.
Check the raw data for a totals or subtotals row that got uploaded along with the real categories. Delete that row from the source sheet and re-upload, or remove it directly in PlotSet's data table.
This usually means two rows in the source spreadsheet had category names that differ only by trailing spaces, capitalization or a stray character. Clean the category column in your spreadsheet (a TRIM formula catches most of it) before re-uploading.
Nicht sicher, ob Bar Chart die richtige Wahl ist? Erfahren Sie, was es ist, wann Sie es verwenden sollten und wann nicht.
Two columns and one header row: category names in the first column, one number per category in the second. CSV and .xlsx both work, and a pasted range from any spreadsheet tool is fine too.
Kostenlos starten mit über 300 Vorlagen. Keine Kreditkarte erforderlich.