
Beispiel-CSV
| Region | Hardware | Software | Services |
|---|---|---|---|
| North America | 420 | 610 | 190 |
| Europe | 310 | 480 | 150 |
| Asia Pacific | 260 | 390 | 110 |
| Latin America | 90 | 140 | 50 |
A step by step walkthrough for turning a spreadsheet into a published stacked bar chart in PlotSet, from shaping the sheet in wide format to ordering the stack and exporting the result.
Etwa 8 MinutenThis guide covers how to create a stacked bar chart from your own spreadsheet, end to end: a published, interactive chart with the segments ordered on purpose and the totals reading correctly, not a copy of the sample data the template ships with. You will shape a sheet into wide format, upload it, map the columns, and decide the one thing that actually changes how the chart reads: which segment sits on the baseline.
Eight minutes is the going rate once your spreadsheet is already one row per category with a column for each segment. Starting from a long format export, one row per category-segment pair, tacks on another five for the pivot PlotSet needs before it reads as a stack. Either way, the click path below is the one a real chart goes through, upload to publish.
Wide format, one row per category: the category name in the first column, then one numeric column for each segment. One header row, headers become the legend labels.
| Region | Hardware | Software | Services |
|---|---|---|---|
| North America | 420 | 610 | 190 |
| Europe | 310 | 480 | 150 |
| Asia Pacific | 260 | 390 | 110 |
| Latin America | 90 | 140 | 50 |
This has to be wide, not long. If your source data has one row per region per product line with a separate "value" column, pivot it in your spreadsheet first so each product line gets its own column.
Column order sets the default stack order, left to right becomes bottom to top (or reverse it in the chart, depending on your layout). Put the segment you want on the shared baseline in the leftmost data column.
Header names become the legend text exactly as typed. Rename "Q1_Rev_Actual" to something a reader recognizes before you upload, since renaming later just means redoing the column mapping.
A blank cell is read as zero, not skipped. If a region genuinely sold no services that quarter, a zero is correct; if the number is just missing, fill it in before the bar's total quietly comes out short.
Der genaue Klickpfad in PlotSet, von einer leeren Vorlage bis zum fertigen Diagramm.
From the PlotSet dashboard, start a new project and choose the Stacked Bar Chart template. It loads with sample data already in place, in the wide format PlotSet expects, so you can see the column layout before you touch your own file.

One row per category, one column per segment: category in the first column, a number for each segment after it. If your export is long format, one row per category-segment pair, pivot it in your spreadsheet tool first. Uploading long format straight into a stacked chart usually produces one segment per bar instead of a real stack.
Use the data panel to import a CSV or .xlsx file, paste rows directly from a spreadsheet, or connect a Google Sheet if you want the chart to refresh when the source changes. PlotSet reads the first row as headers and each of those becomes a segment name.

Confirm which column feeds the category axis and which numeric columns feed the stack. This is usually automatic when your headers are clean, but check it if your sheet carries an extra column, such as a total, that shouldn't be treated as its own segment.

Drag the segment you want on the shared baseline to the bottom of the stack order and keep that order identical across every bar. This is the one decision in a stacked chart that actually changes what a reader can compare, so make it deliberately rather than leaving the upload order in place.
If the story is partly about the overall size of each bar, switch on a total label at the end of it. Reading a stacked total off the axis by eye is imprecise once you have more than two segments, so a printed number saves the guesswork.
With four segments or fewer, labelling each band directly usually reads faster than a separate legend, since there's no lookup between colour and name. Give each segment its own consistent colour and keep that colour tied to the same segment across every bar, not reassigned per chart.
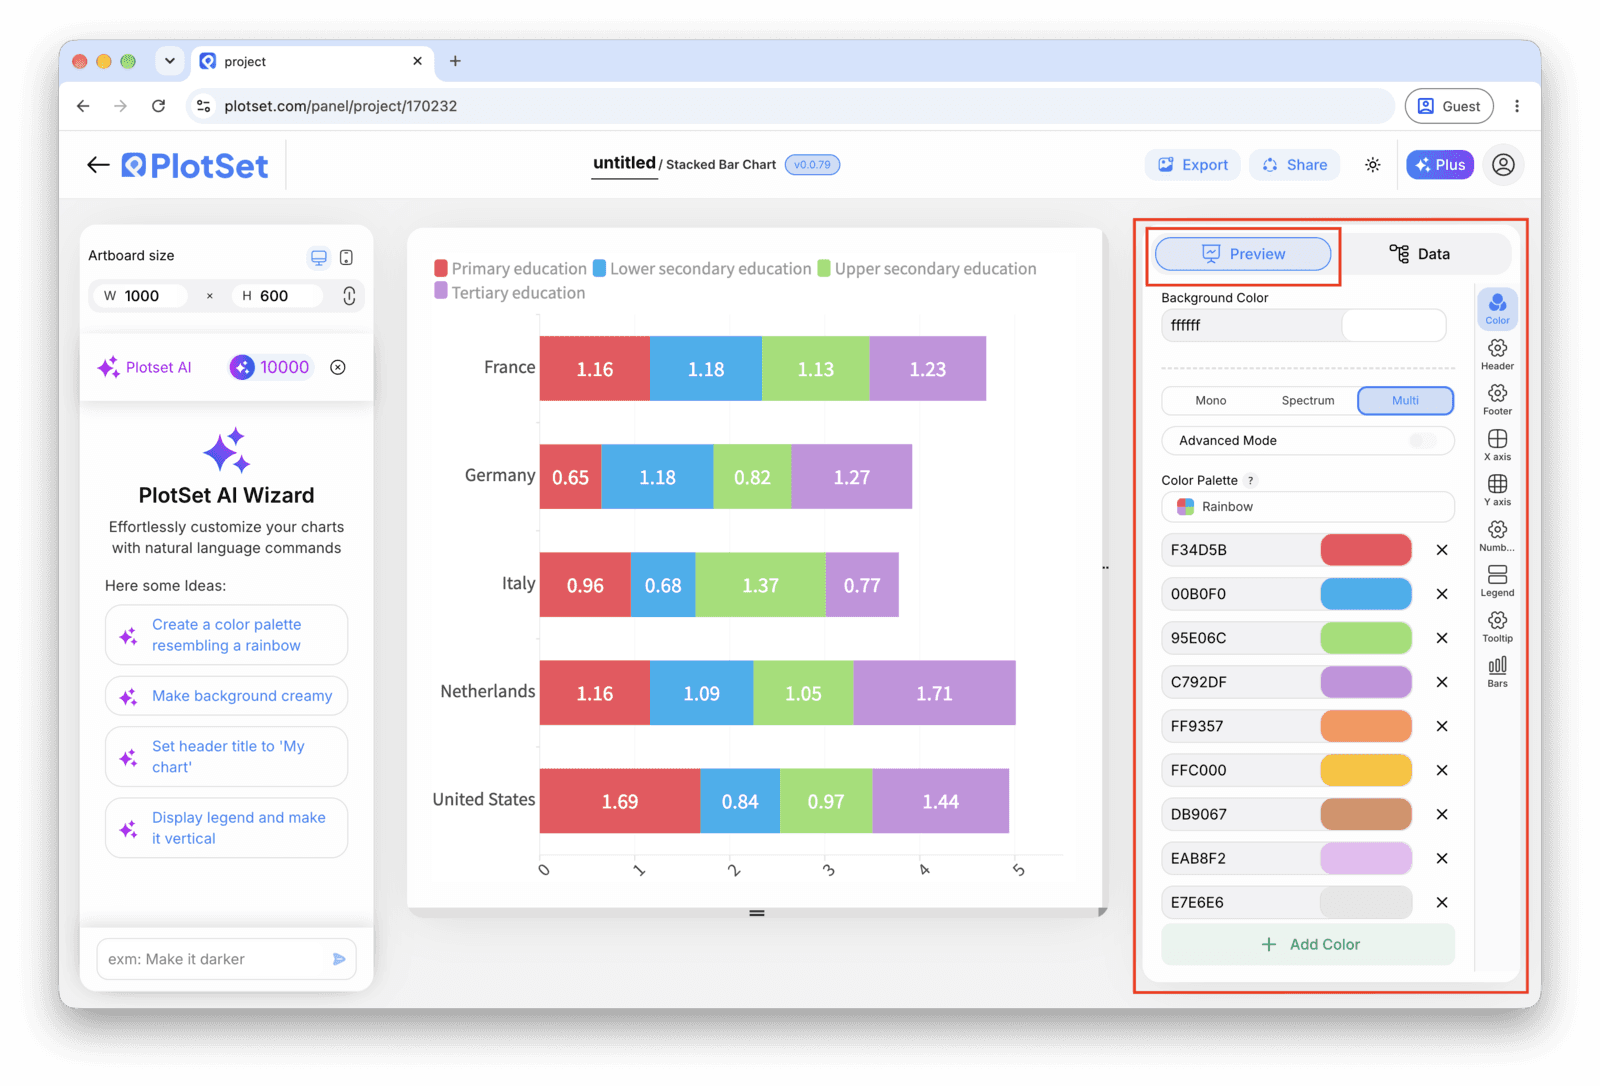
Publish for a live, interactive chart with hover tooltips that break out each segment's value, grab the embed code for a page, or export a PNG, SVG or PDF for a deck or report.
Starten Sie mit der Stacked Bar Chart-Vorlage samt bereits geladenen Beispieldaten und ersetzen Sie diese durch Ihre eigenen.
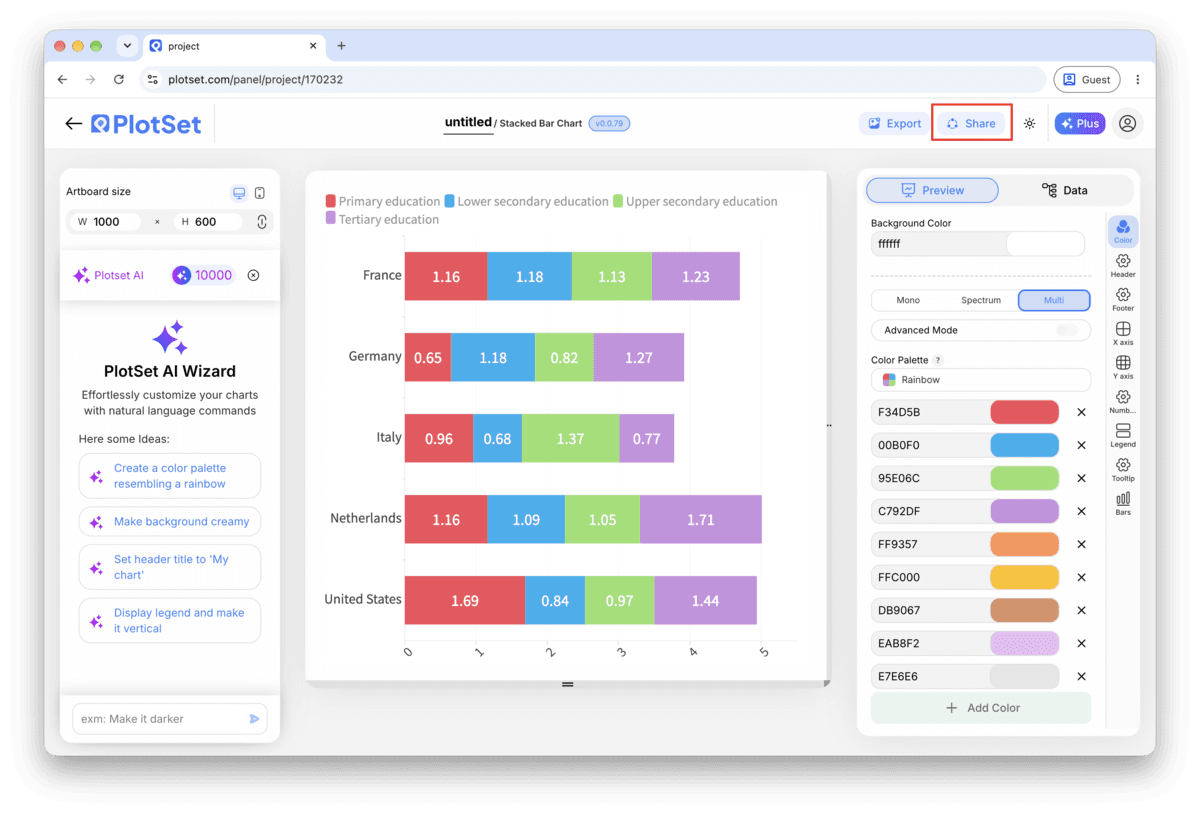
Vorlage öffnenDer letzte Abschnitt ist bei jedem Diagrammtyp gleich: "Share" macht aus dem Diagramm einen öffentlichen Live-Link und einen Einbettungscode, "Export" schreibt es als statische Datei heraus.
Aktivieren Sie den Einbettungscode und den öffentlichen Link, um das Diagramm zu veröffentlichen. Den Link können Sie bedenkenlos an alle weitergeben, und der Einbettungscode fügt sich als iframe in jede Seite ein. Die Tooltips beim Überfahren mit der Maus und die volle Interaktivität bleiben erhalten. Wenn Sie das Diagramm später bearbeiten, überträgt "Recreate" die Änderungen auf Link und Einbettung.

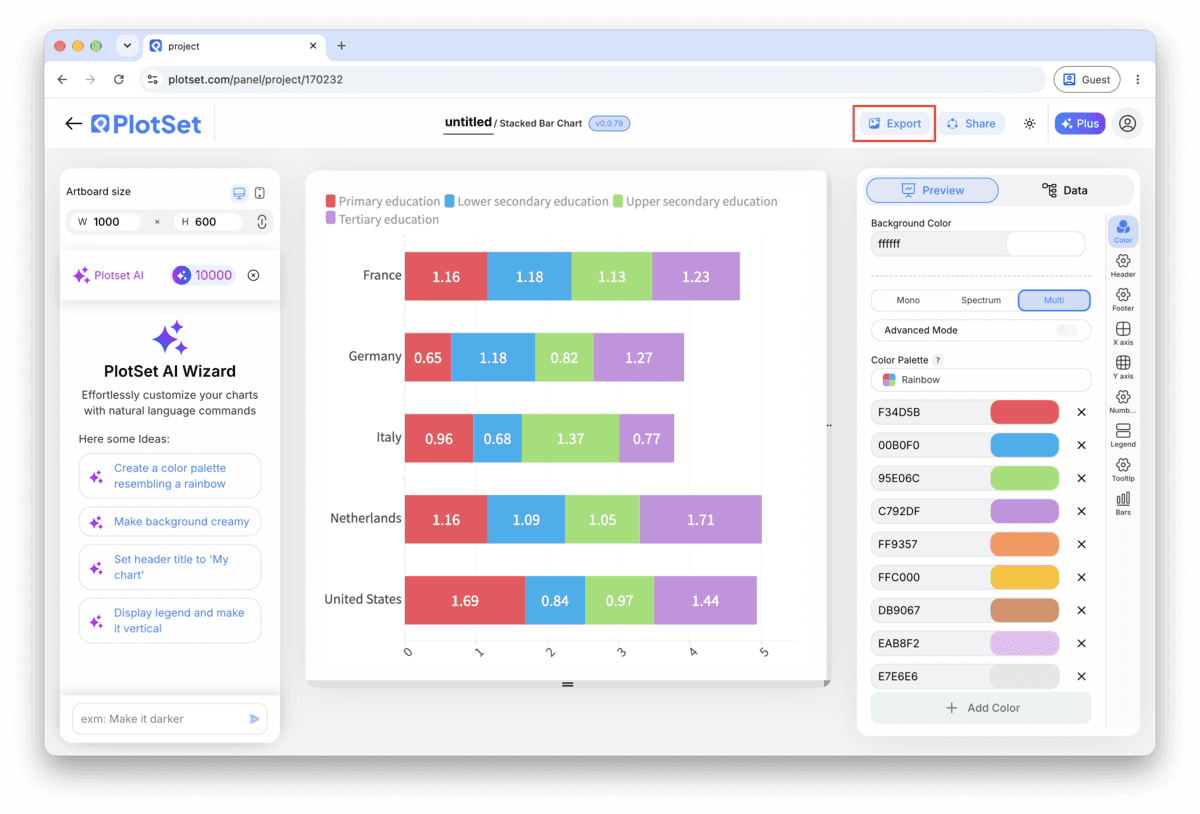
"Export" schreibt eine statische Kopie in der Größe heraus, die Sie brauchen. SVG bleibt in jeder Skalierung scharf und lässt sich weiterhin in einem Design-Tool bearbeiten; PNG und JPG sind die sichere Wahl für Folien und Dokumente. Der Skalierungsfaktor sorgt dafür, dass das Bild auf einem Retina-Display gestochen scharf wirkt.

Only the bottom band sits on a shared baseline across bars, so it's the only one that can be compared accurately at a glance. If one series is the point of the chart, for example this year's revenue against a backdrop of prior years, put it at the bottom, not buried in the middle of the stack.
If your bars have wildly different totals and the story is really about the mix, not the size, turn on the 100% stacked option. Every bar normalizes to the same length, which makes the proportions easy to compare and removes the size differences that were distracting from them.
A sequential colour scale (light to dark) implies an order that a stack of unrelated categories, like product lines or departments, doesn't have. Use distinct, consistent colours per segment instead, and save a sequential scale for when the segments are genuinely ordered, like age brackets.
Past five or six segments the thinner bands become hard to read and harder to tell apart by colour. Sum the smallest categories into one "Other" column in your source sheet before uploading, rather than letting PlotSet render eight thin slivers per bar.
This is almost always a long format upload: one row per category-segment pair rather than one row per category with a column per segment. Pivot the sheet so each segment gets its own column, then re-upload or reconnect the source.
PlotSet uses your header row as the segment labels exactly as written, so a header like "seg_2_val" ends up on the chart verbatim. Rename the columns in your source spreadsheet and re-upload, since editing the legend text alone won't survive the next refresh.
Check for a blank cell in one of the segment columns for that category. PlotSet reads a blank as zero rather than skipping it, so a missing value quietly shrinks the bar instead of raising an error. Fill in the actual number or confirm zero is correct.
Nicht sicher, ob Stacked Bar Chart die richtige Wahl ist? Erfahren Sie, was es ist, wann Sie es verwenden sollten und wann nicht.
Wide format: one row per category, and one numeric column per segment, with a single header row. That's different from a long format export with one row per category-segment pair, which needs to be pivoted into wide format before PlotSet reads it correctly as a stack.
Kostenlos starten mit über 300 Vorlagen. Keine Kreditkarte erforderlich.