
The Day America Started Wasting Eight More Quads
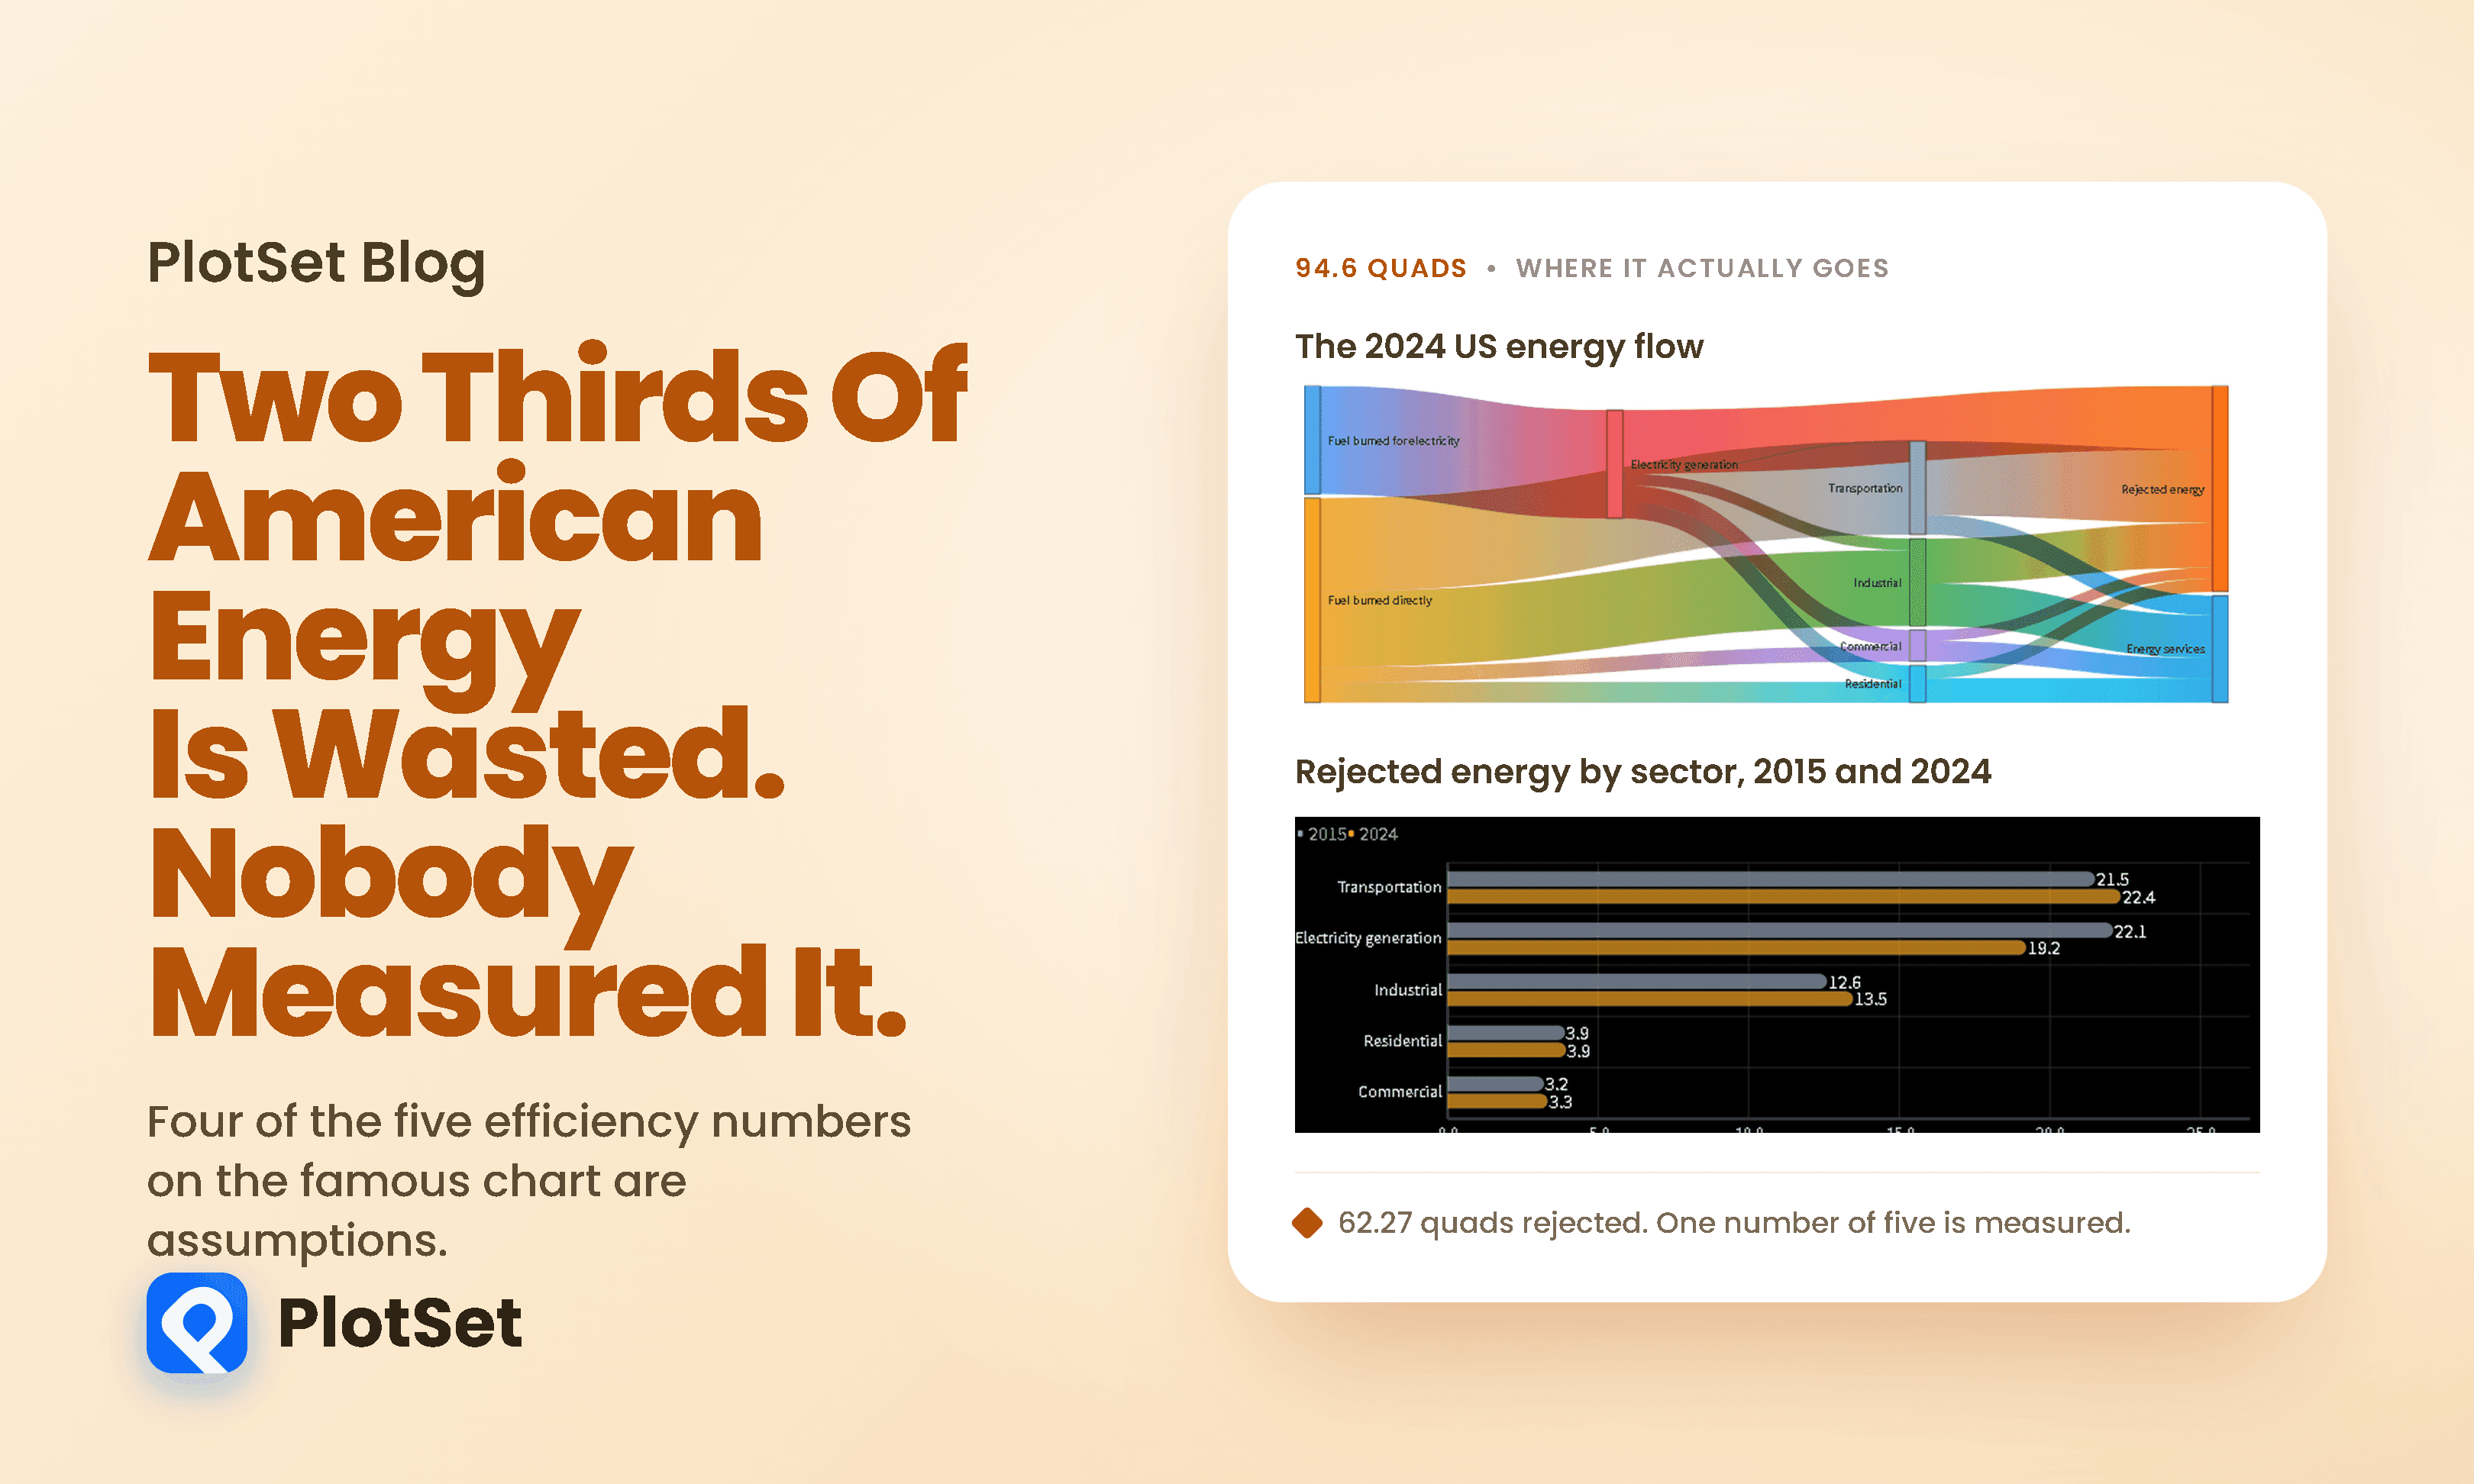
Every year Lawrence Livermore National Laboratory publishes one of the most widely reproduced charts in energy.
8 Min. Lesezeit
Every year Lawrence Livermore National Laboratory publishes one of the most widely reproduced charts in energy.
8 Min. Lesezeit
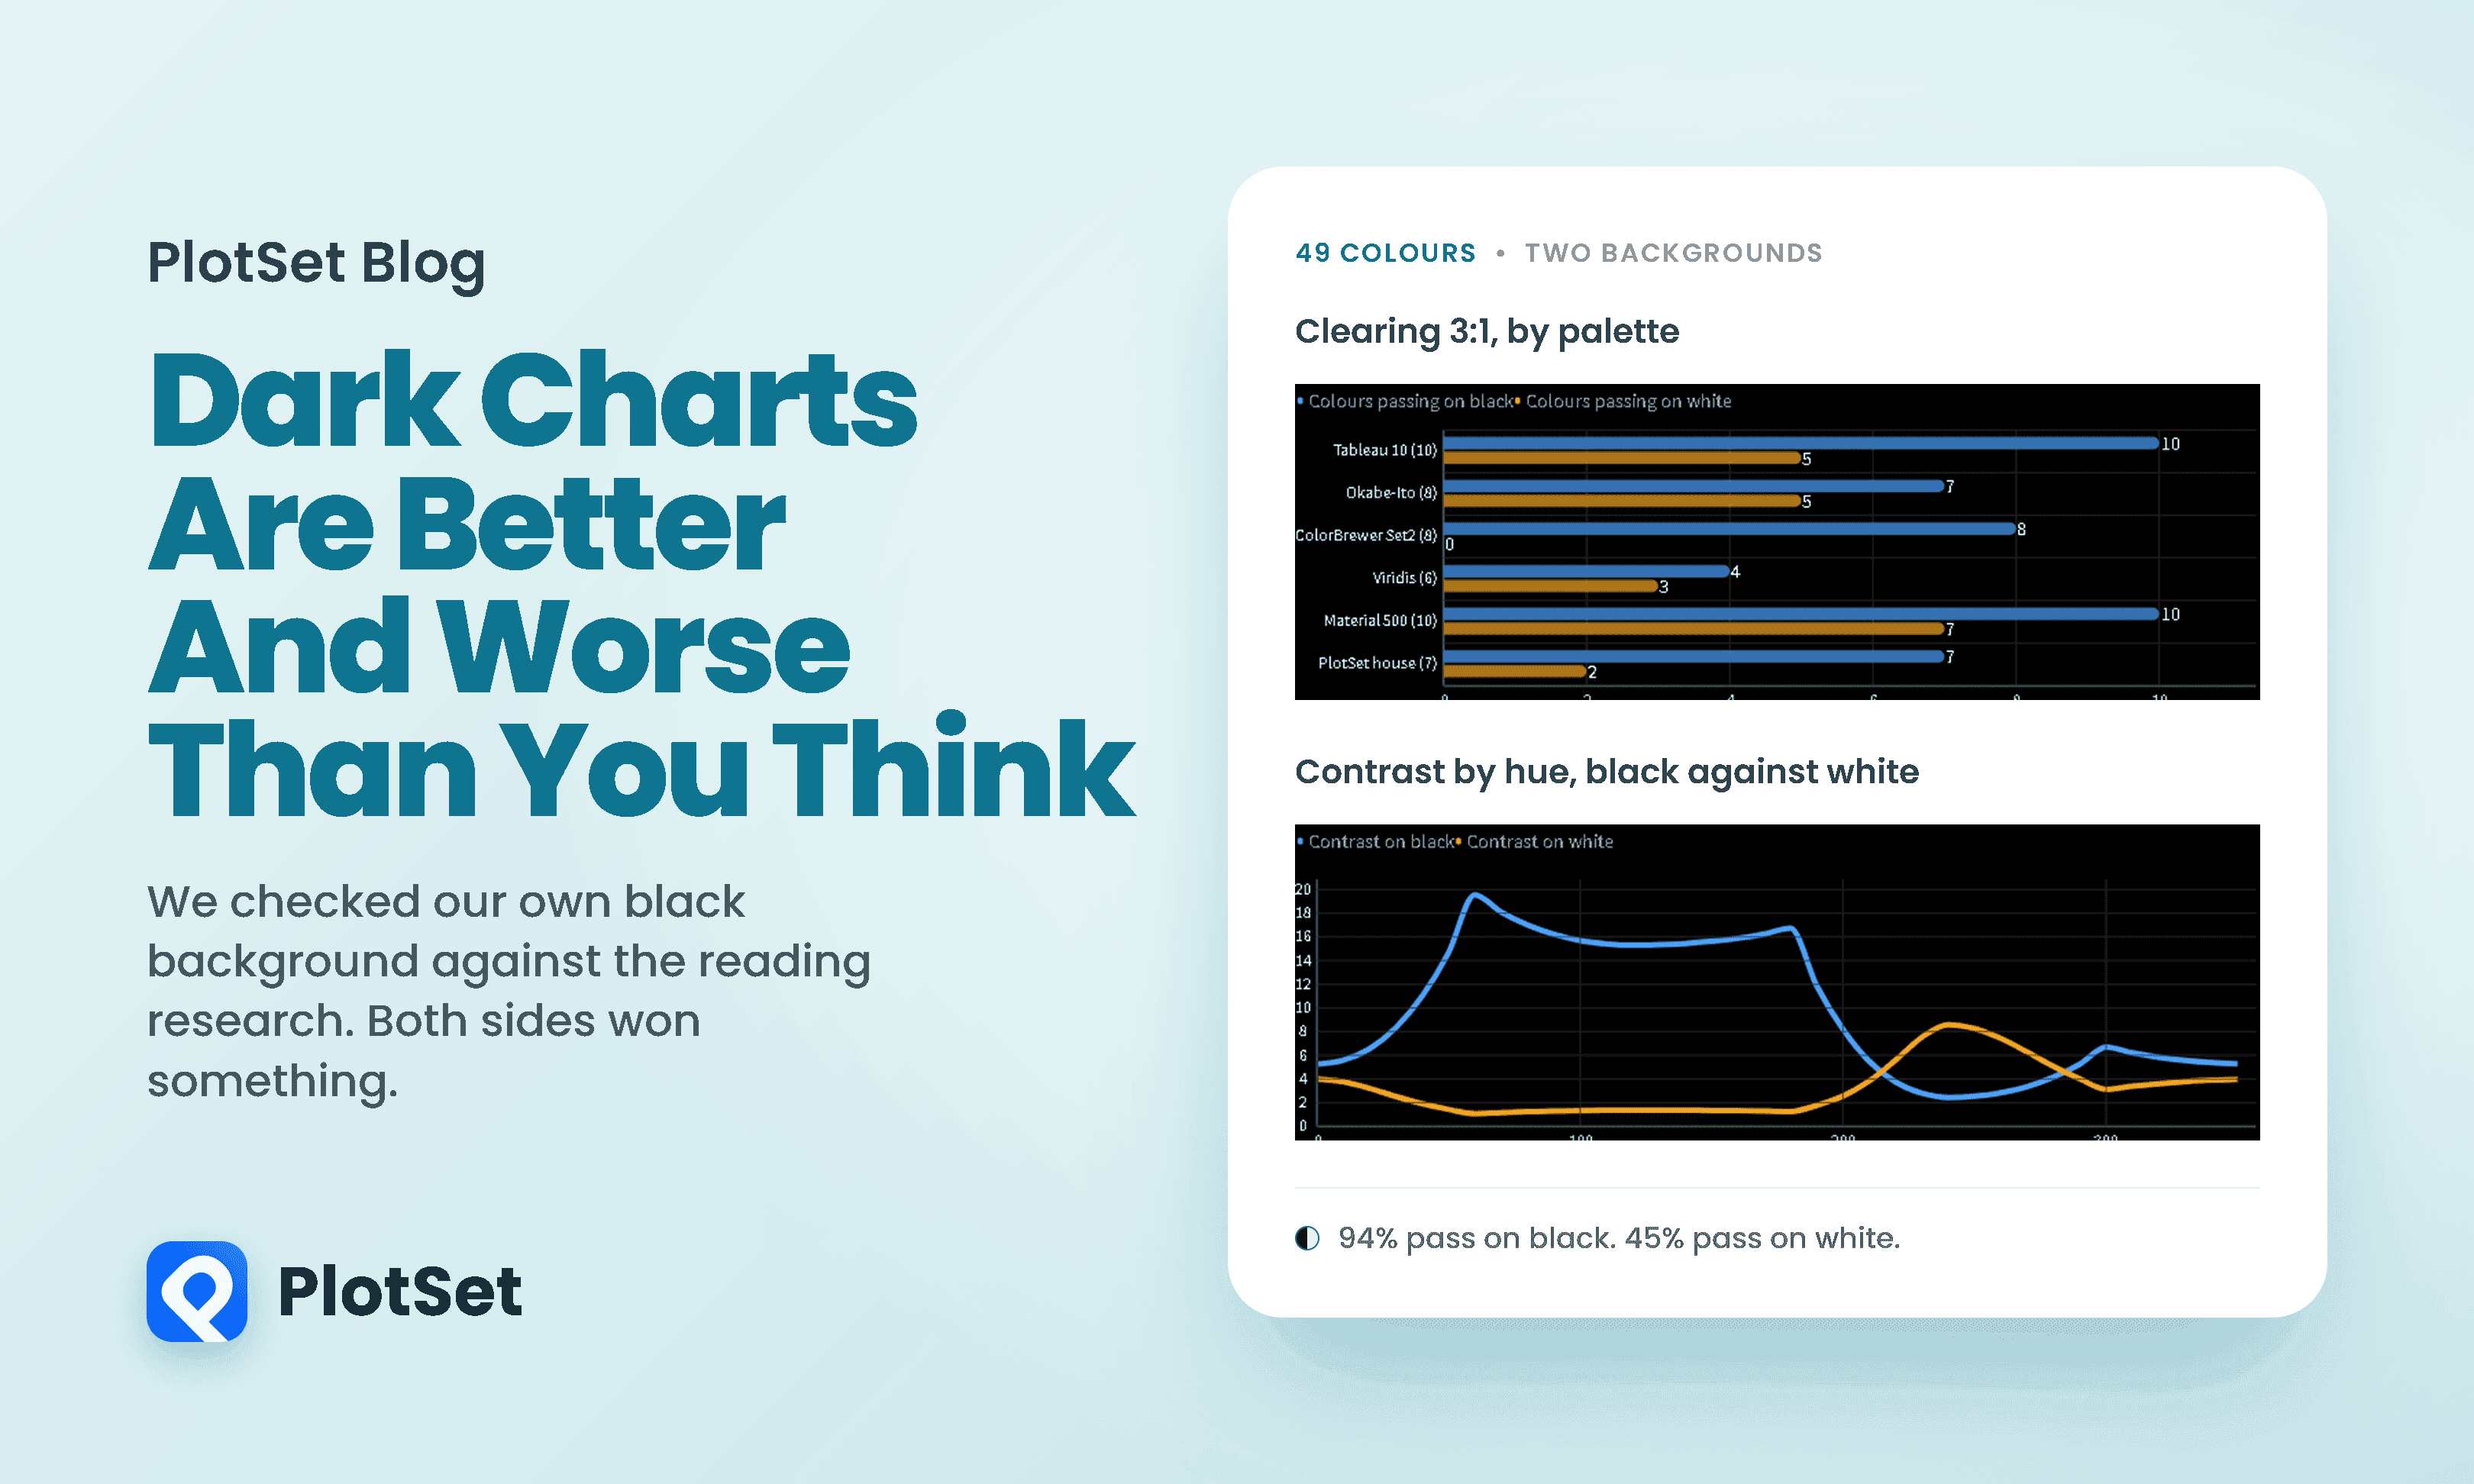
The reading research is not encouraging. Since the 1980s, studies have found that dark text on a light background beats the reverse for proofreading and for visual acuity.
8 Min. Lesezeit
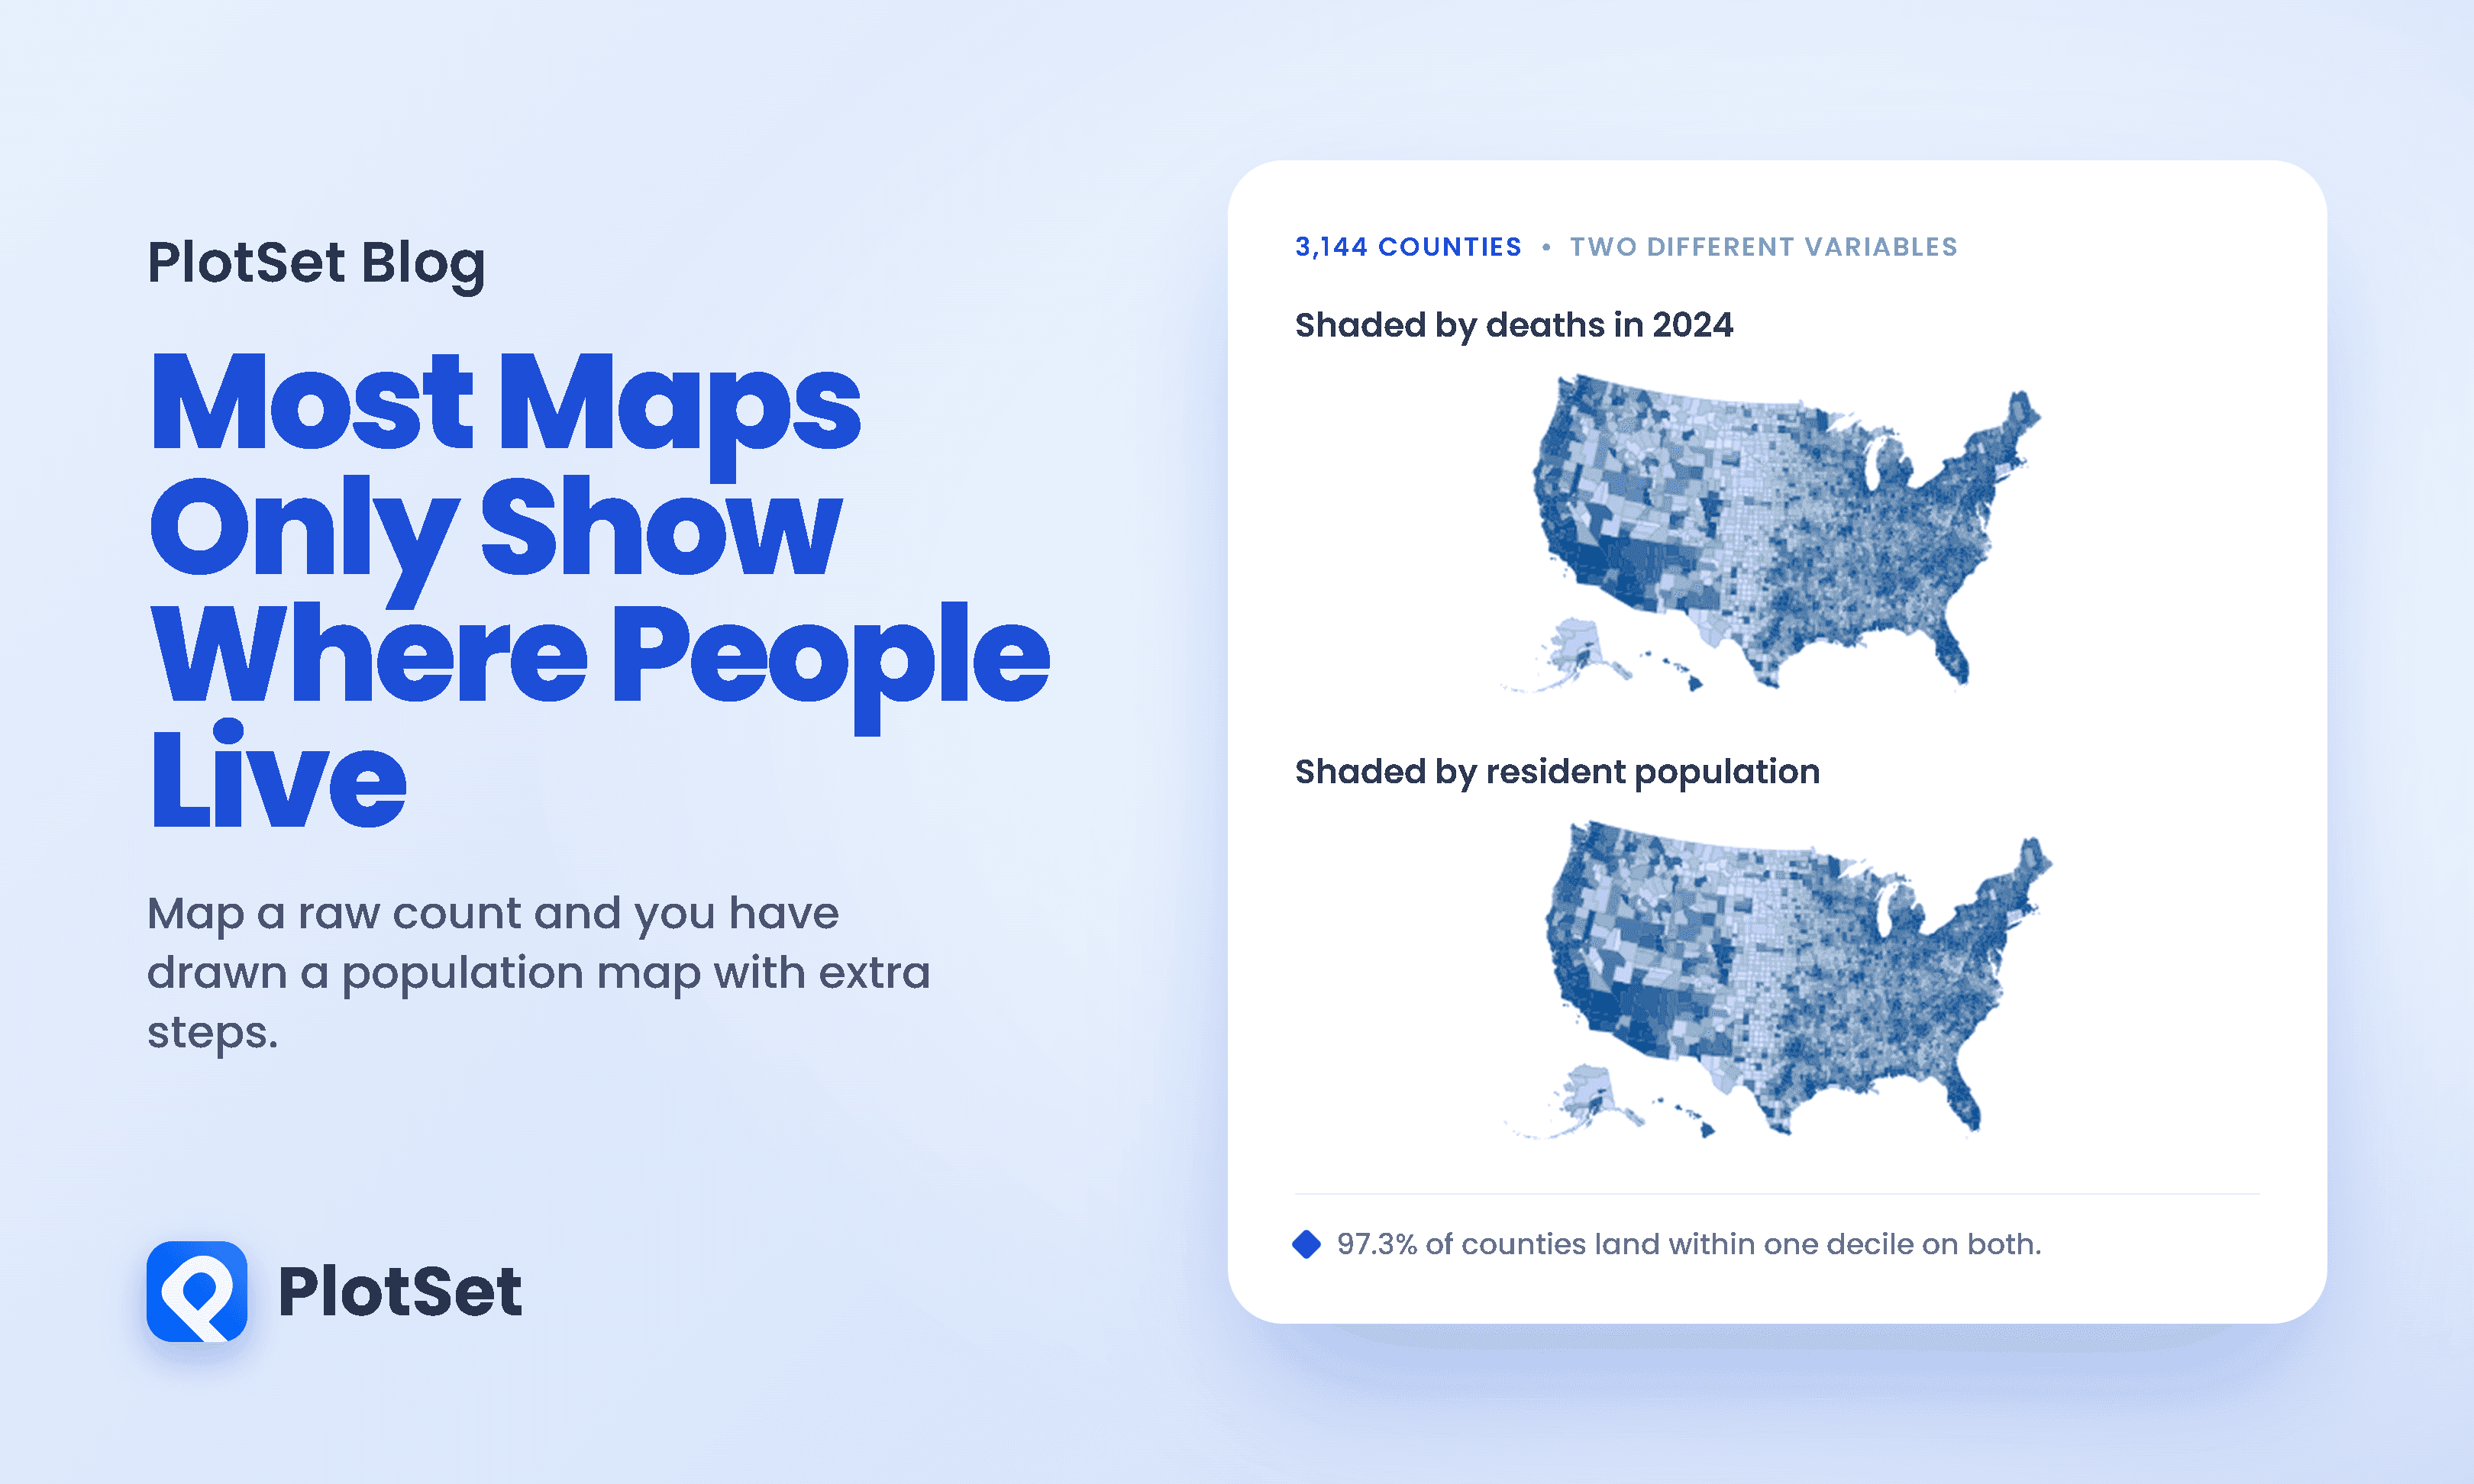
Here is a choropleth map of every death recorded in the United States in 2024, county by county. There were 3,086,925 of them across 3,144 counties, and each county is shaded by how many it recorded.
10 Min. Lesezeit
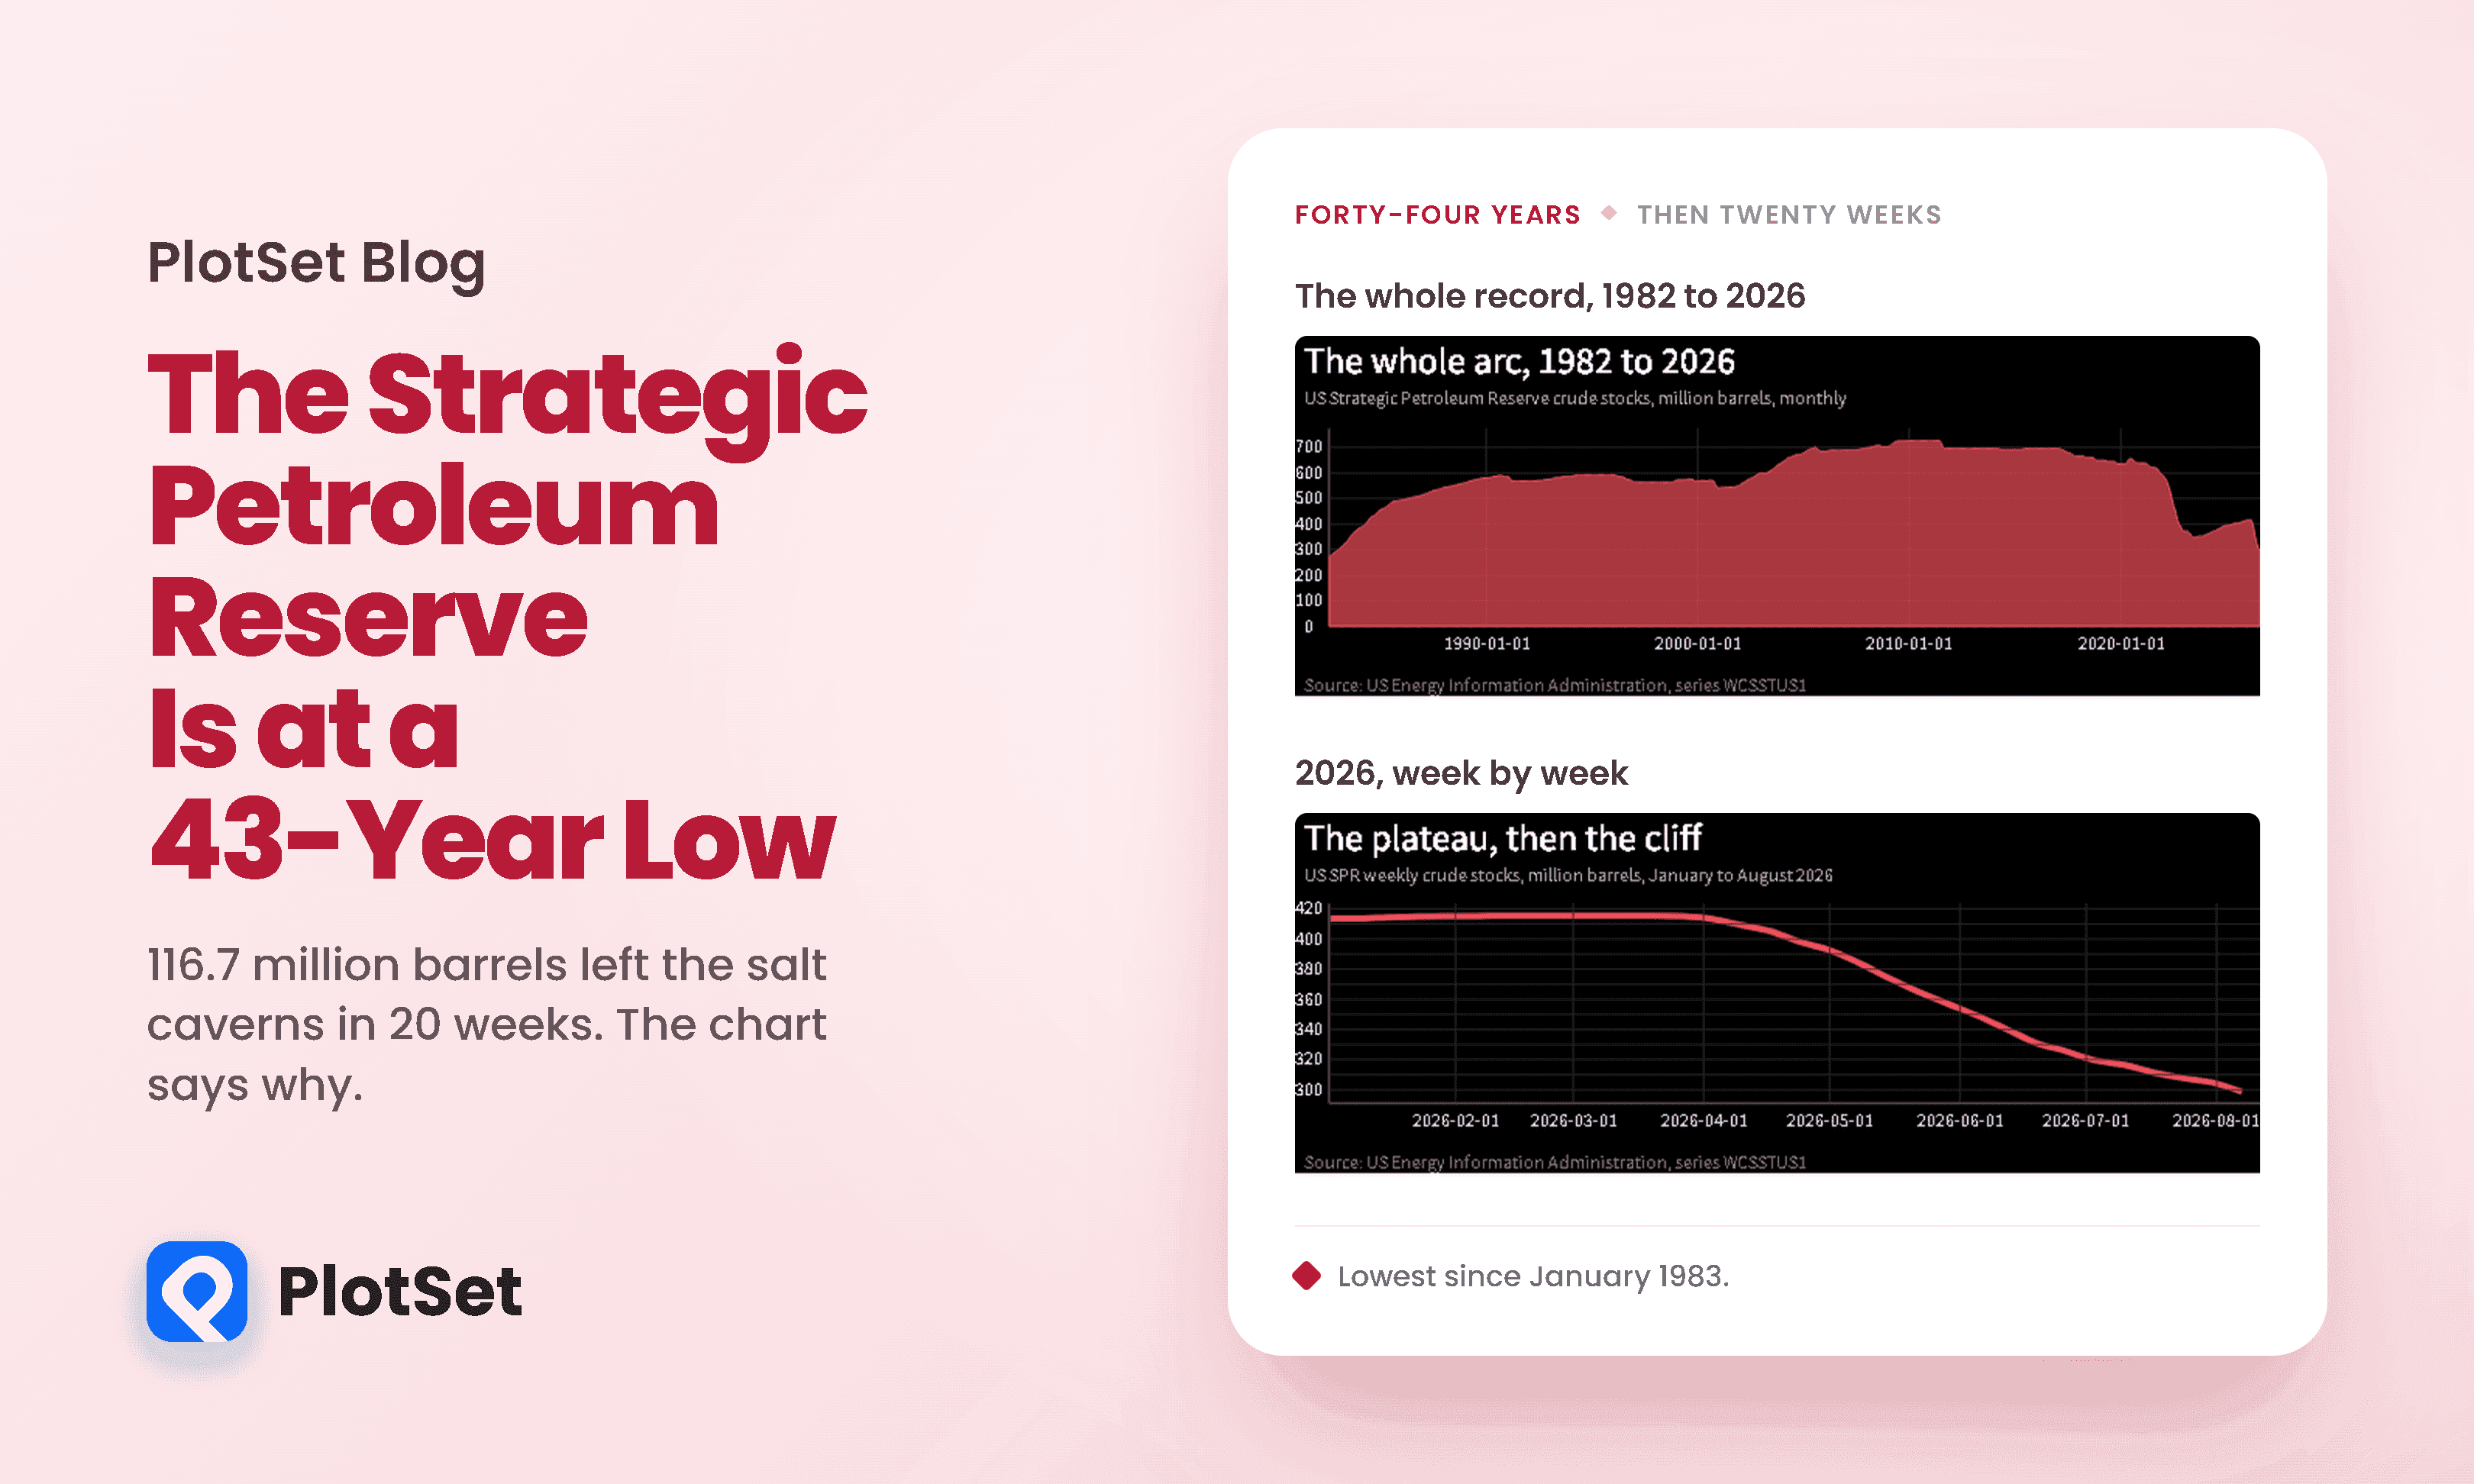
For six straight weeks in early 2026, the United States strategic petroleum reserve did not move.
12 Min. Lesezeit
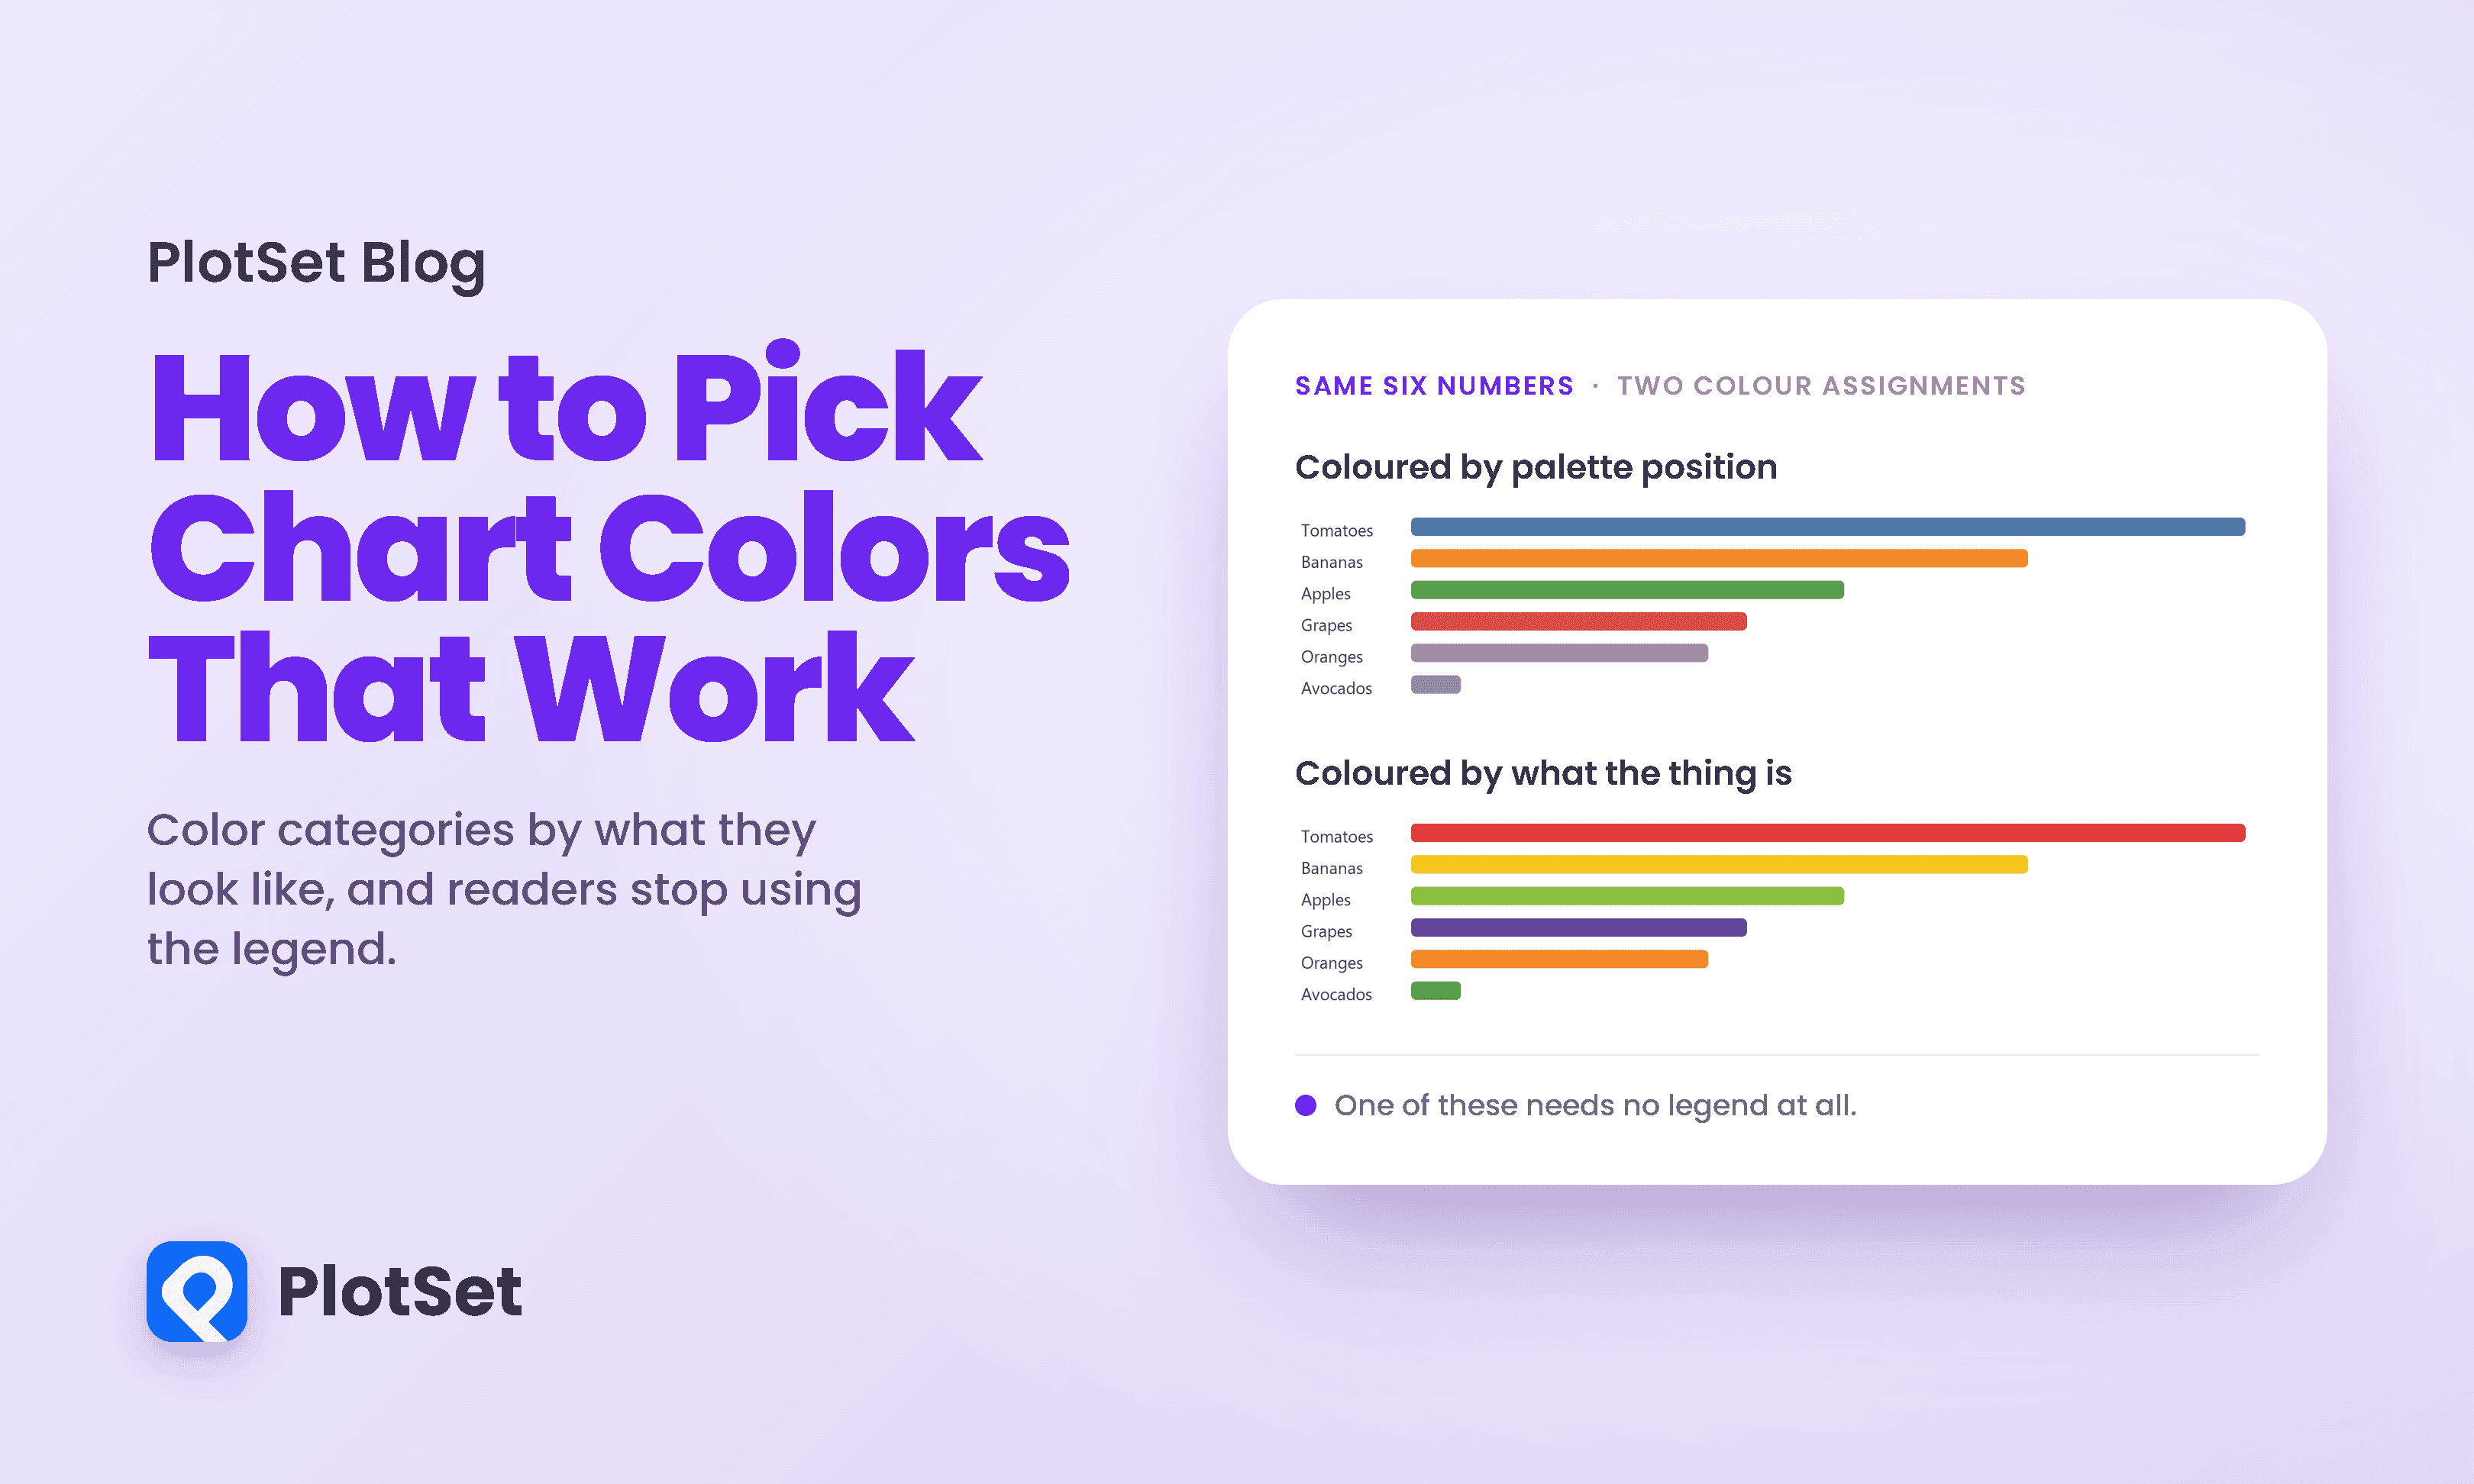
Every charting tool assigns colours the same way: by position. The first category gets the first colour in the palette, the second gets the second, and so on down the list.
8 Min. Lesezeit
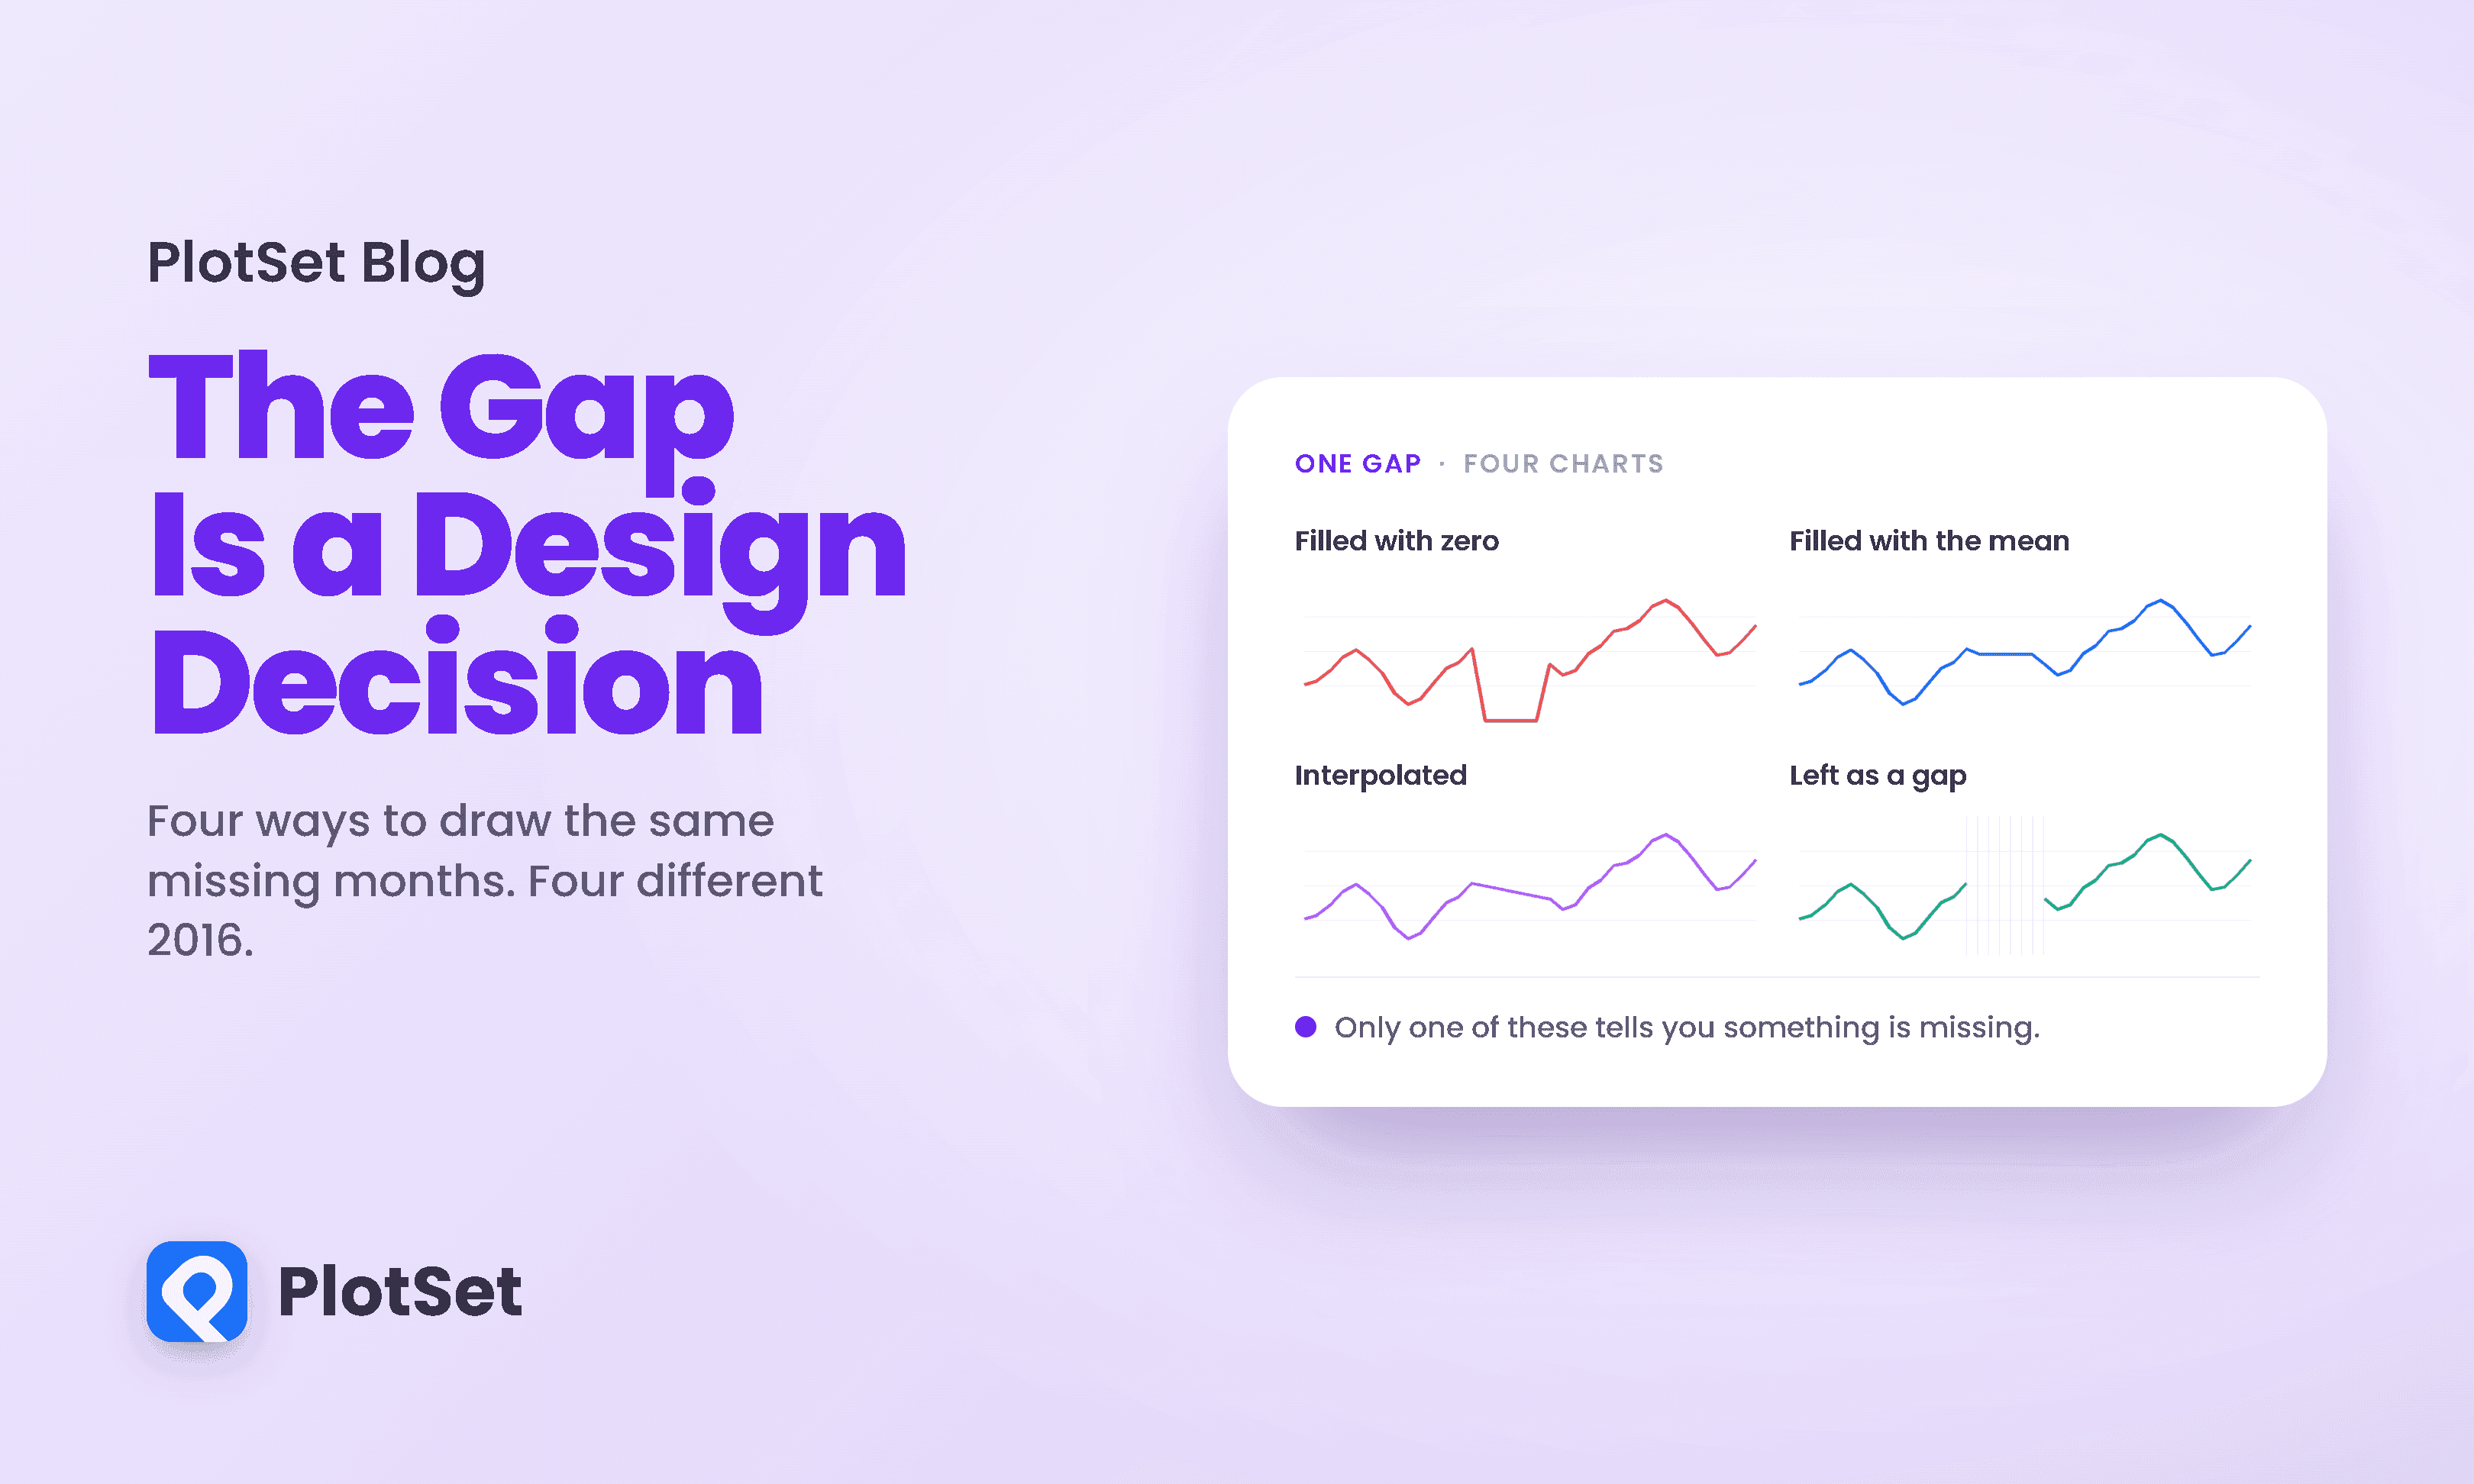
Open a spreadsheet, delete one cell in the middle of a column, and chart what is left. Something still gets drawn.
10 Min. Lesezeit
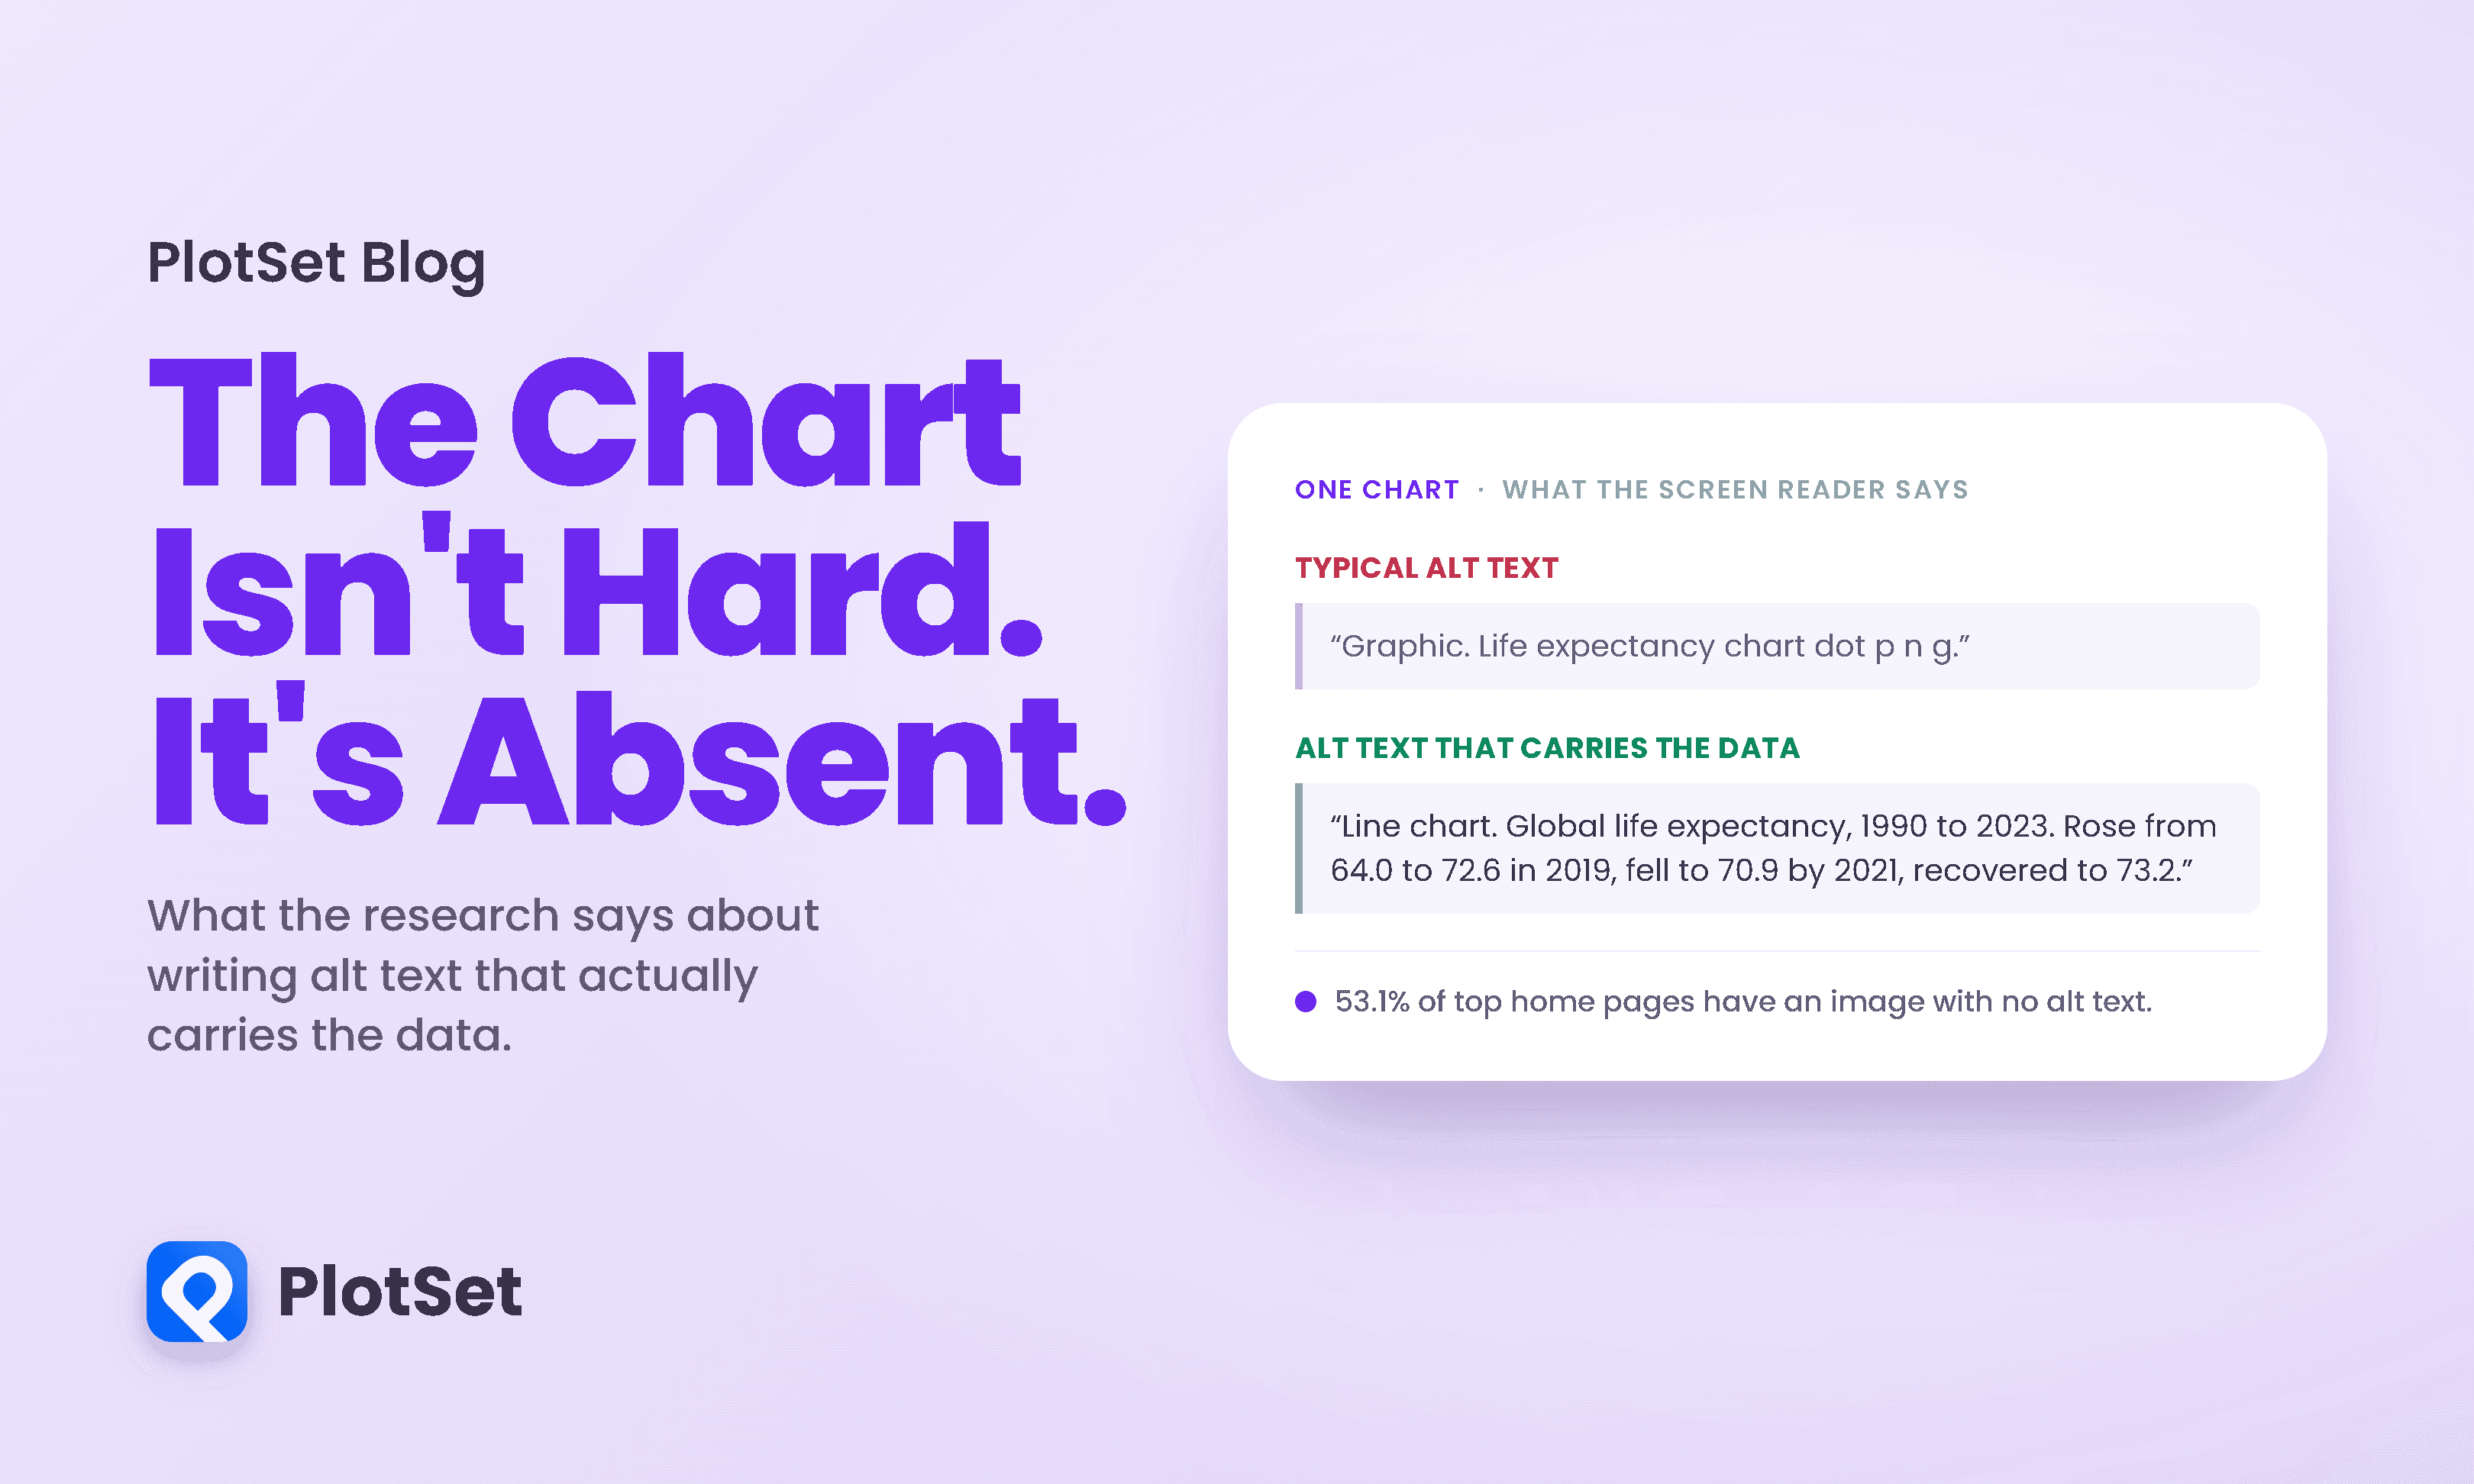
Most advice about charts assumes a reader who can see the chart. Contrast, layout, colour, labelling: all of it is about making a visible thing easier to interpret.
12 Min. Lesezeit
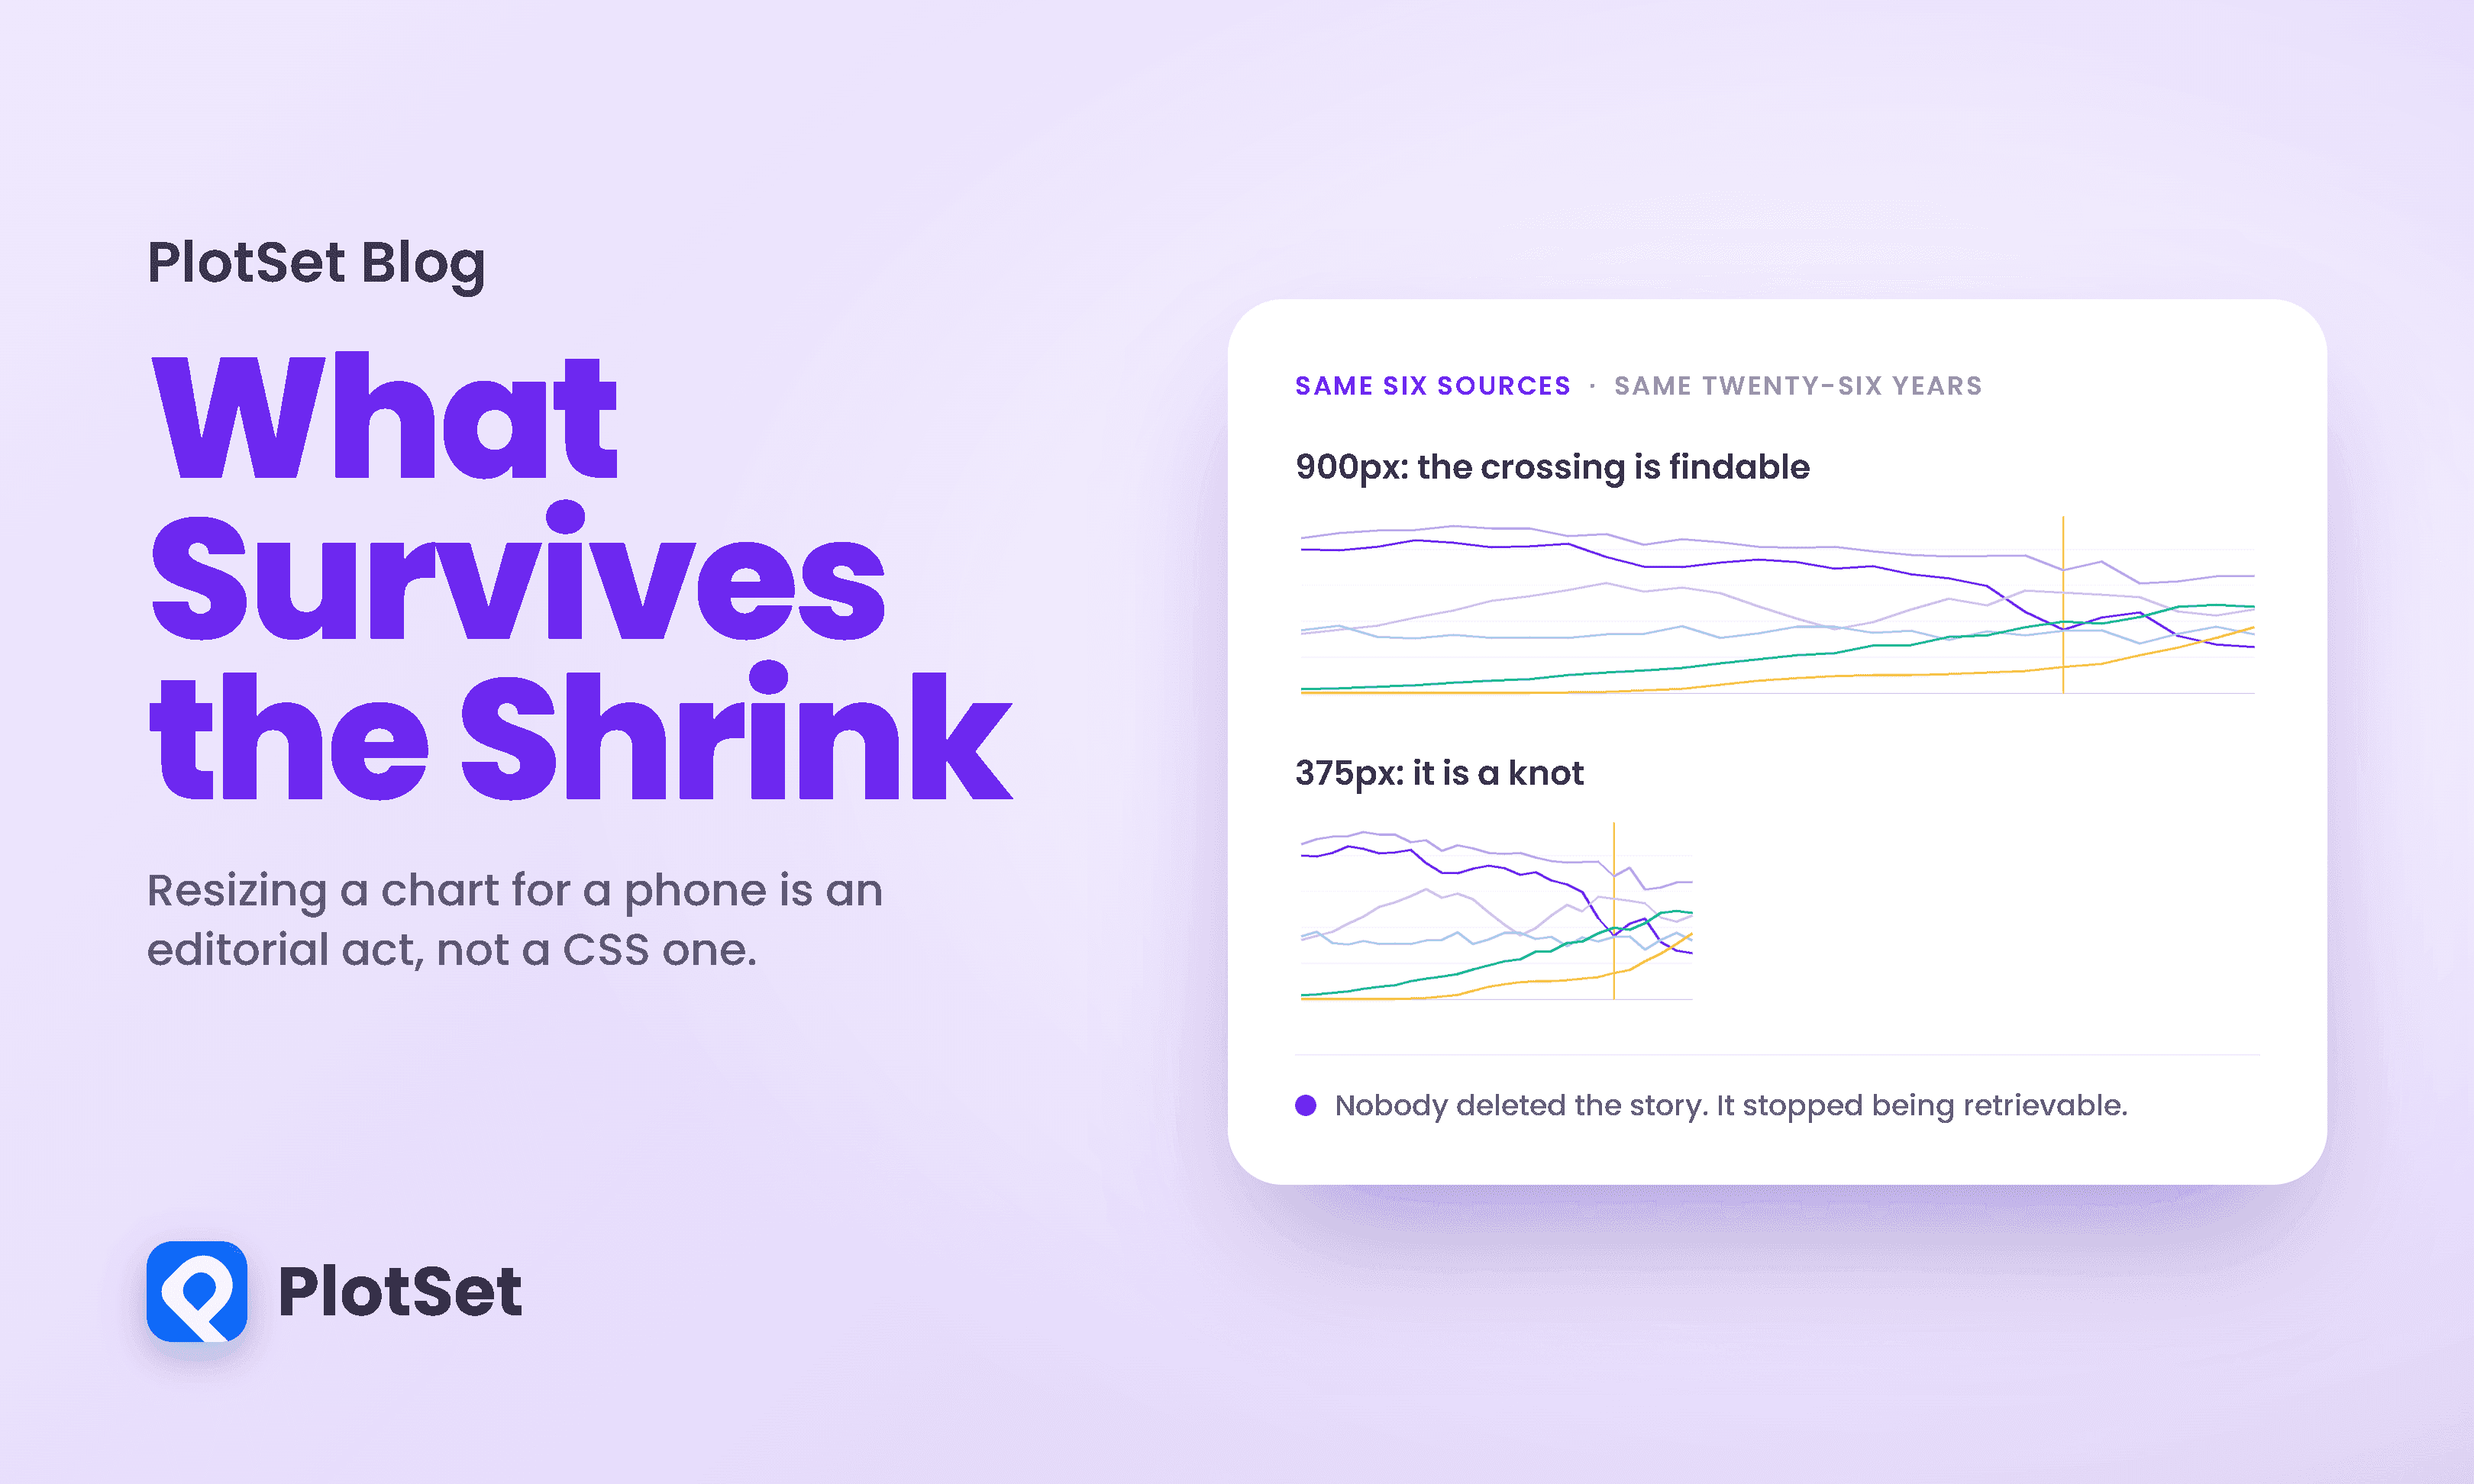
Responsive design arrived in data visualization as a layout problem. Squeeze the axes, rotate the labels, drop a legend, ship it.
9 Min. Lesezeit
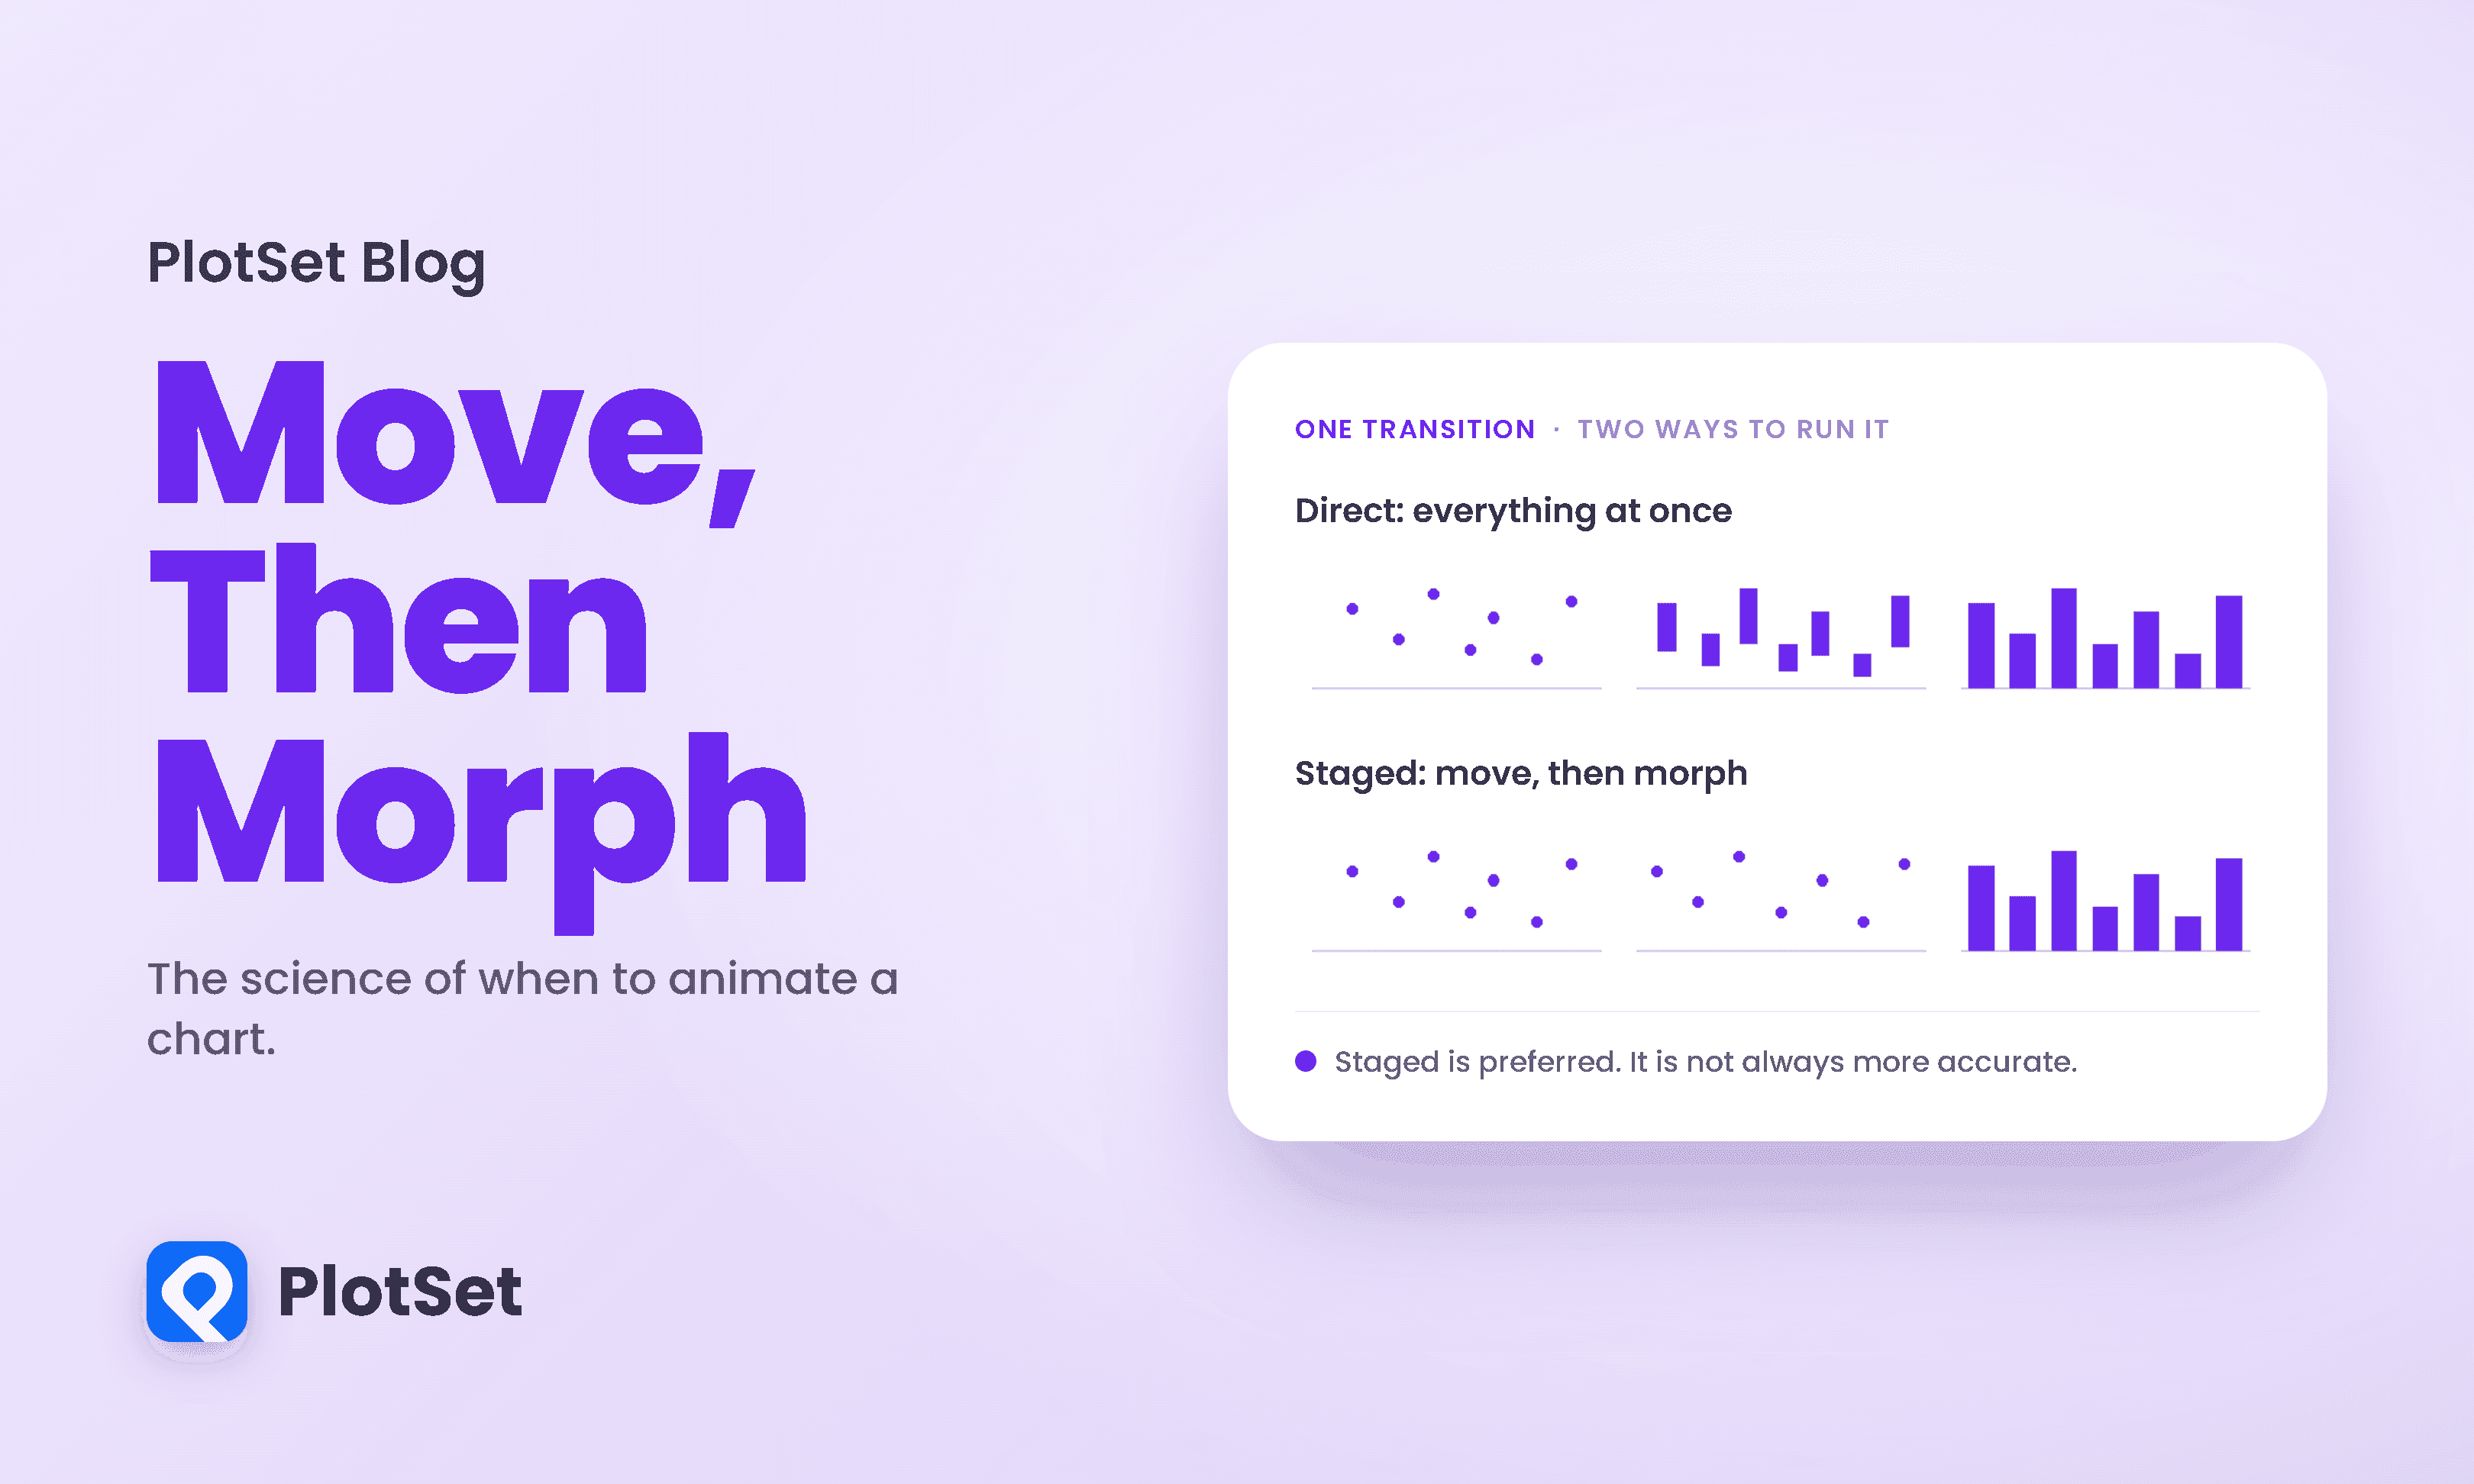
There are two confident positions on animated charts and both are wrong. One says animation is decoration, a gimmick for people who cannot make a point with a static image.
10 Min. Lesezeit
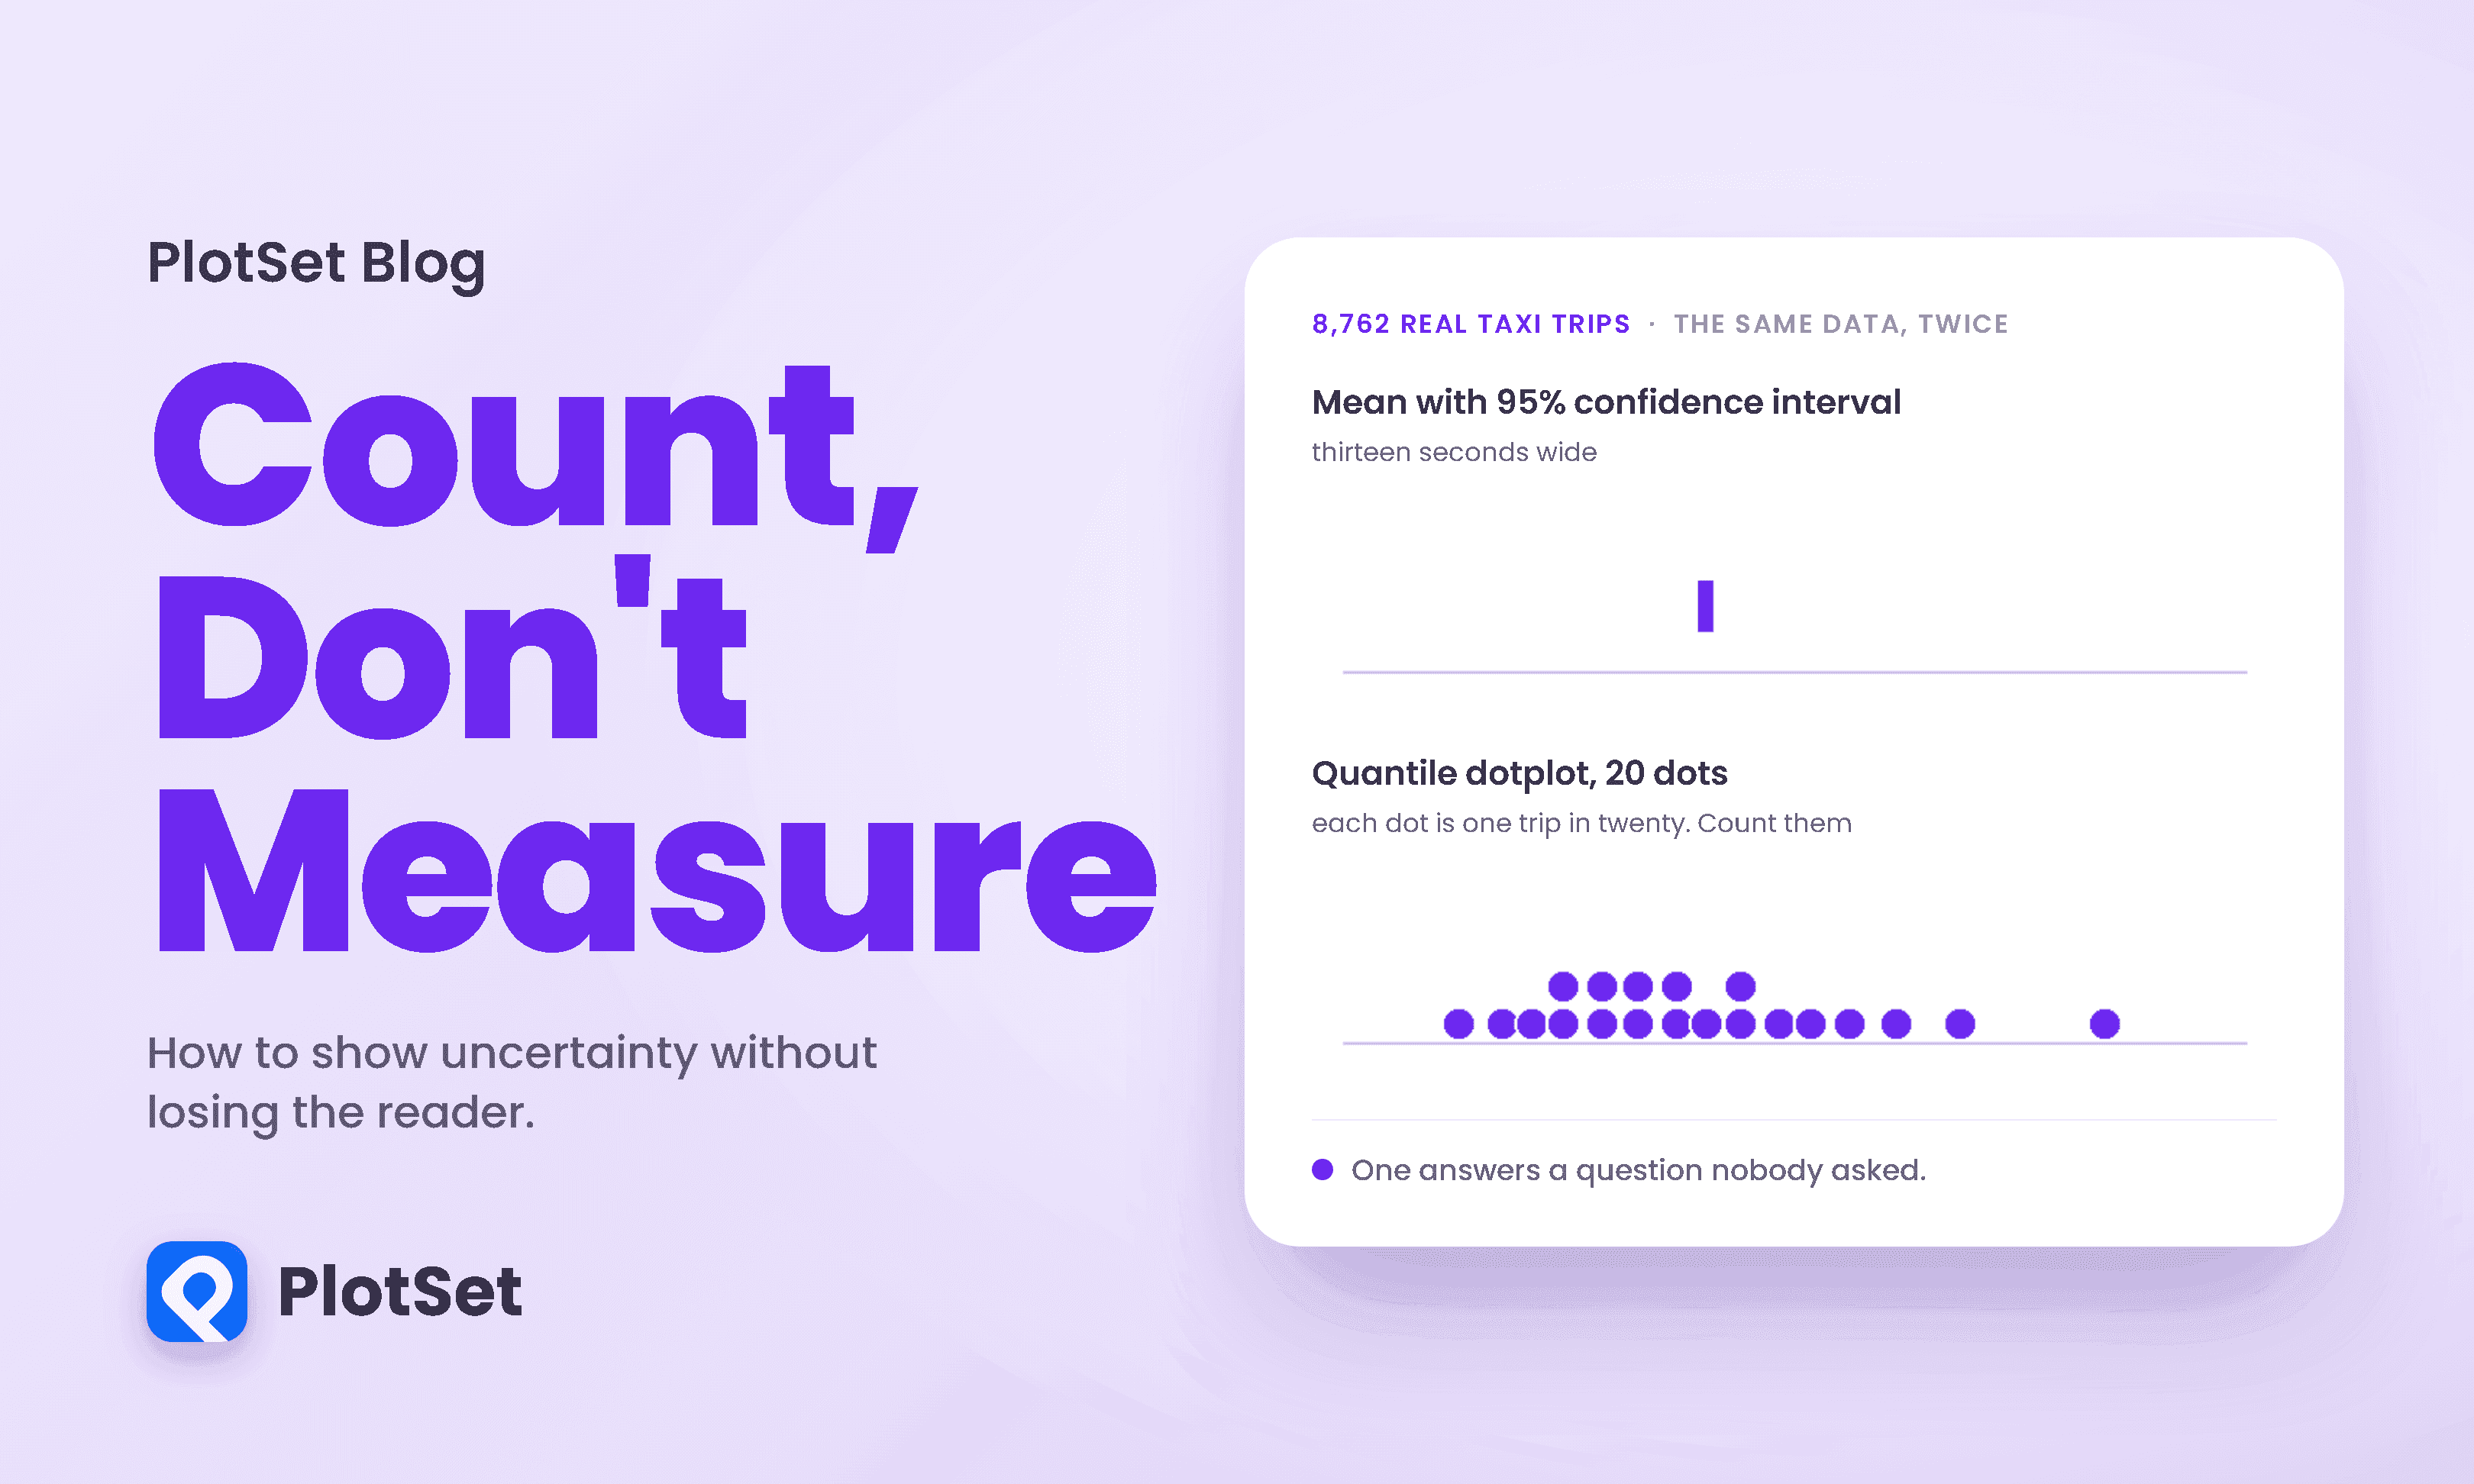
Here is a question with a number attached. You are in Midtown Manhattan and you need to be on the Upper East Side. How long does the taxi take?
10 Min. Lesezeit
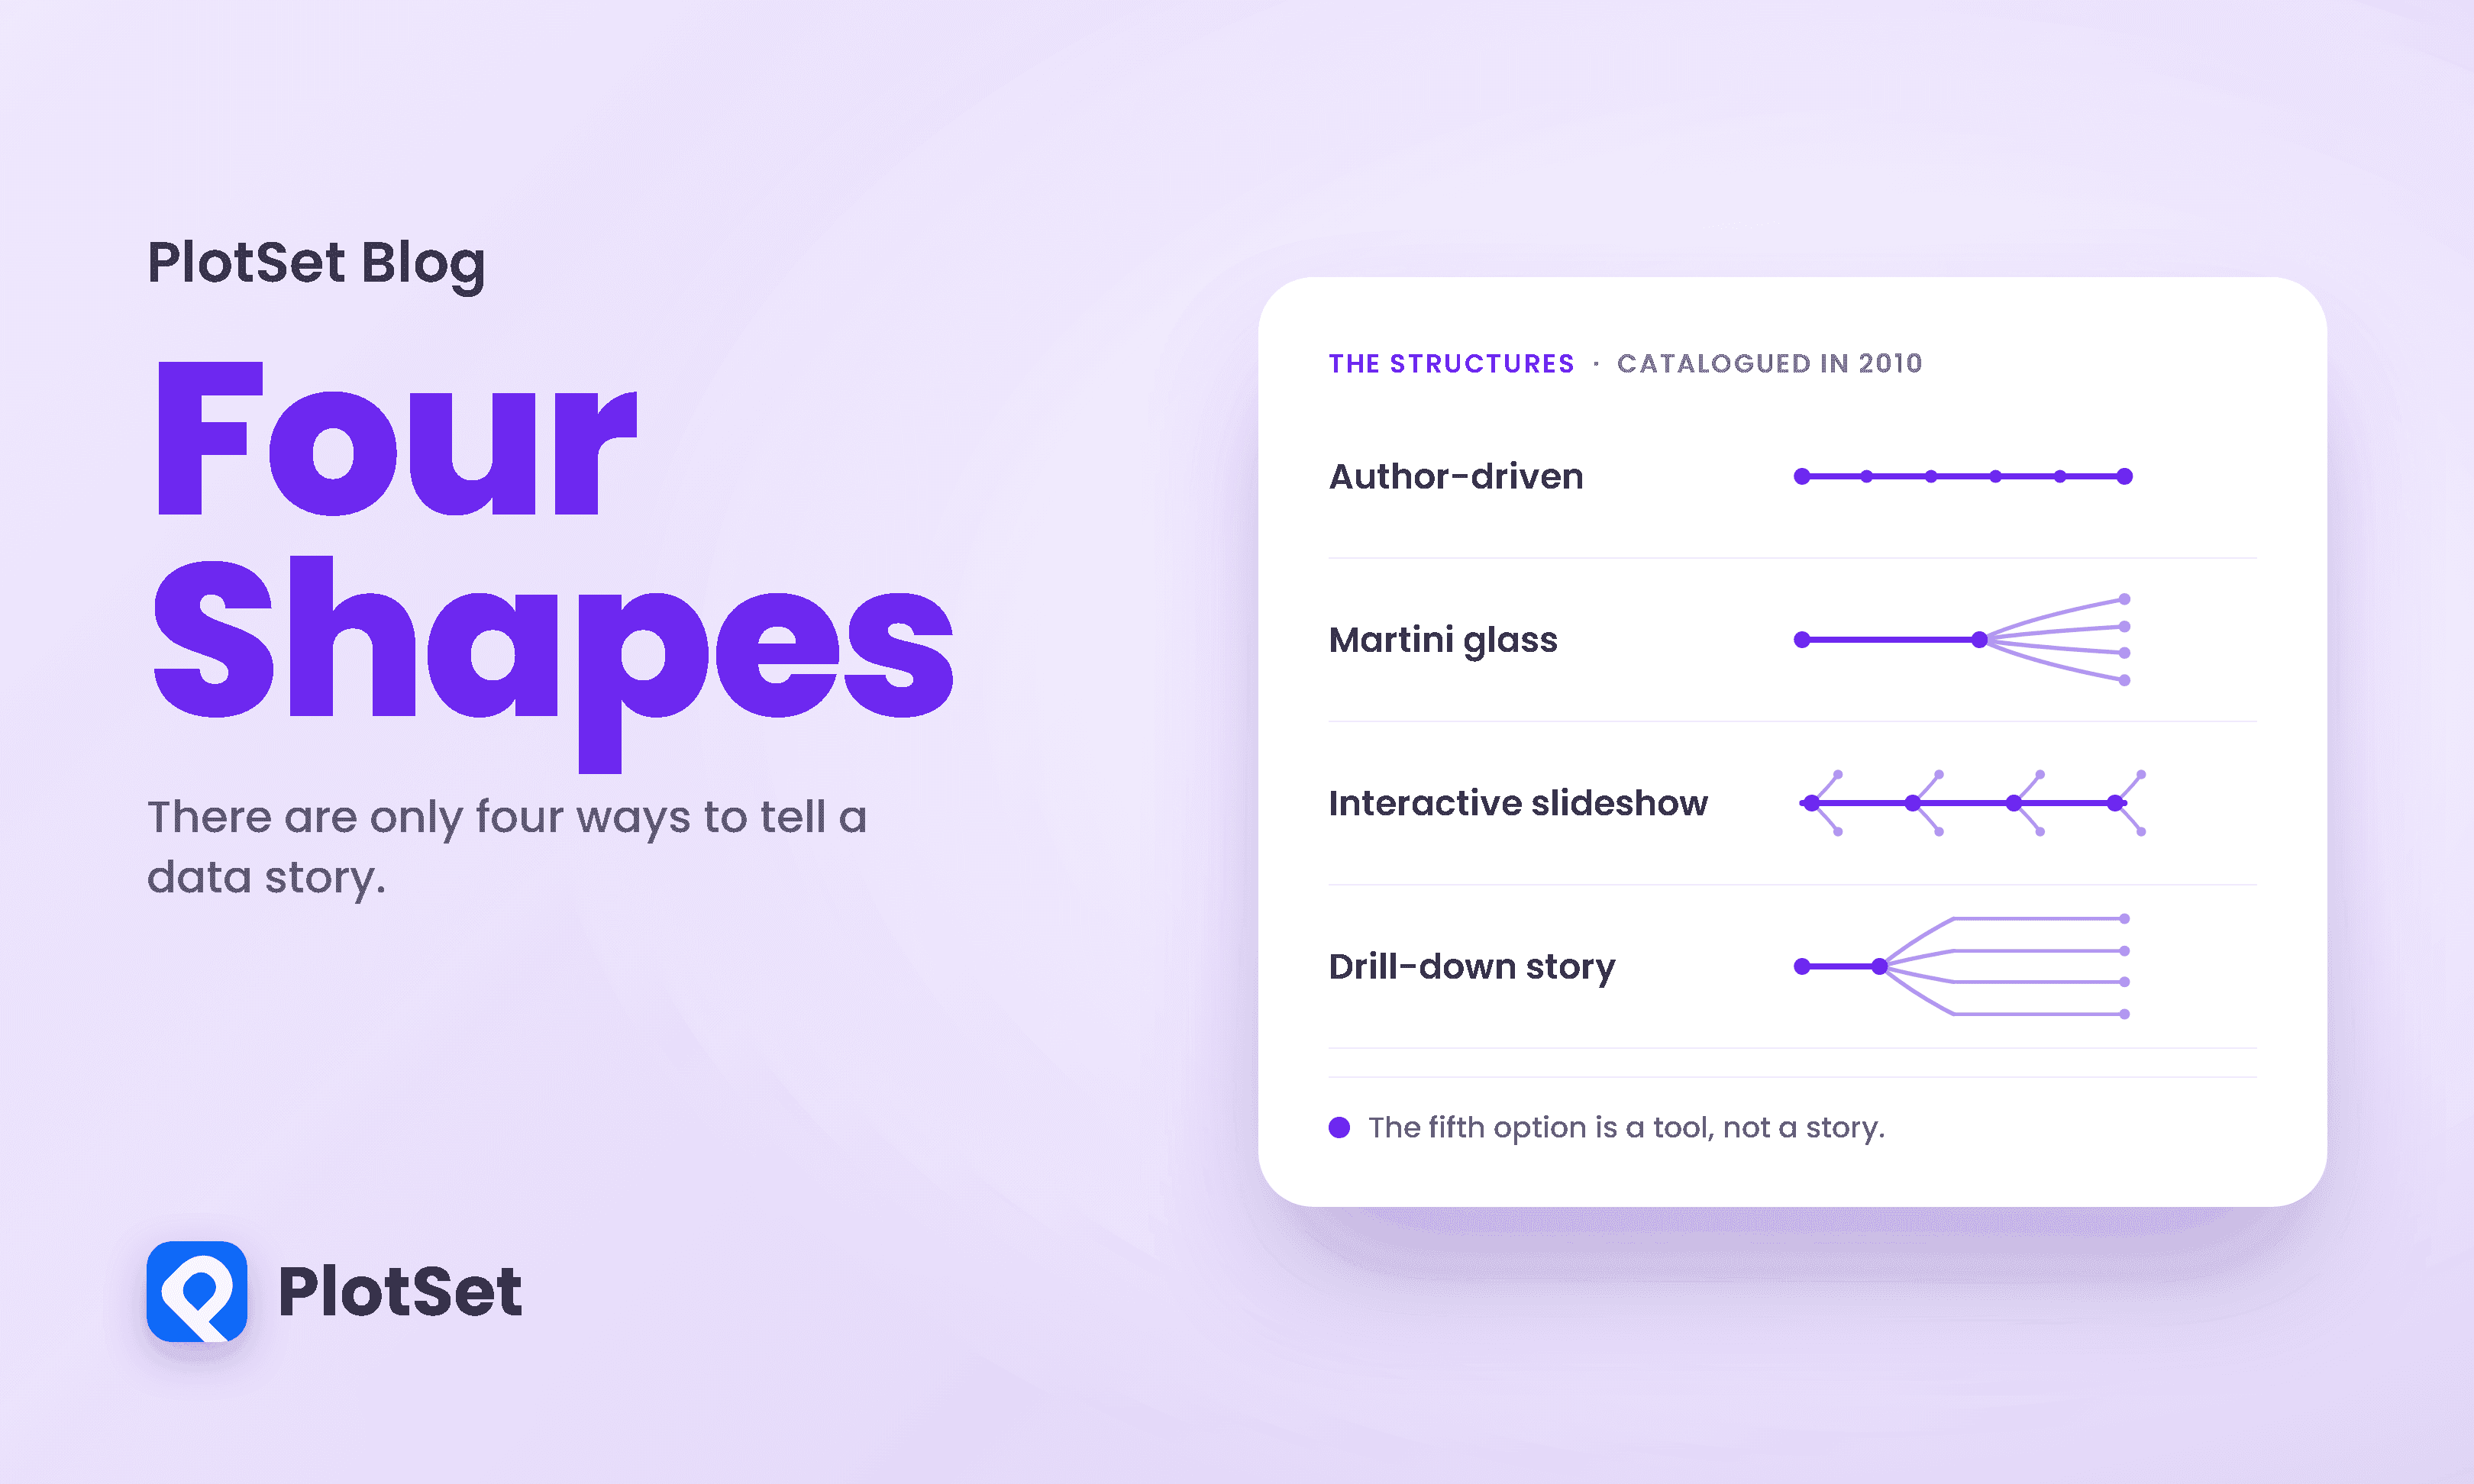
Most advice about data storytelling is atmospheric. Find the narrative. Take the reader on a journey. Make it flow.
10 Min. Lesezeit

Below is a scatterplot of New York City yellow taxi trips from January 2024, fare against distance. It is real data, straight from the city's own records.
10 Min. Lesezeit