
How to Make a Line Graph in Excel (and Fix the Axis)
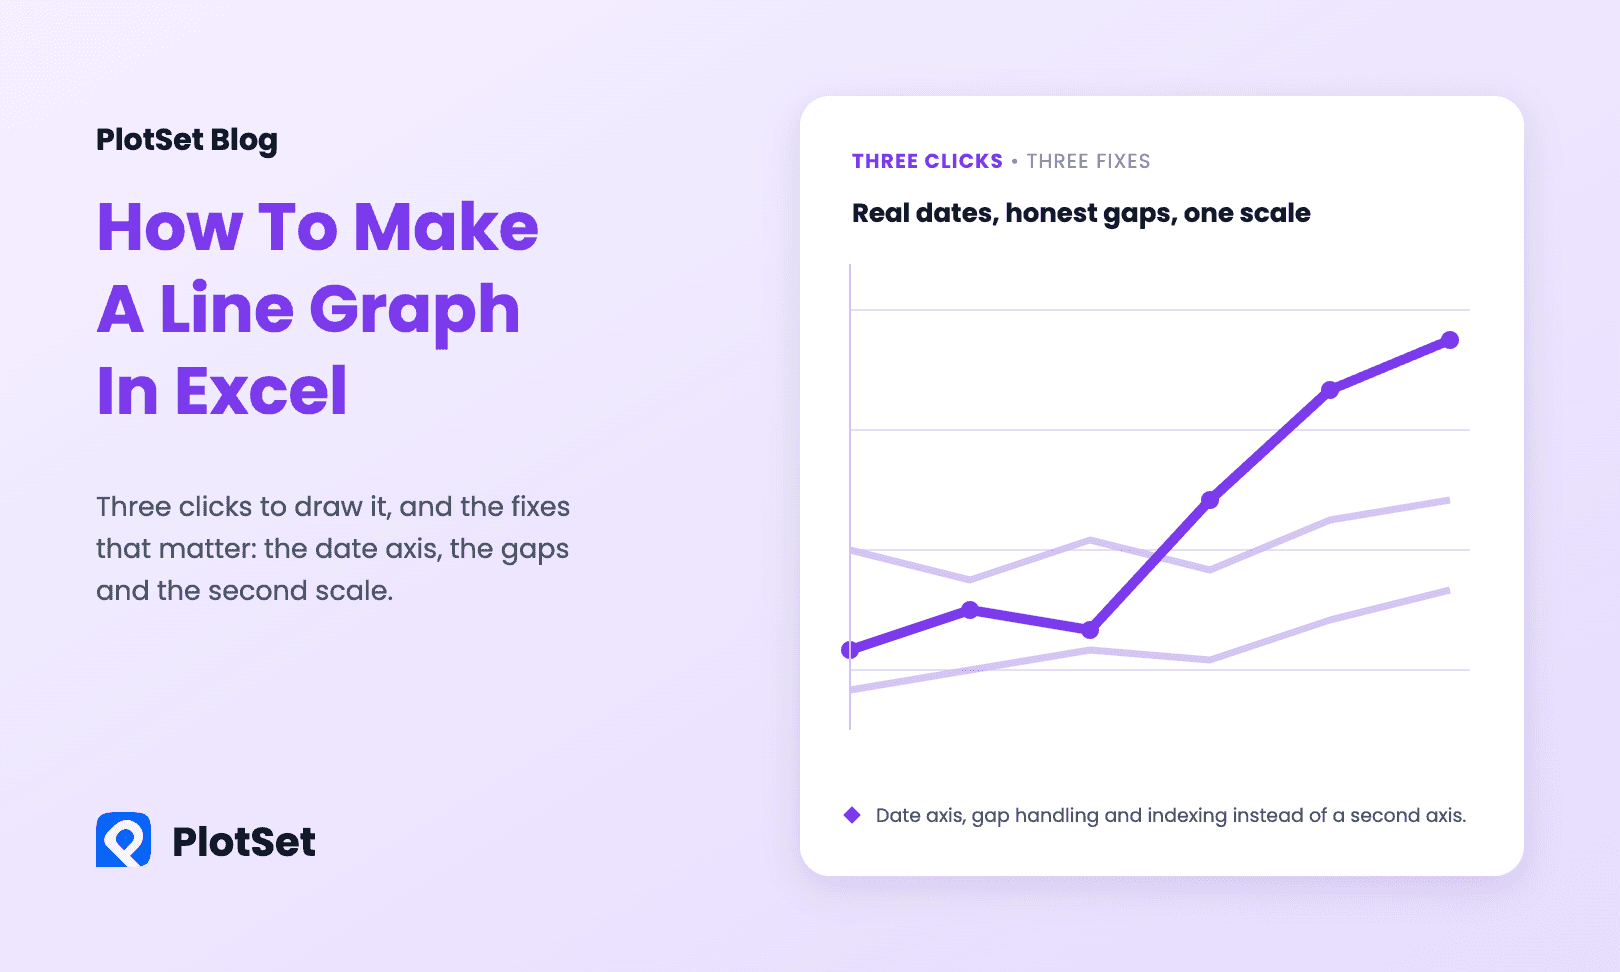
How to make a line graph in Excel in three clicks, then fix what breaks it: the date axis, gaps in the data and a second series on another scale.
7 Min. Lesezeit
How to make a line graph in Excel in three clicks, then fix what breaks it: the date axis, gaps in the data and a second series on another scale.
7 Min. Lesezeit

How to make a bar chart in Excel in four clicks, then fix the three defaults that hurt readability: bar order, colour and missing value labels.
6 Min. Lesezeit
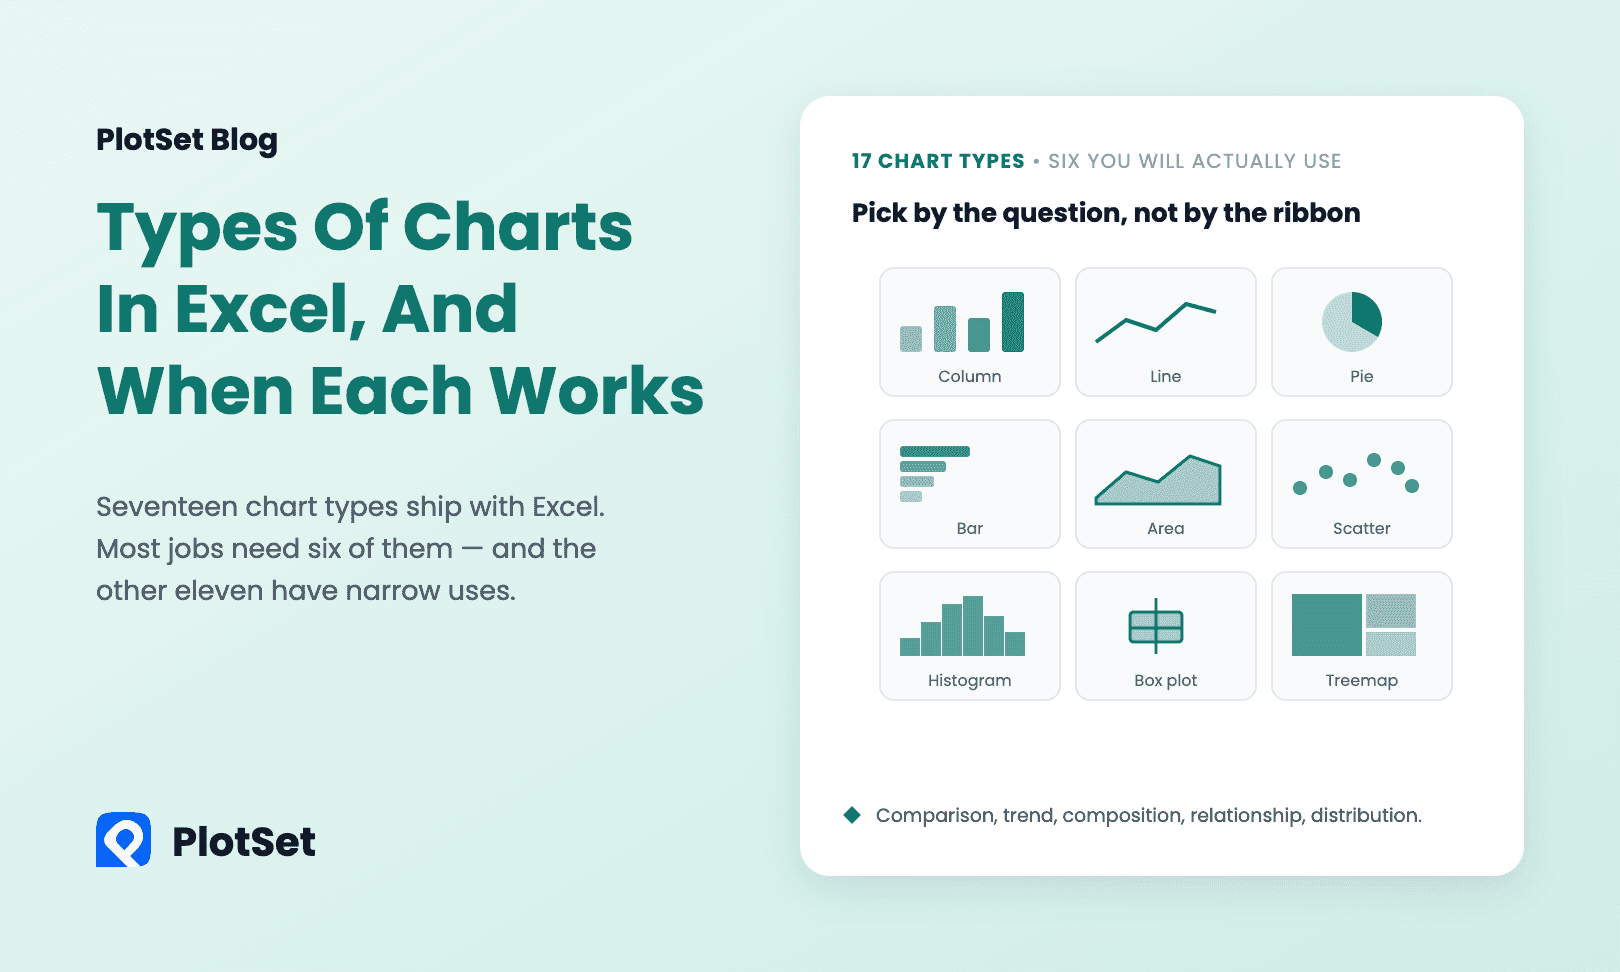
Types of charts in Excel explained: all 17 chart categories grouped by the question they answer, the six that do most of the work, and when each misleads.
8 Min. Lesezeit
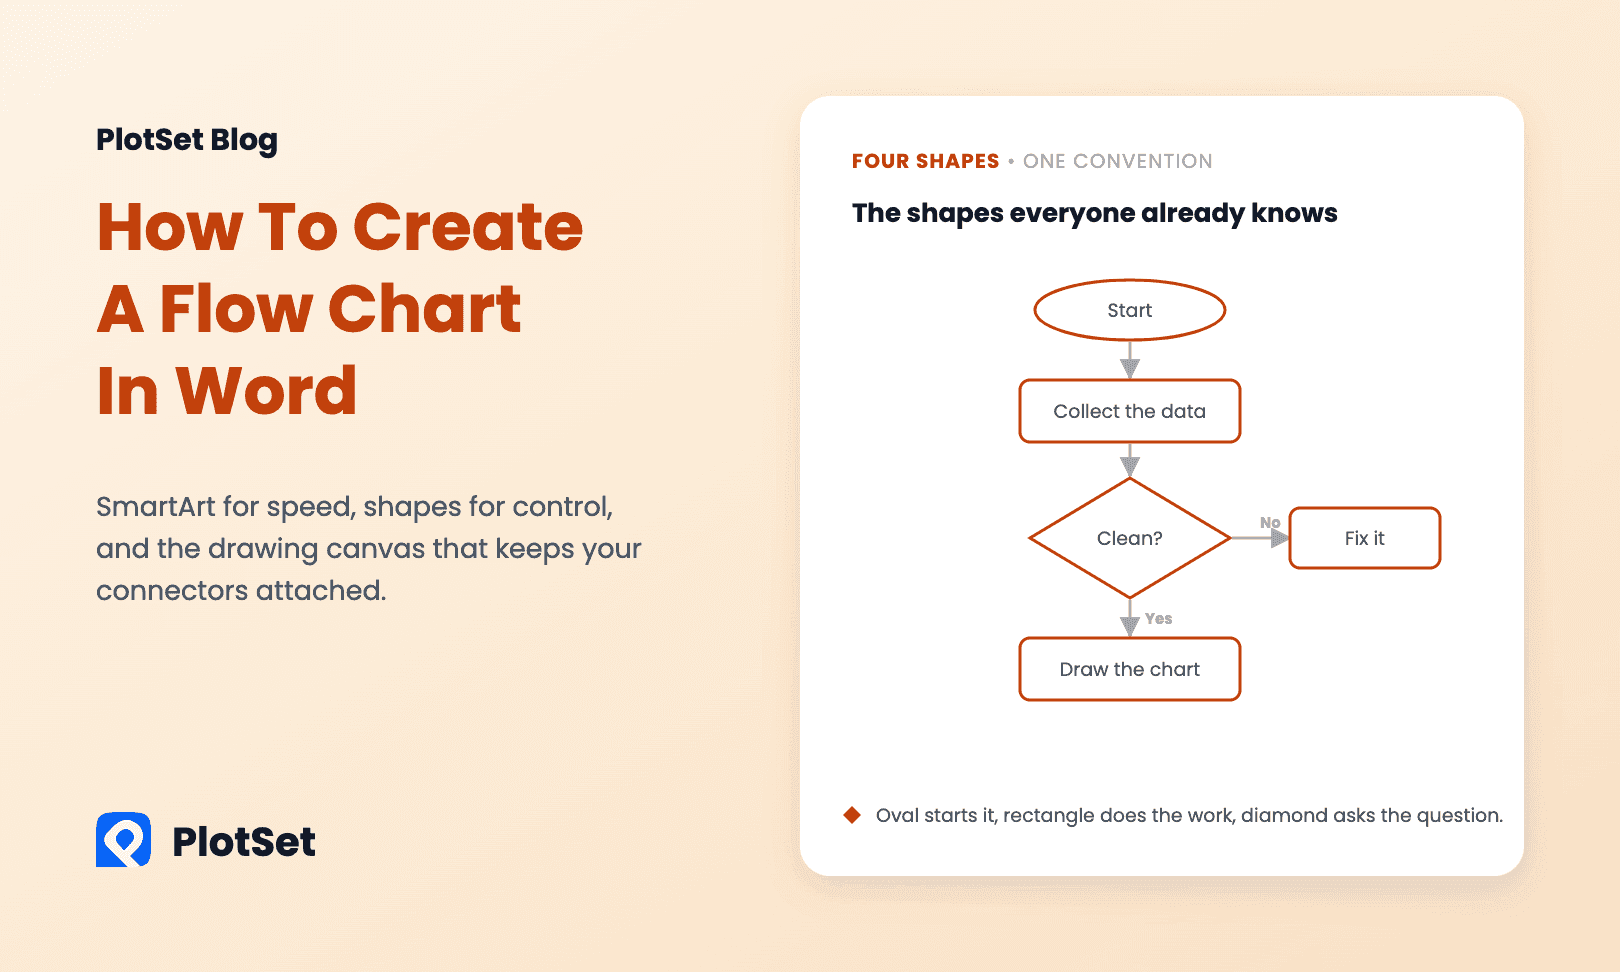
How to create a flow chart in Word with SmartArt or shapes: the four standard shapes, the canvas that keeps arrows attached, and when a sankey fits better.
6 Min. Lesezeit
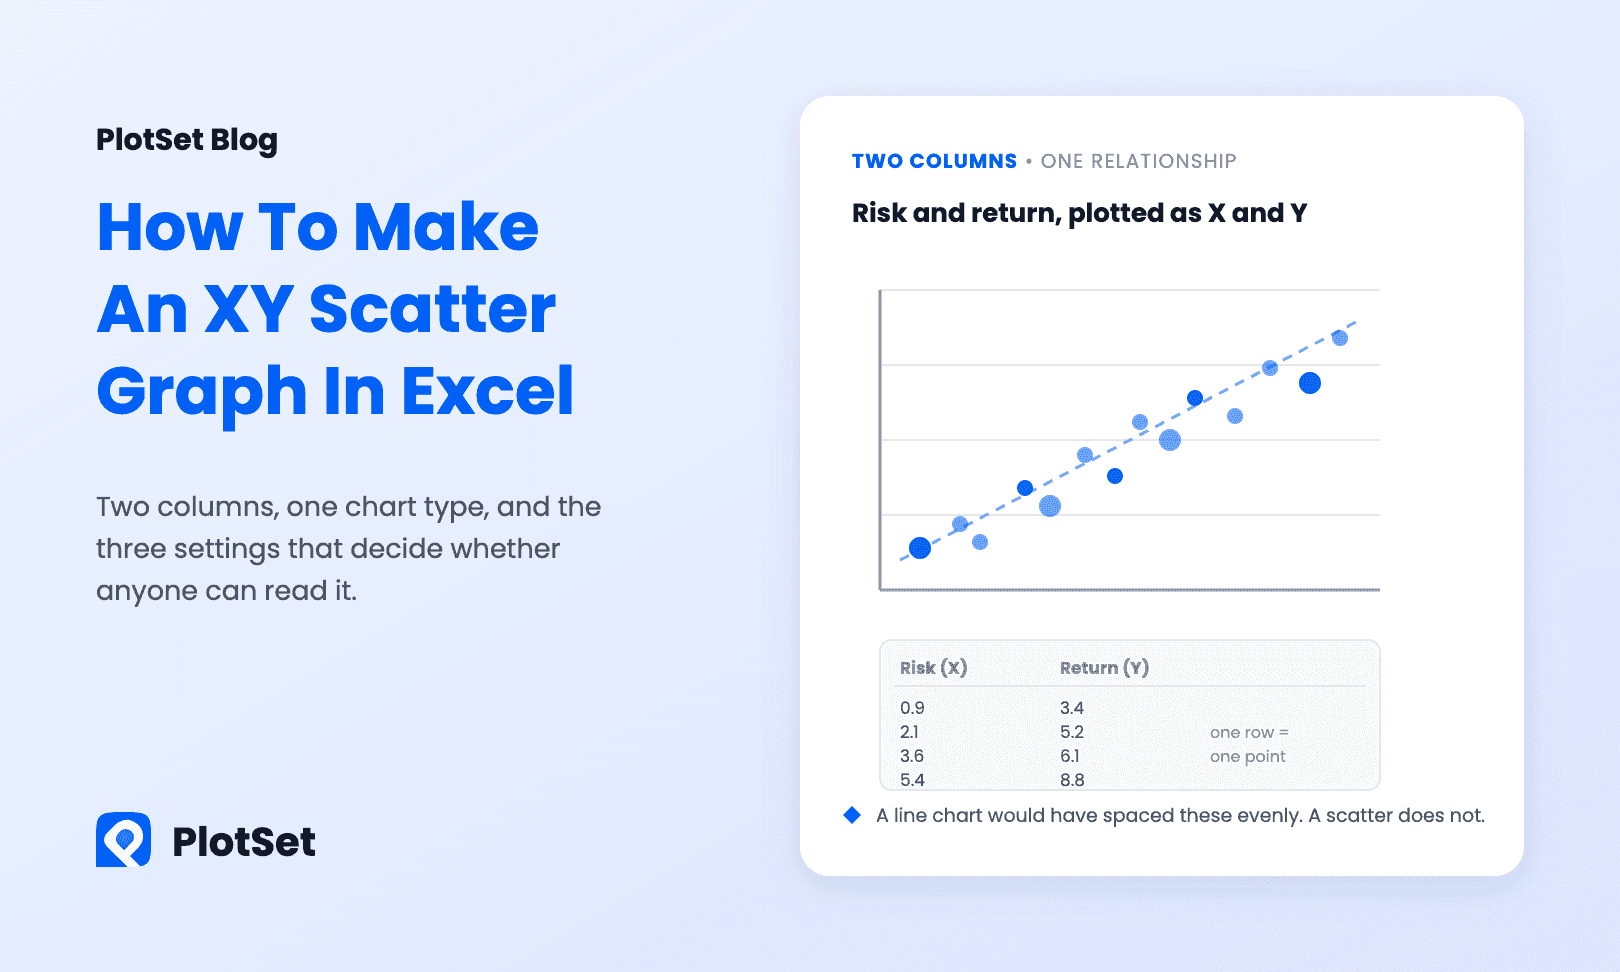
How to make an XY graph in Excel: lay out two numeric columns, insert a scatter chart, fix the axes, add a trendline with R², and skip the Line-chart trap.
7 Min. Lesezeit
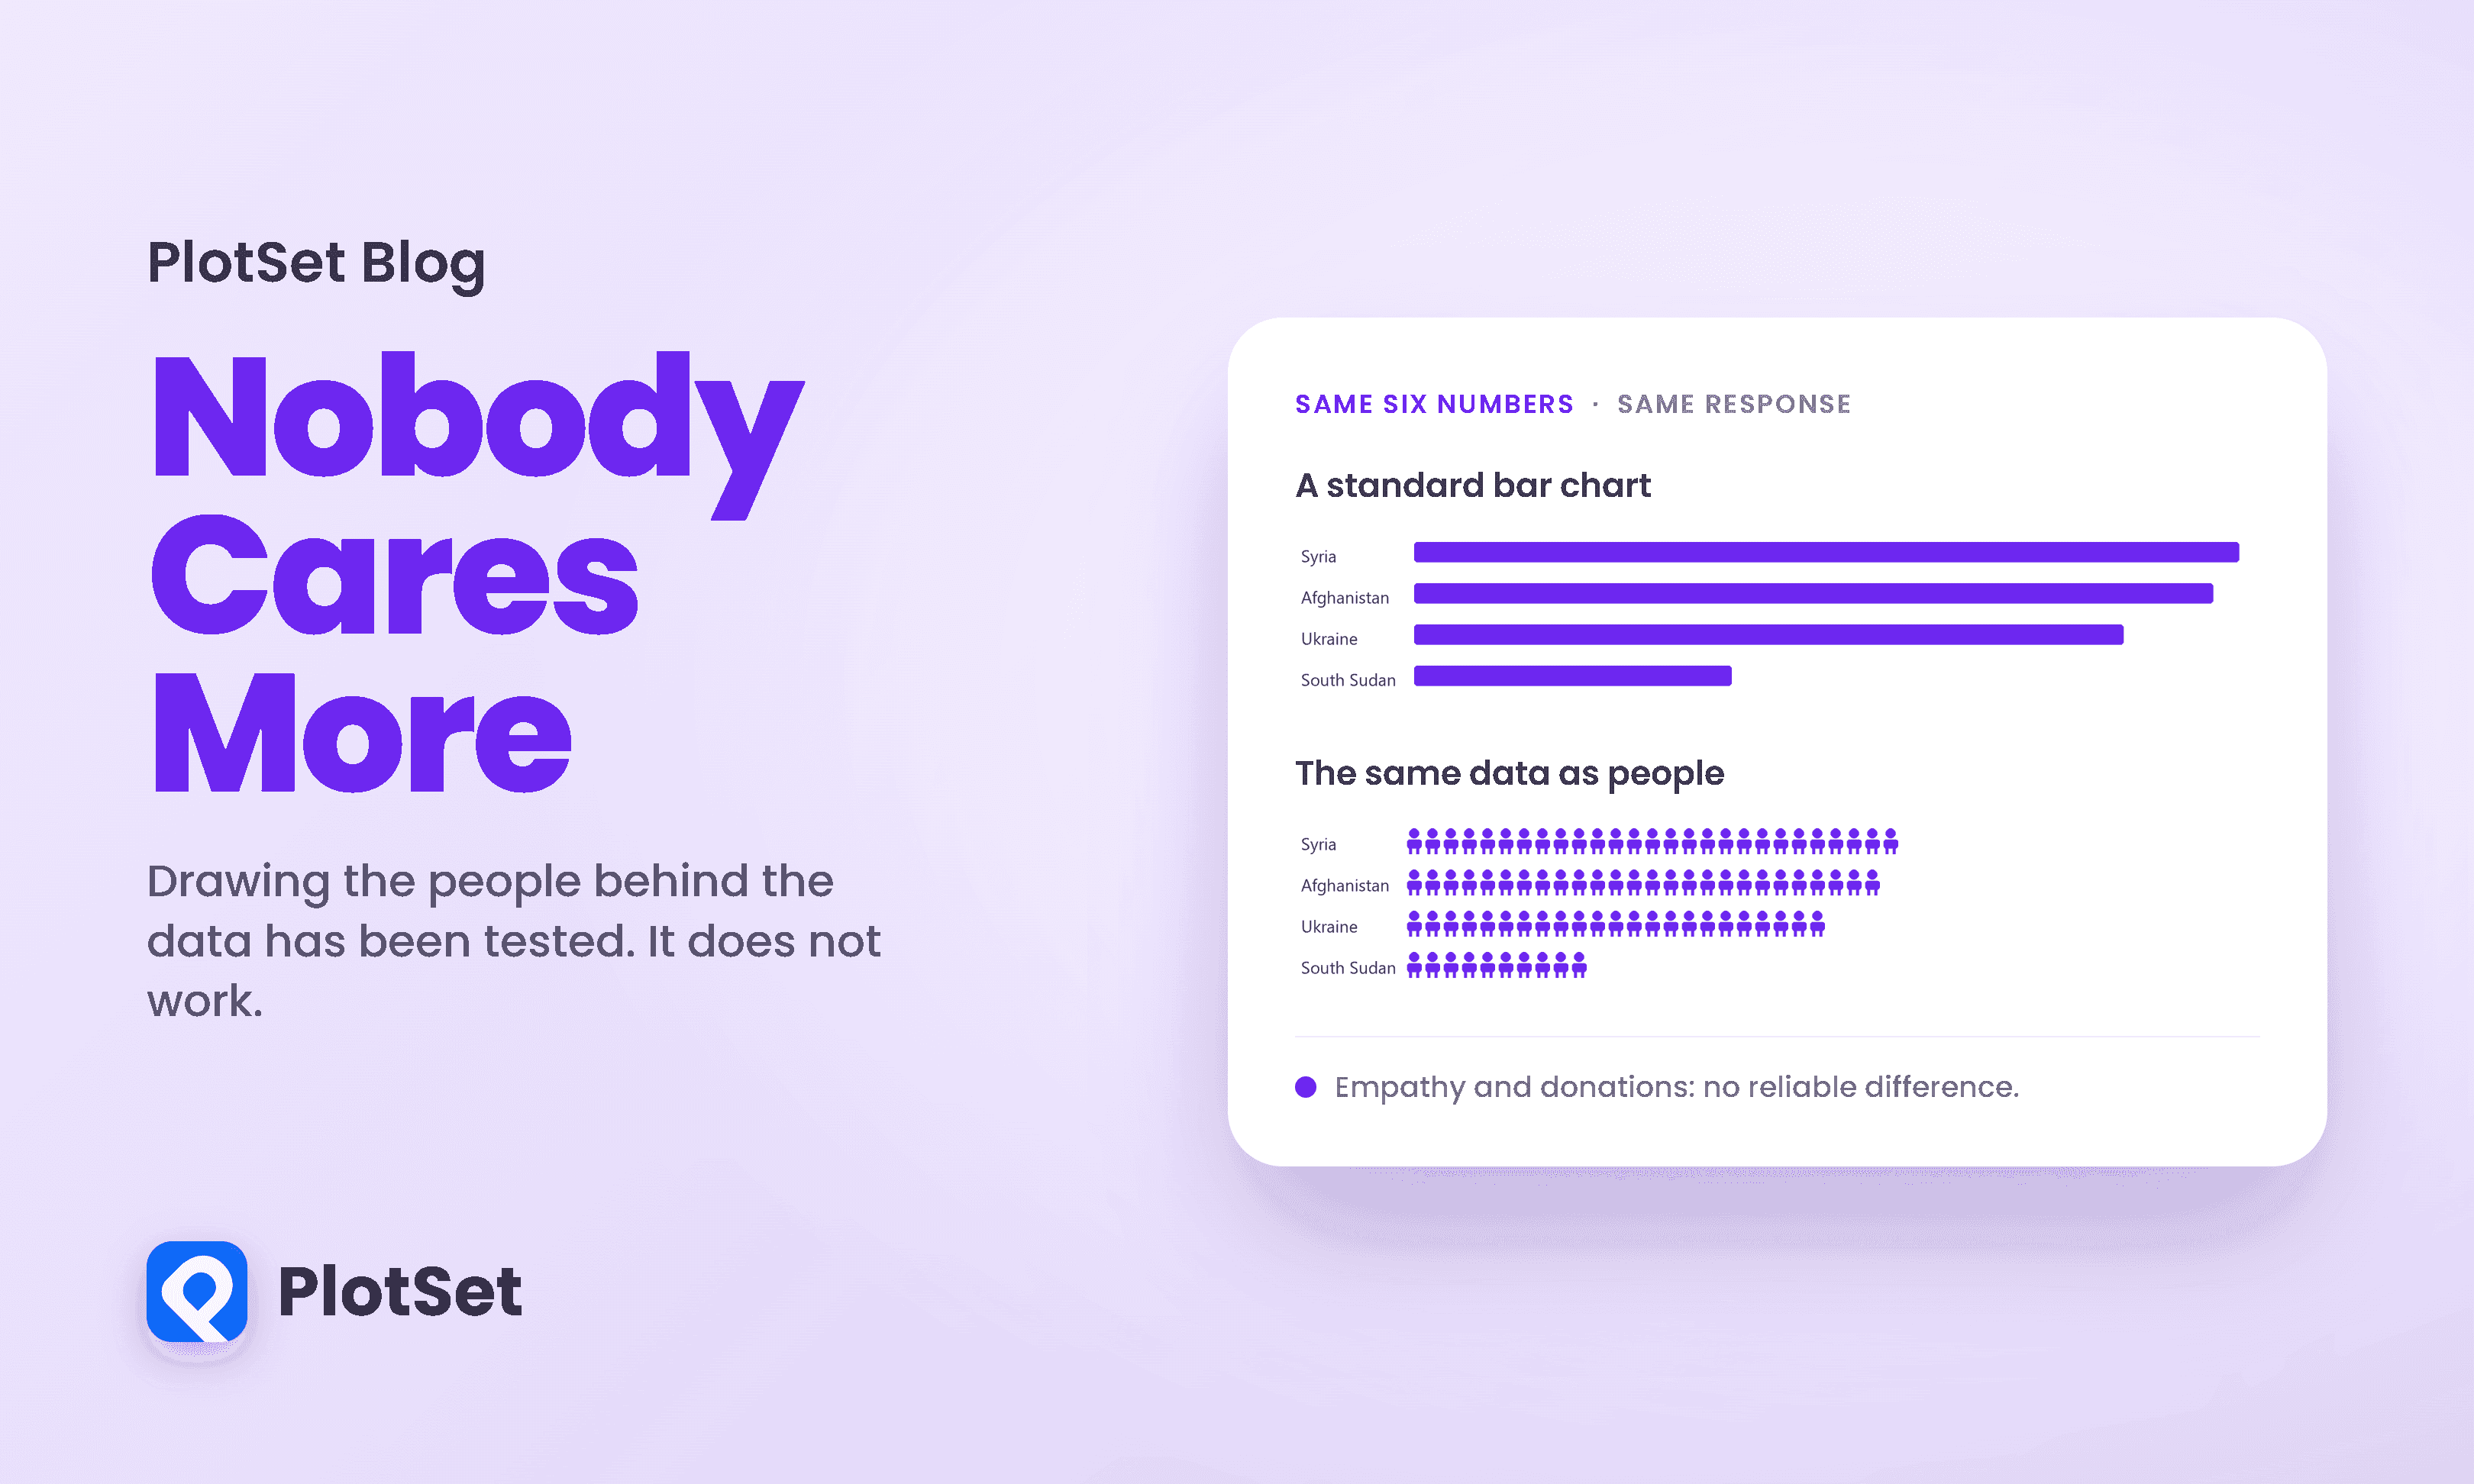
Anthropographics, charts that draw data as people, are meant to build empathy. Nine experiments with 1,100 people say they move feelings, not donations.
9 Min. Lesezeit
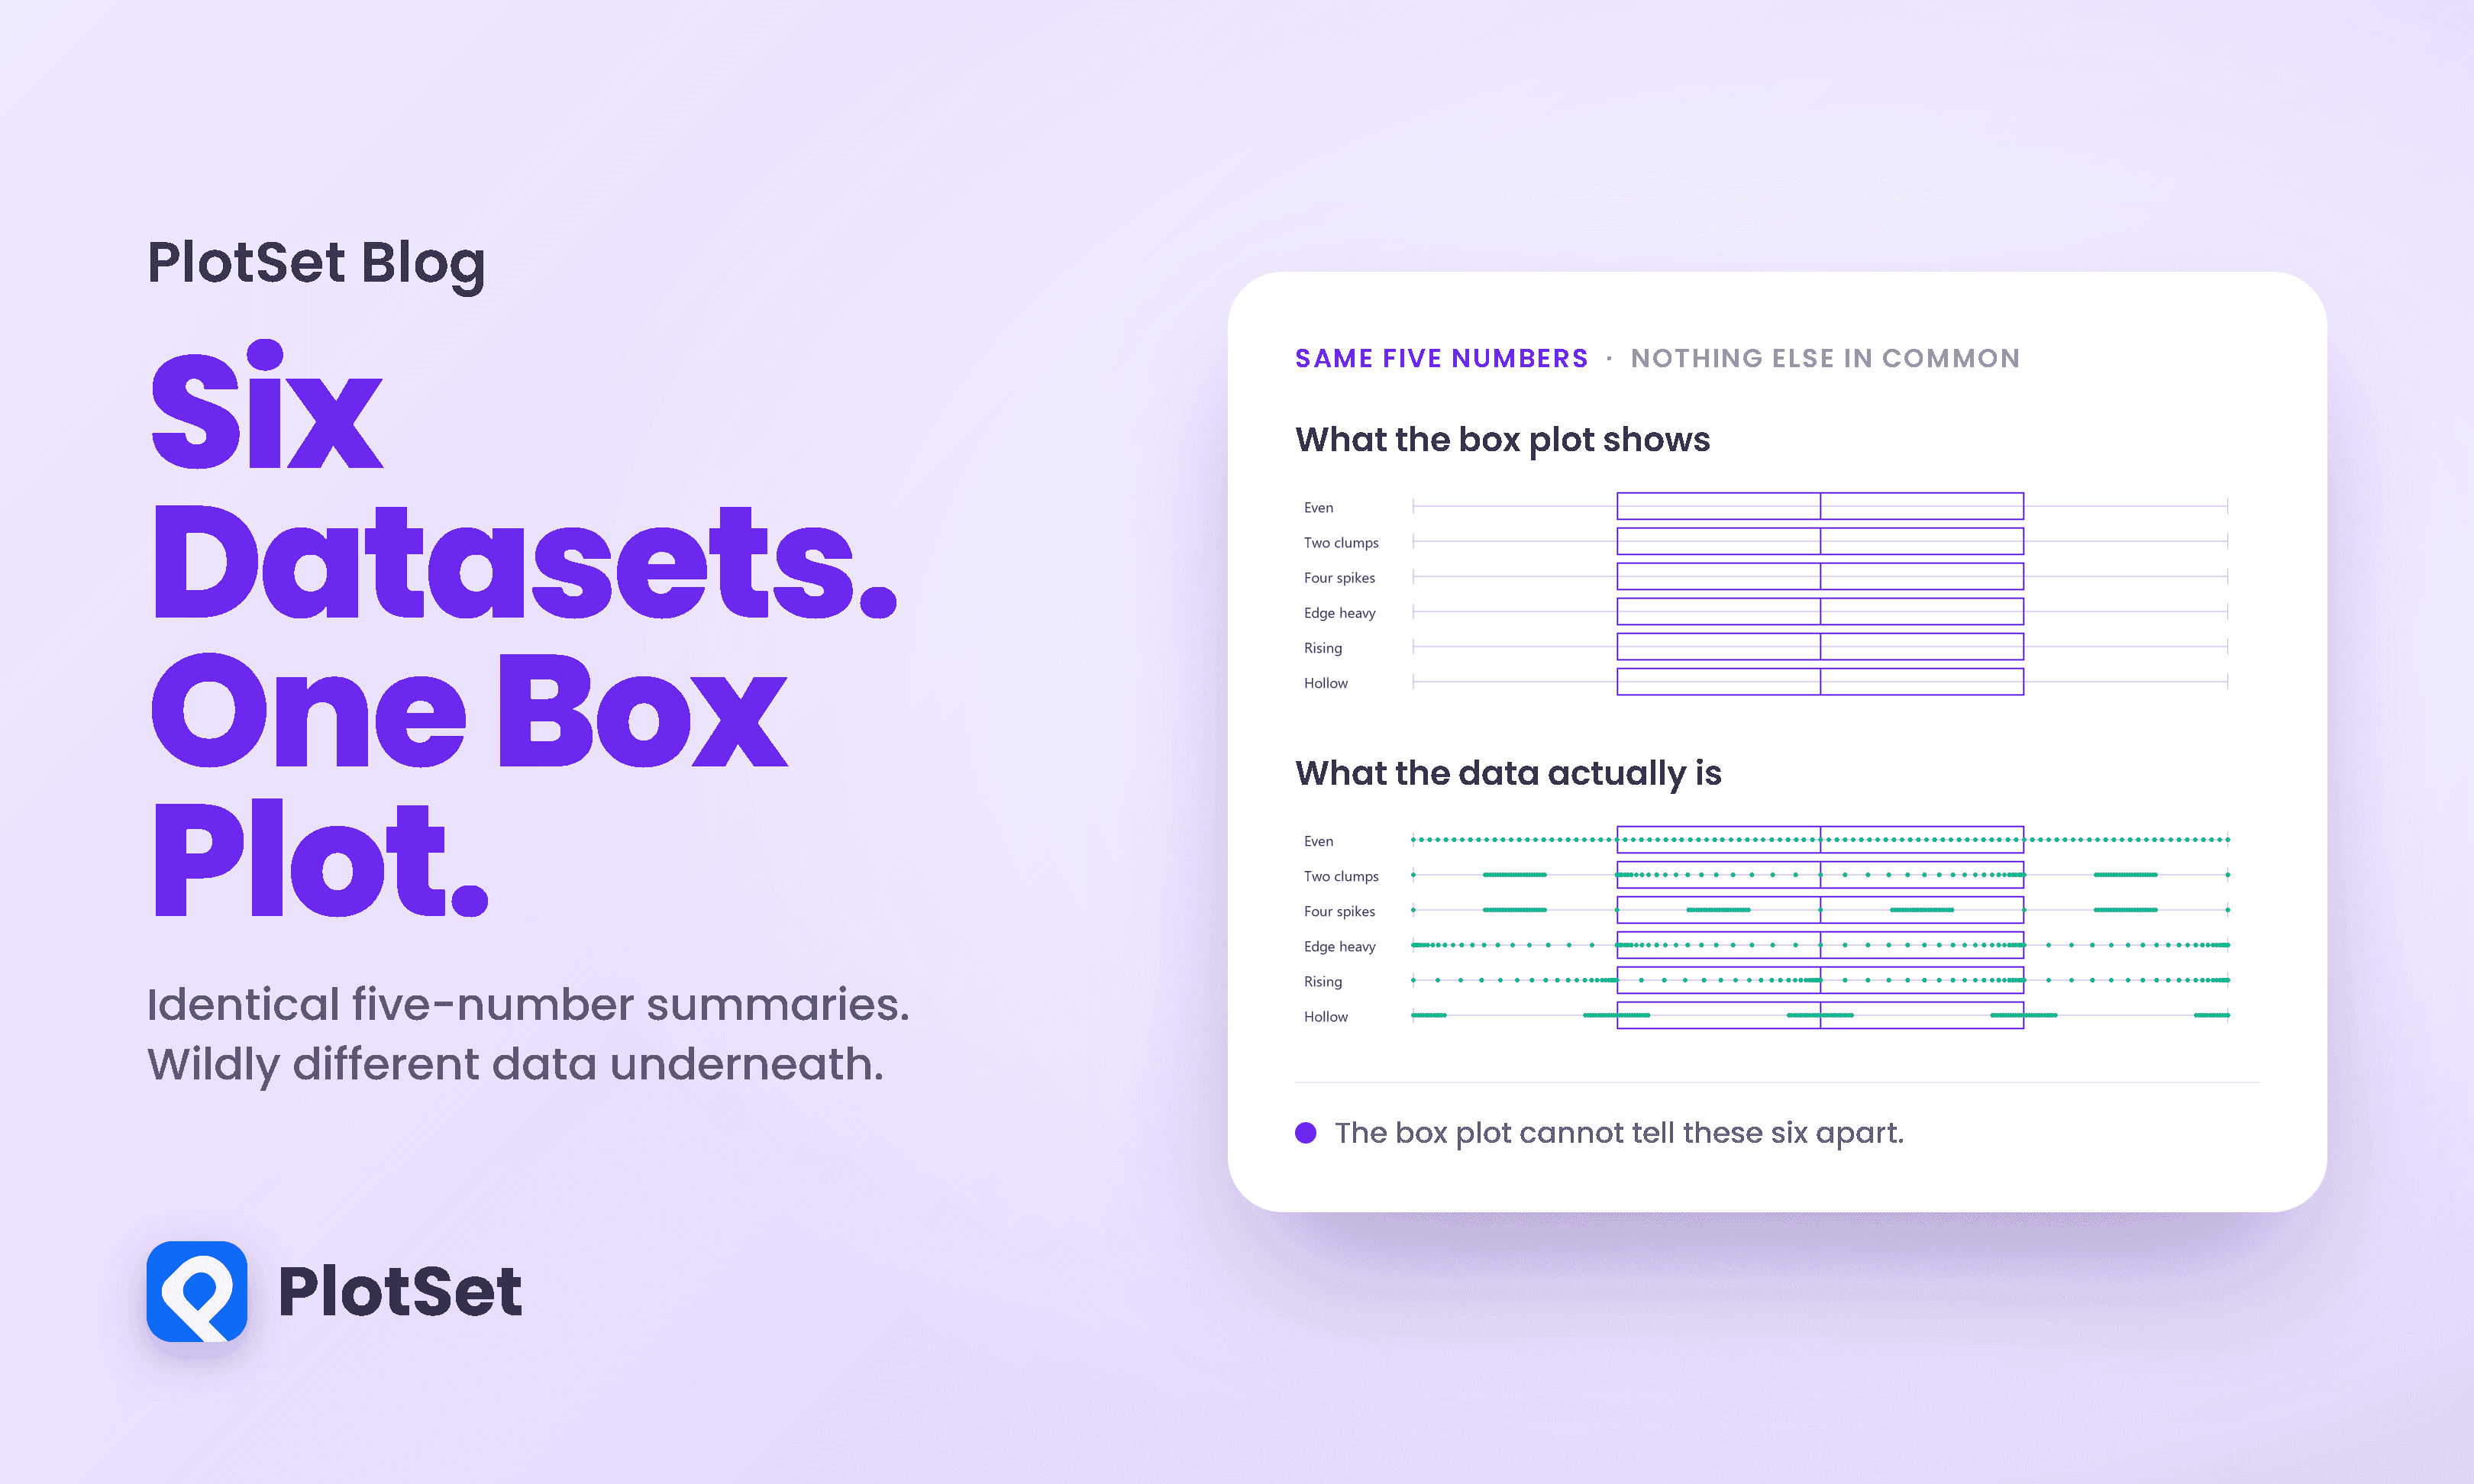
The Datasaurus Dozen shows 13 datasets with the same statistics and different graphs. See why box plots hide the same problem and what to chart instead.
10 Min. Lesezeit
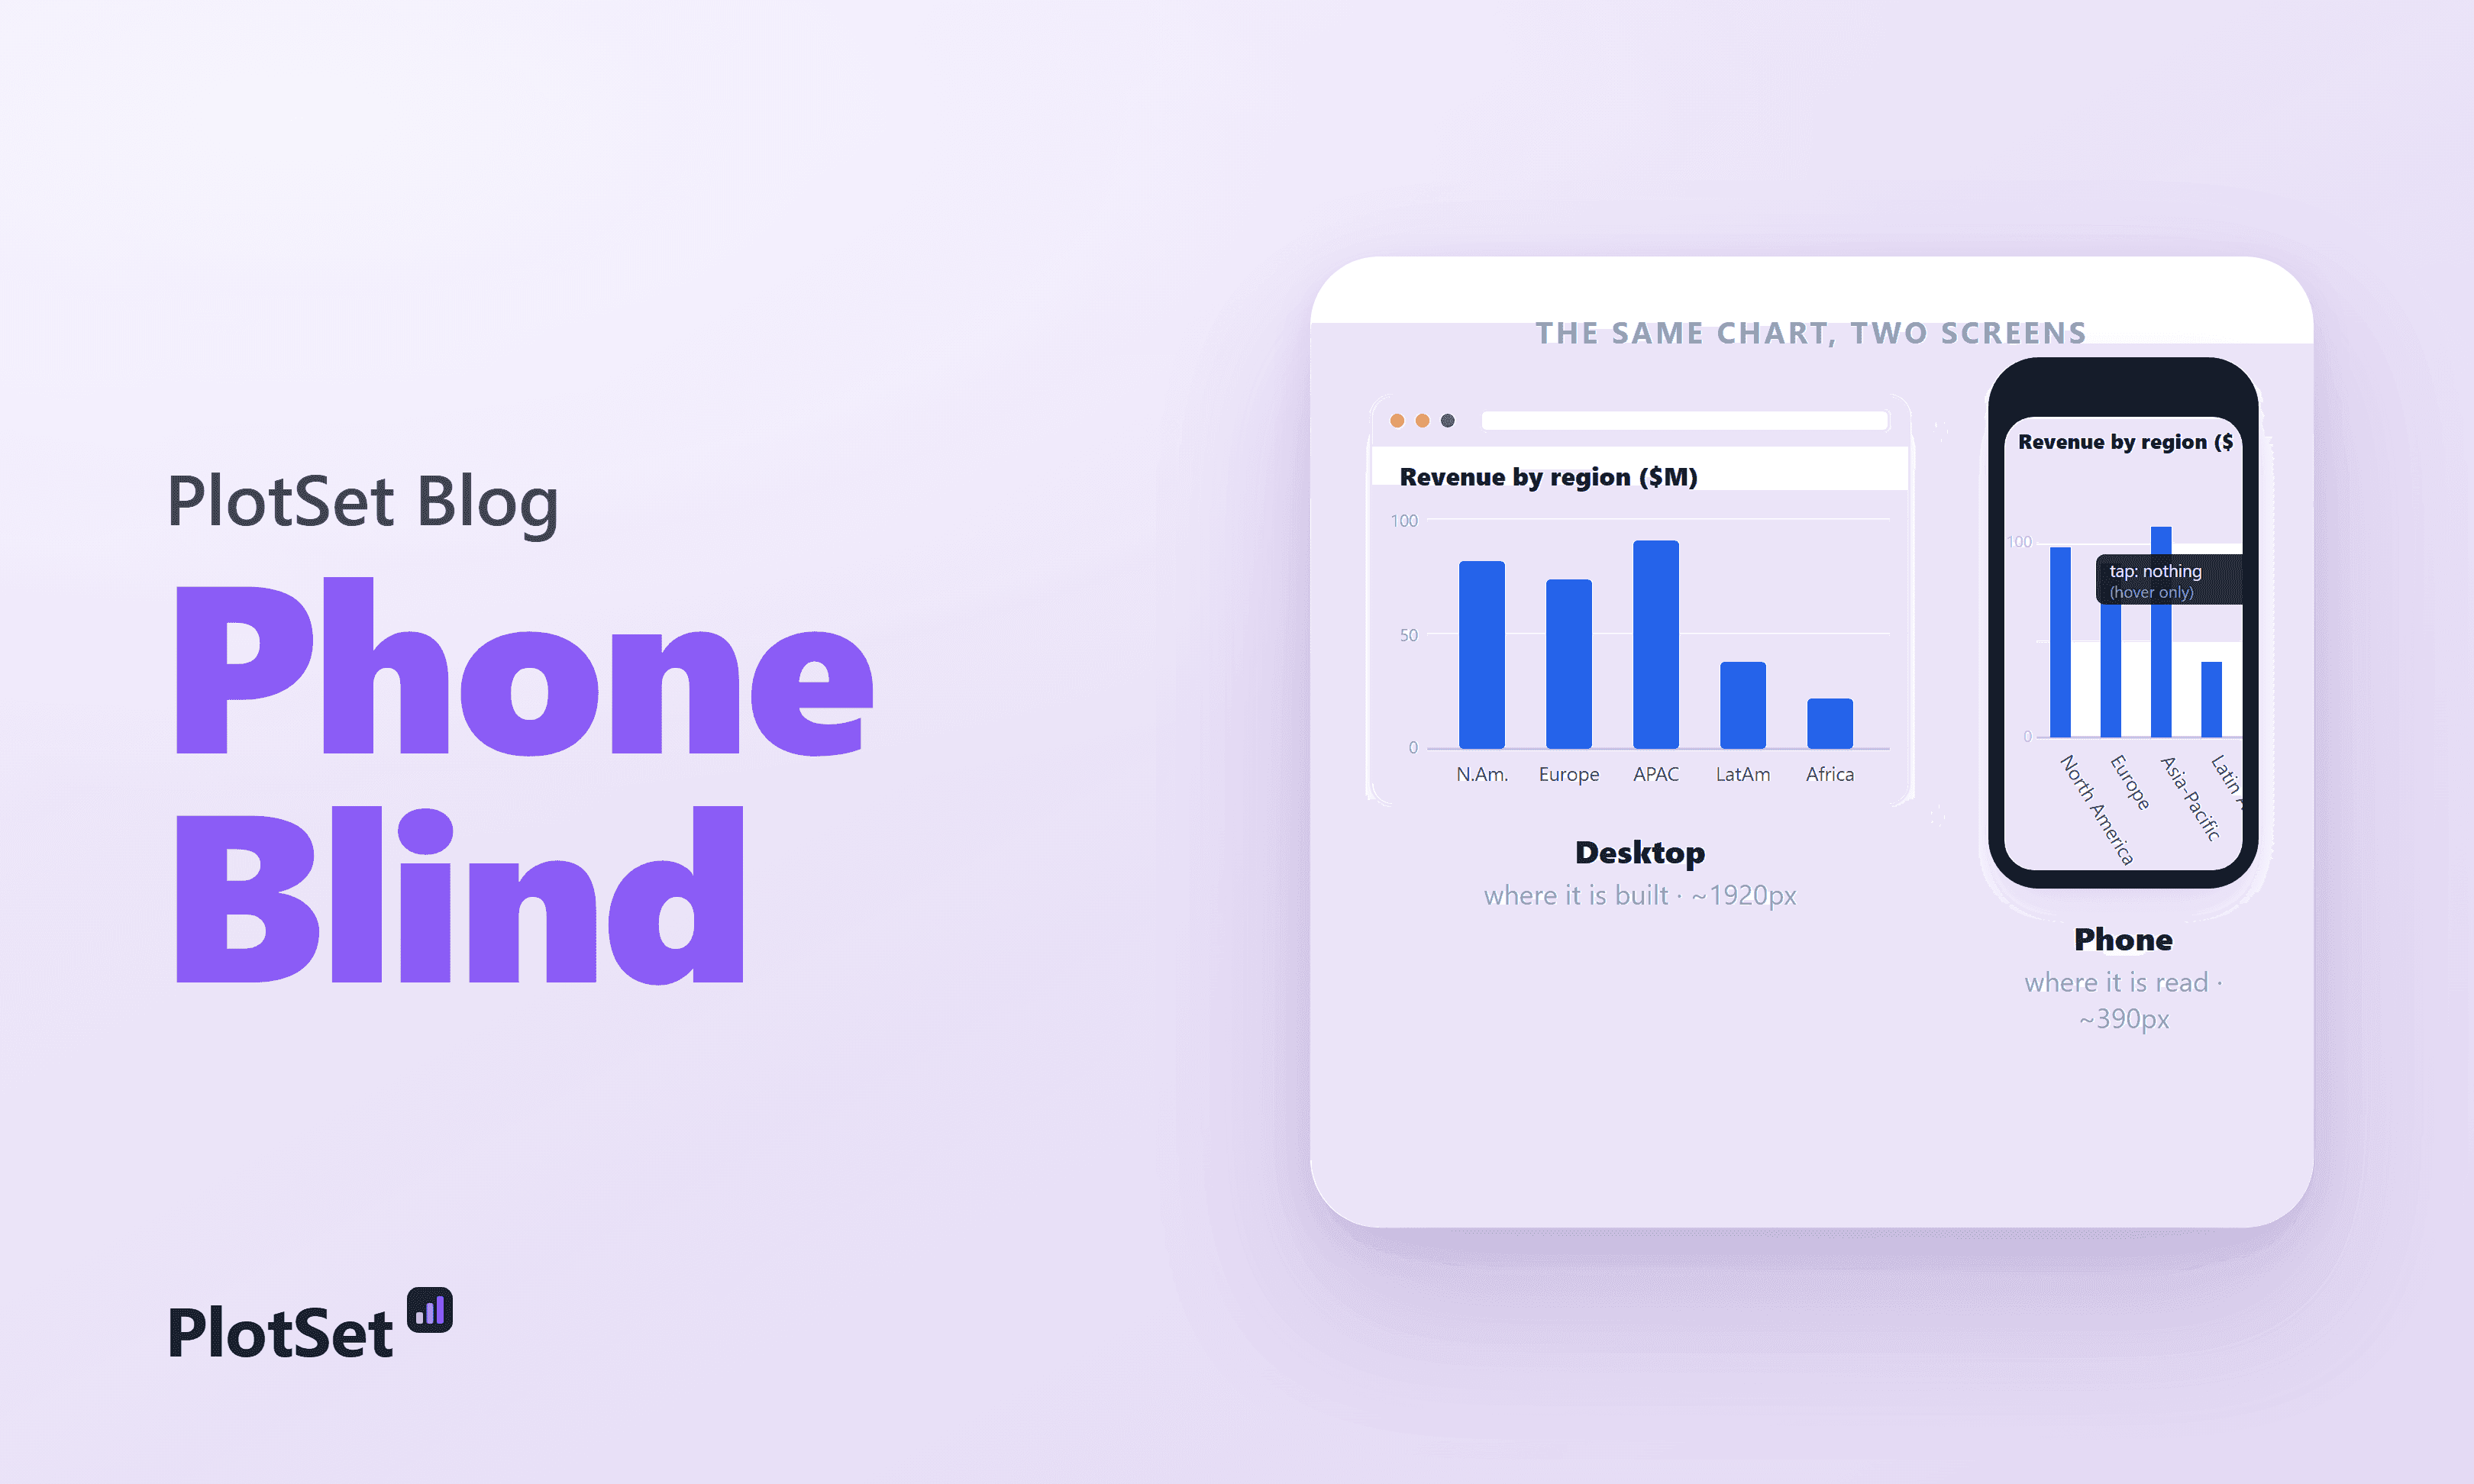
Most readers see your chart on a 360-430px phone, where labels collide and legends overflow. What breaks, why, and how to make mobile-friendly charts.
7 Min. Lesezeit
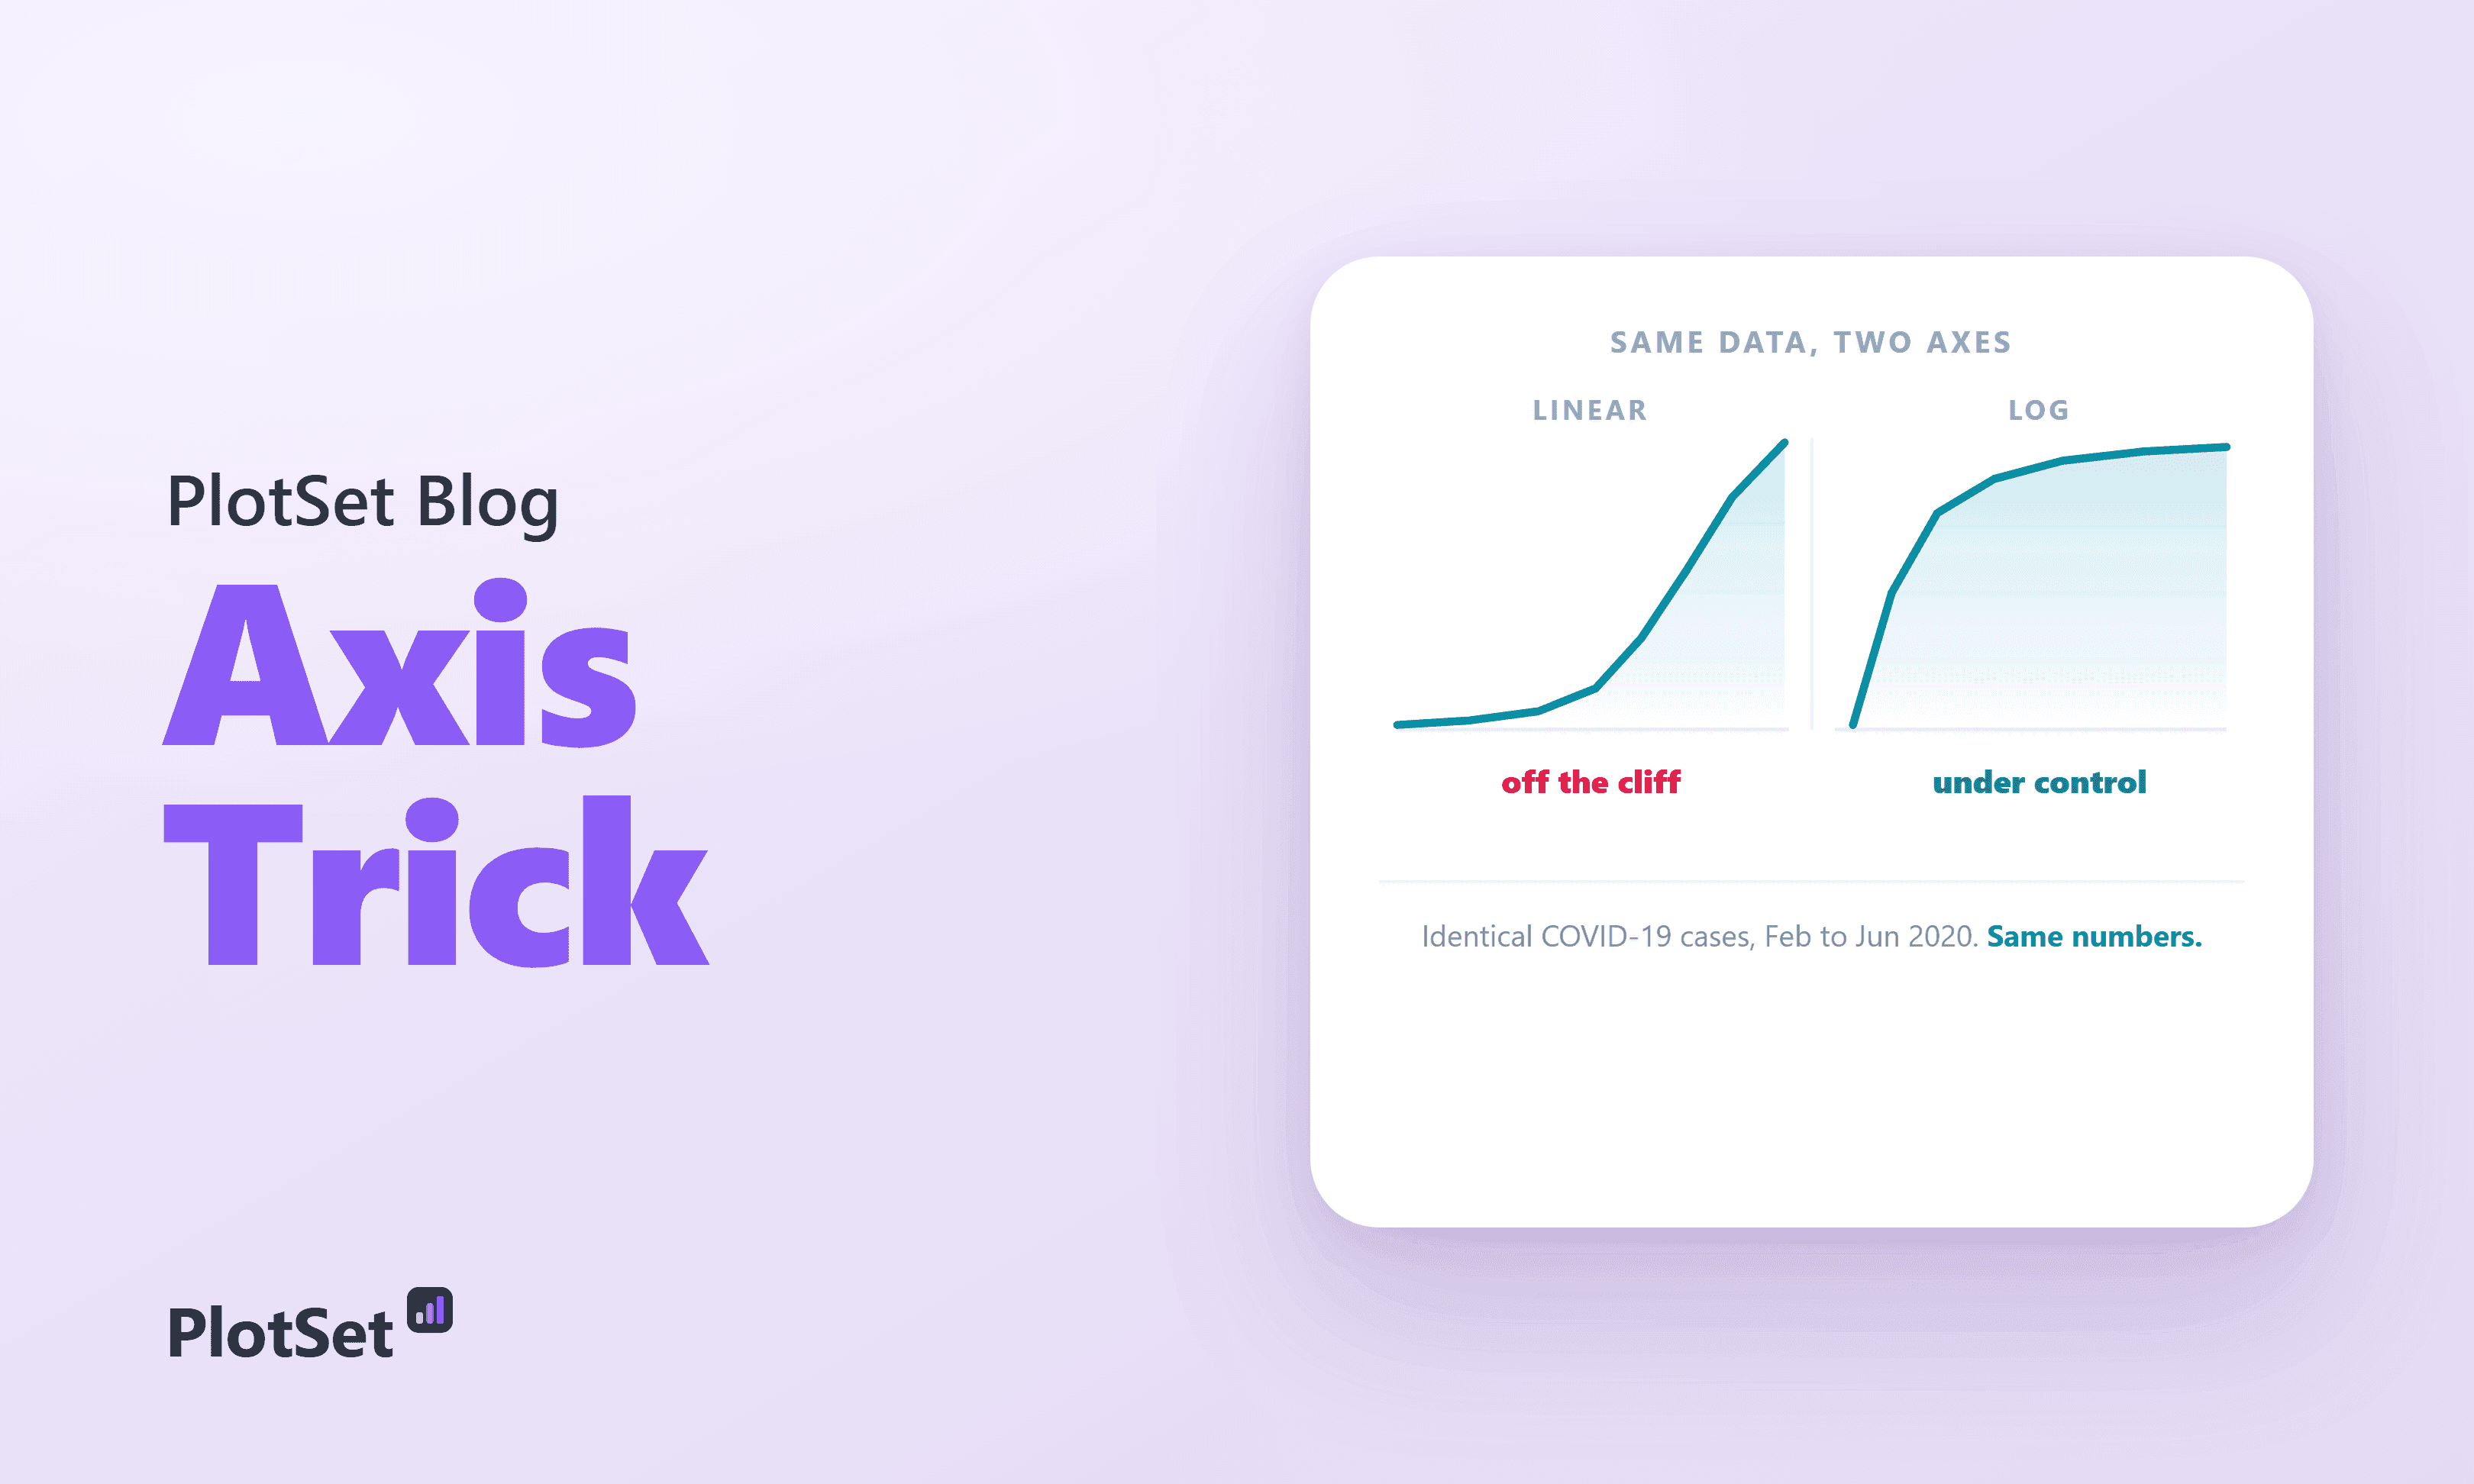
A logarithmic axis turns explosive growth into a gentle, straight line.
7 Min. Lesezeit
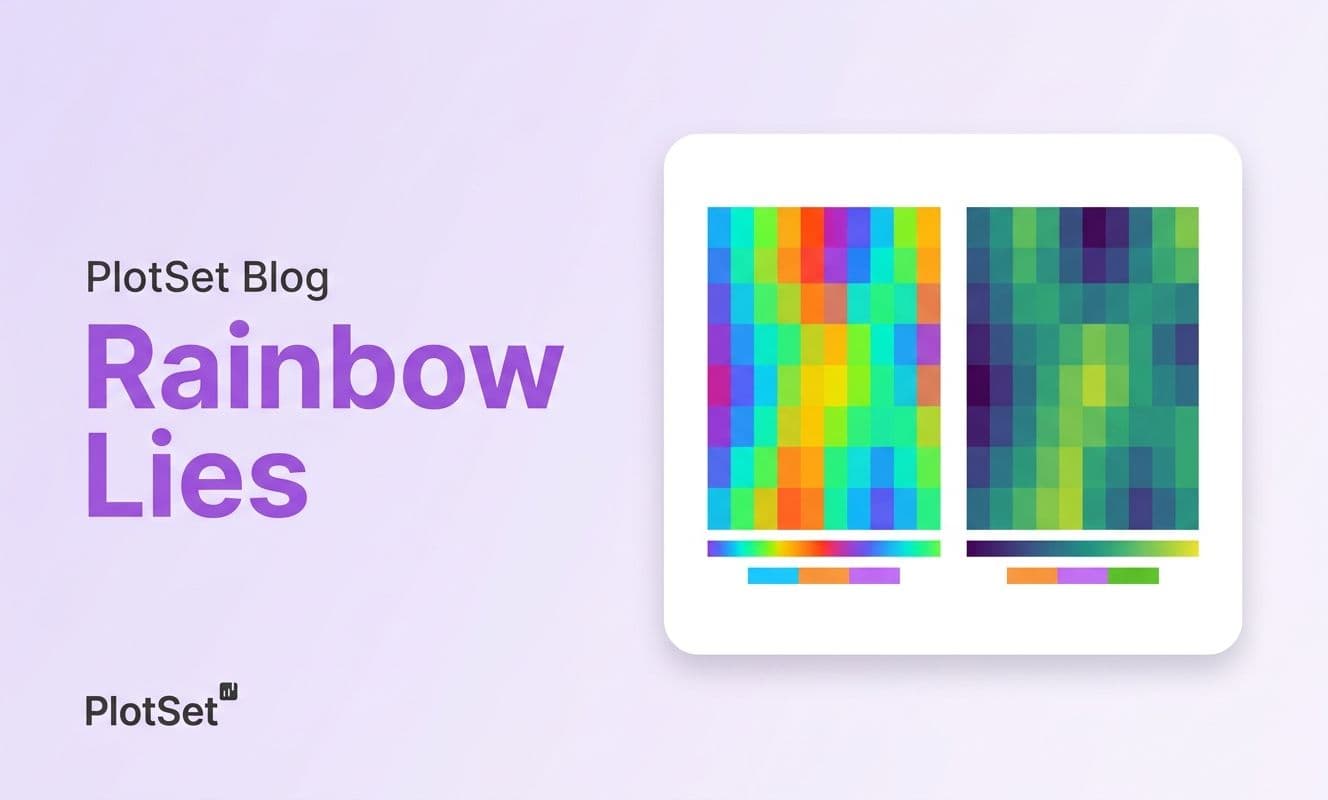
Rainbow color maps distort data, invent boundaries, and exclude 300M colorblind viewers. Learn why perceptually uniform scales like viridis fix the problem.
7 Min. Lesezeit
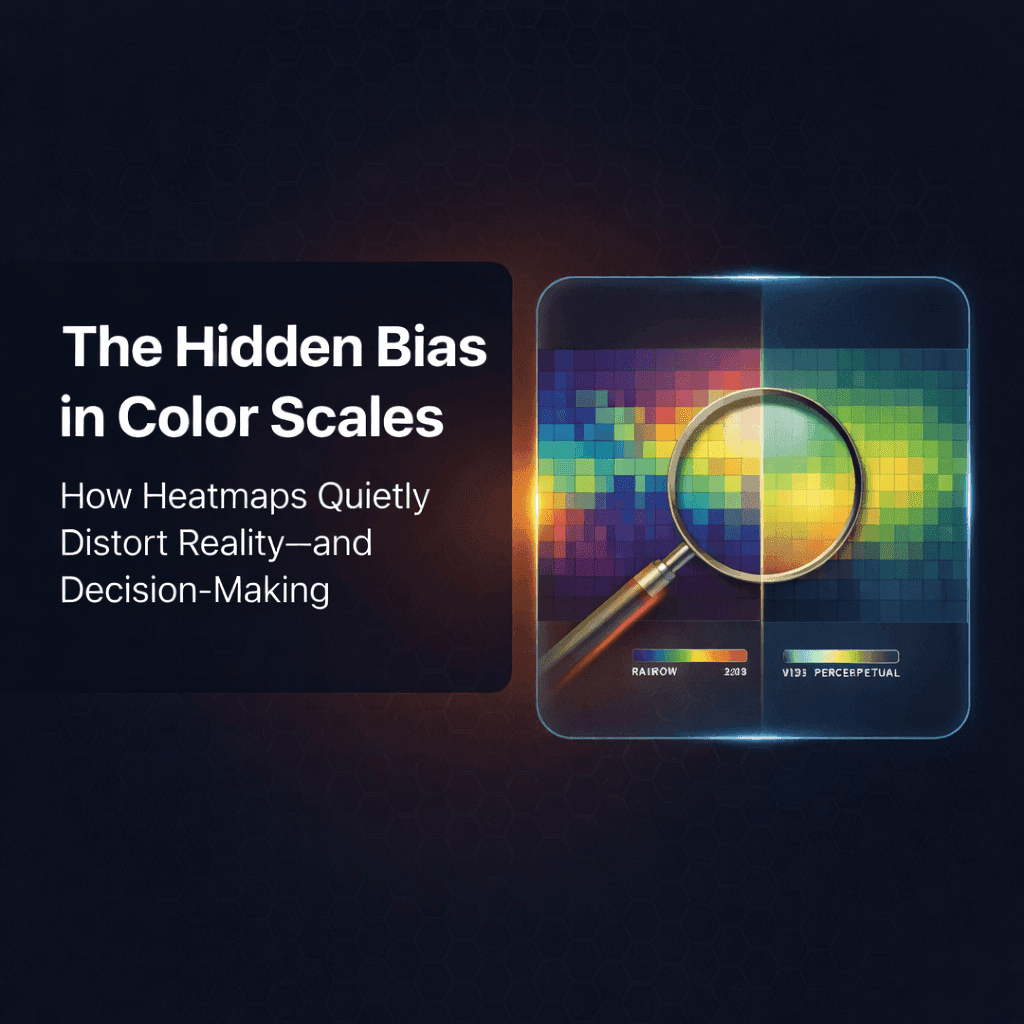
Heatmap color scales change how readers see your numbers. Learn why rainbow scales mislead, what perceptually ordered palettes fix, and how to test yours.
7 Min. Lesezeit
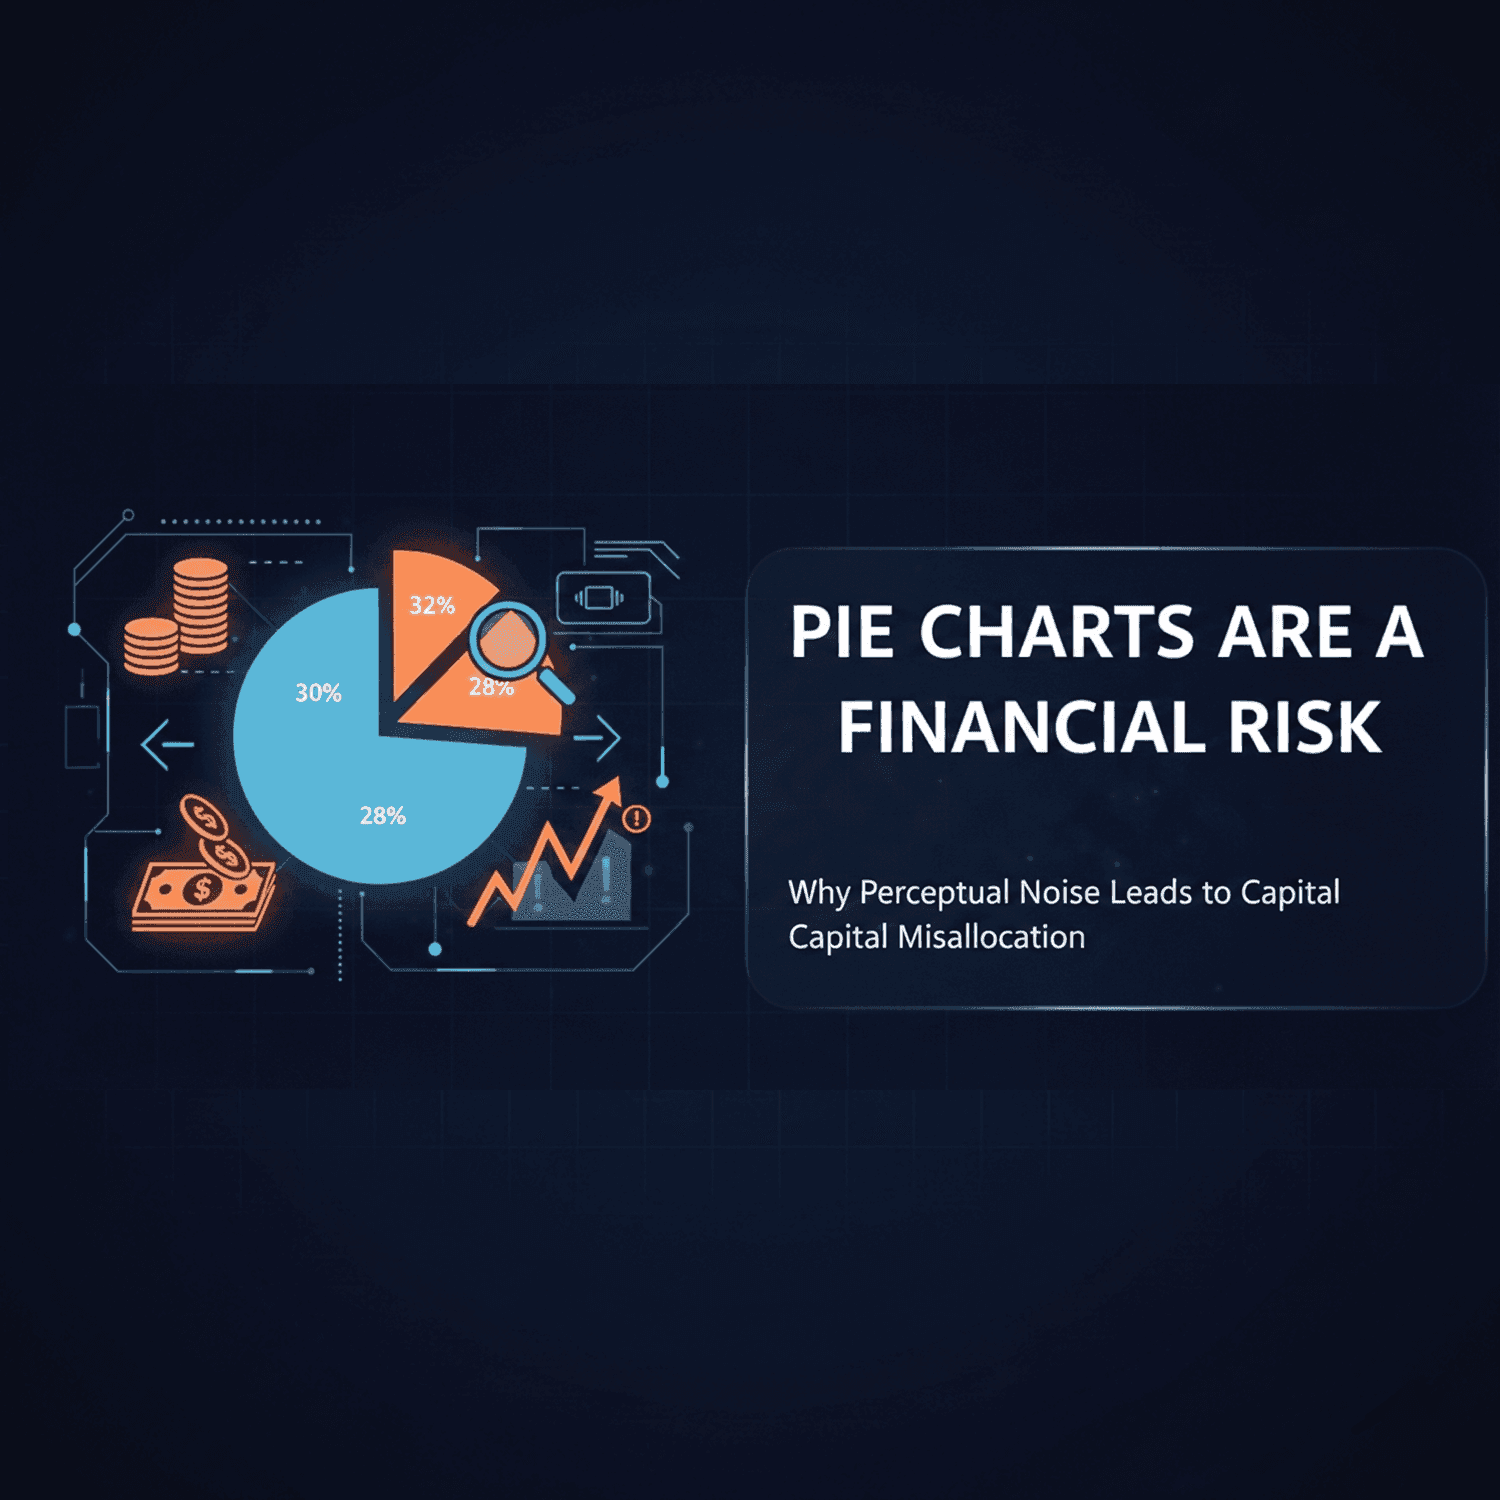
Are pie charts bad? For close shares, yes: readers misjudge angles. See the same data as a pie and a bar chart, and four rules for when a pie is safe.
7 Min. Lesezeit