

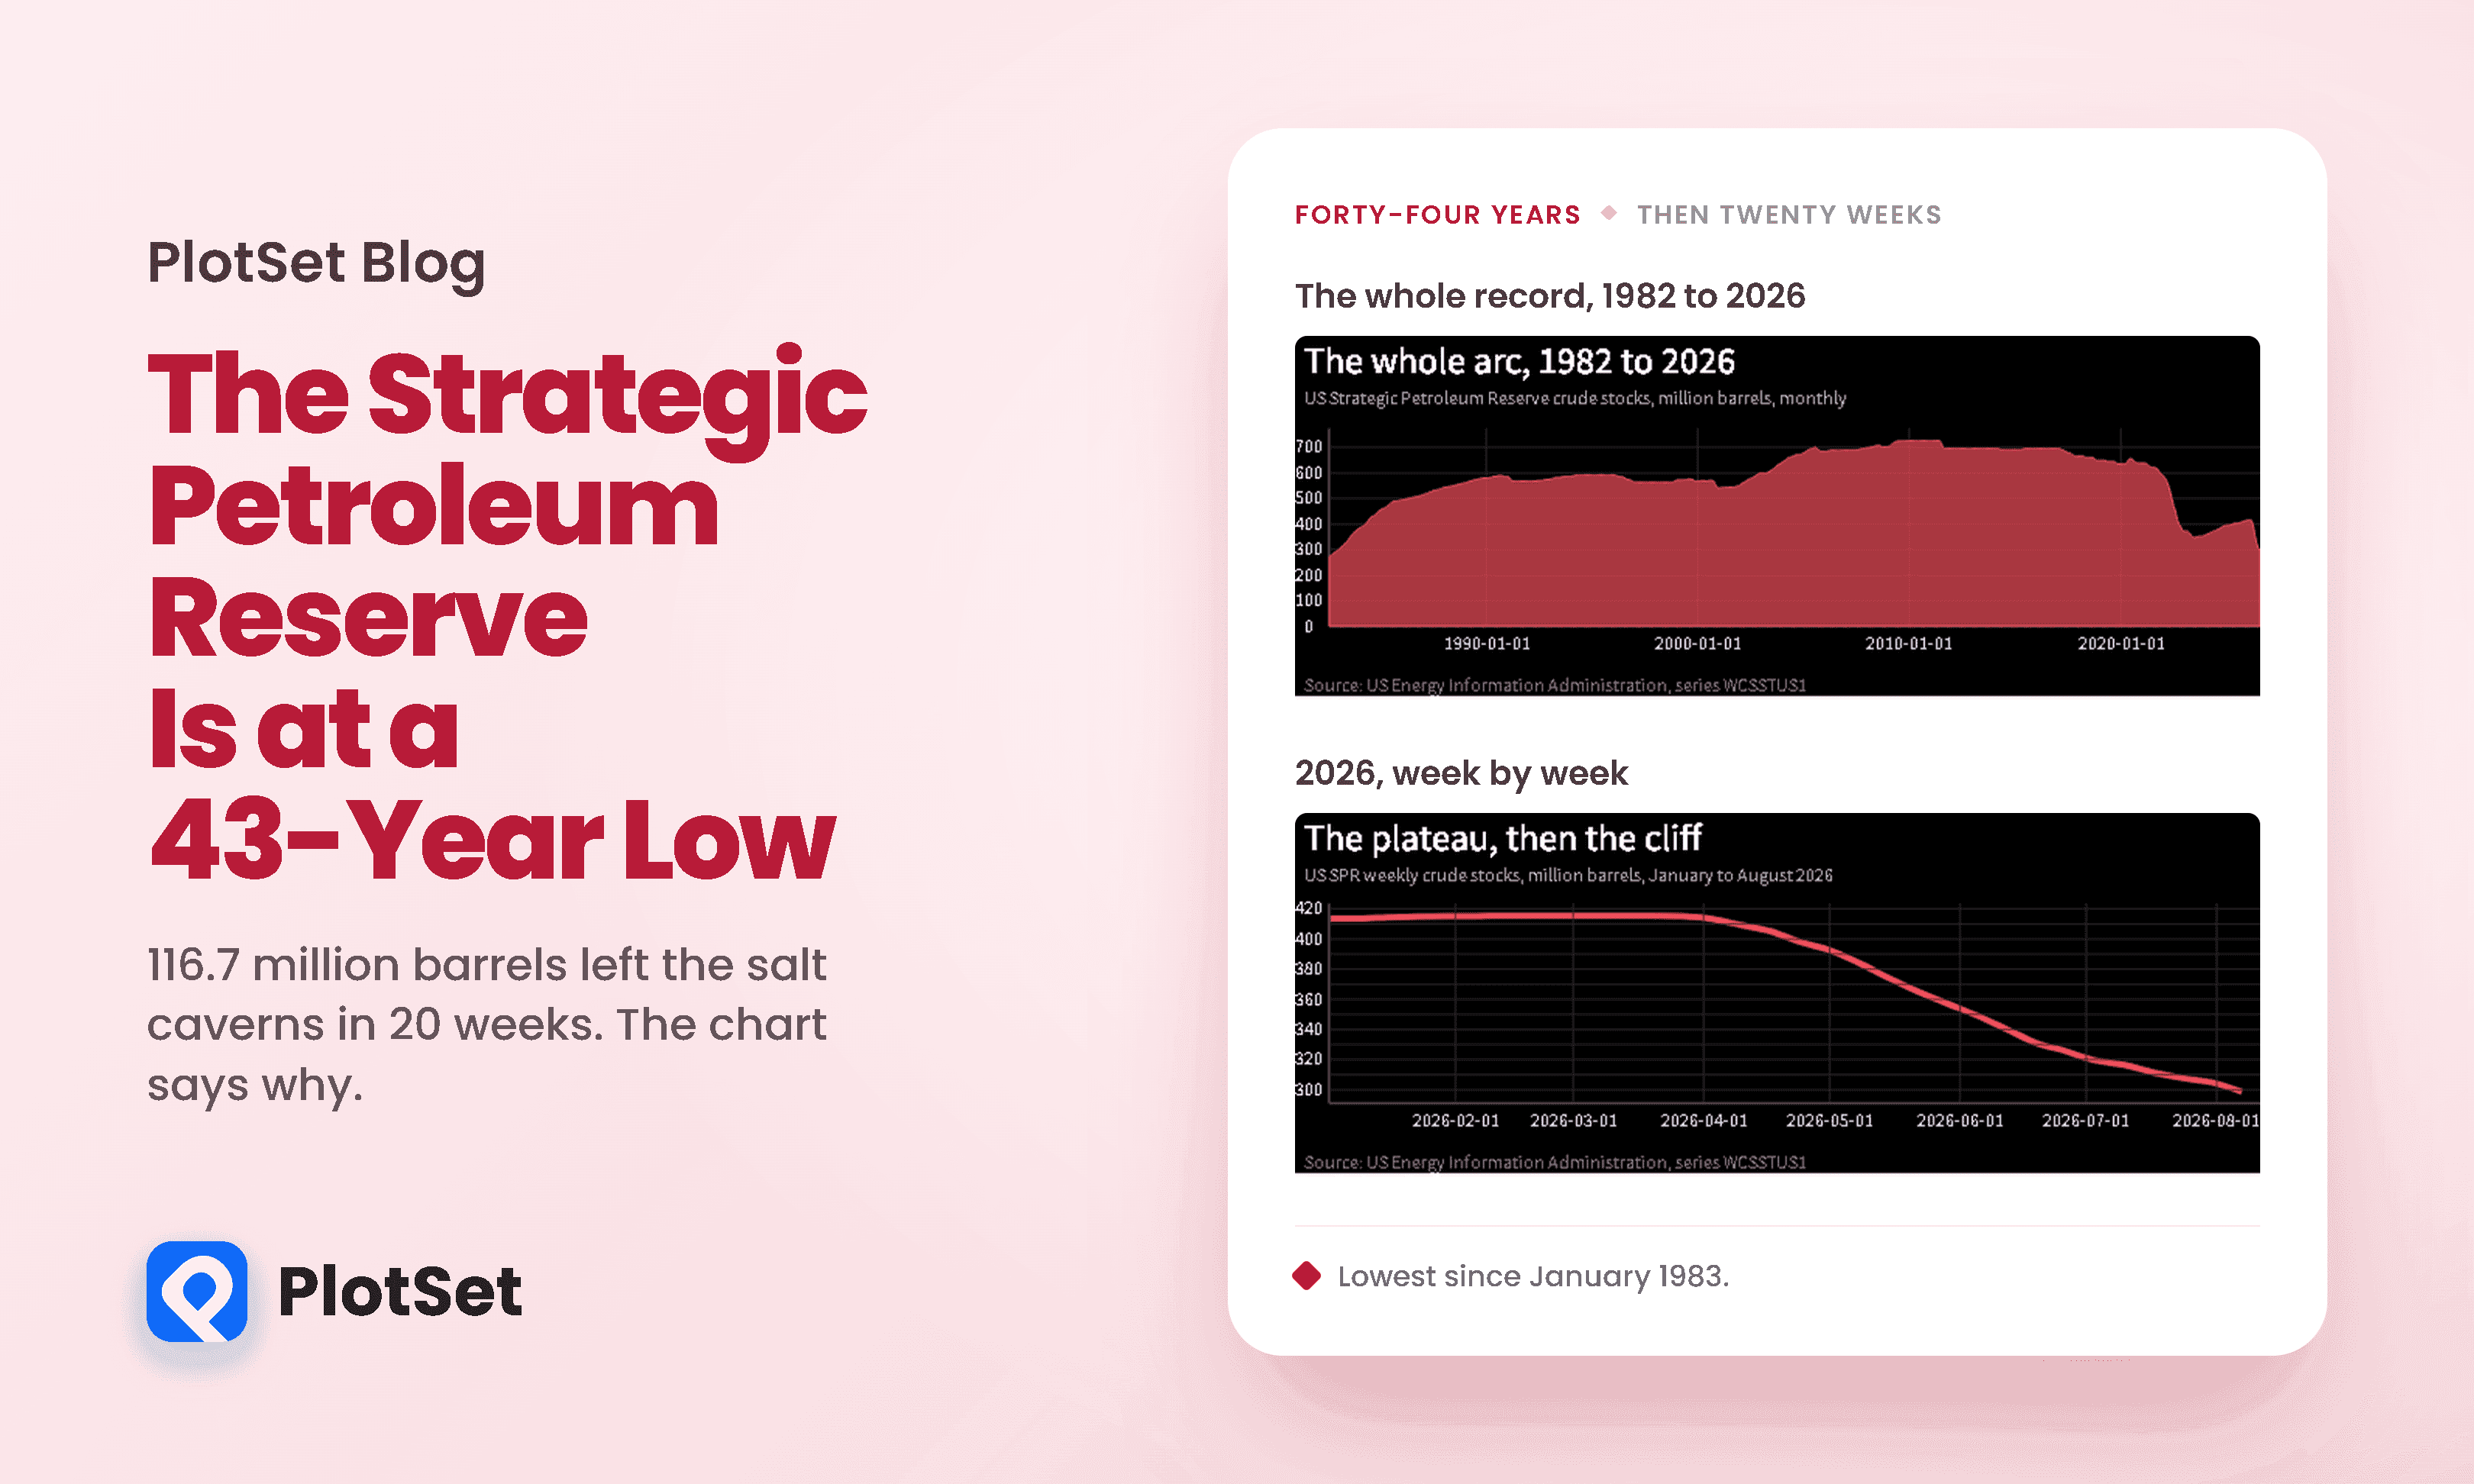
For six straight weeks in early 2026, the United States strategic petroleum reserve did not move. Week after week the Energy Information Administration published the same figure to within a rounding error, about 415.4 million barrels, while a war closed the most important oil passage on earth. Then in the week ending 27 March it fell, and it has fallen every week since.
On 7 August the reserve held 298.694 million barrels. The last time it was that low, Ronald Reagan was in his first term and the reserve was still being filled for the first time. That was January 1983.
That is the headline. Three findings sit underneath it that the headline does not carry: the pause before the fall was procurement rather than indecision, the claim that this is the fastest drawdown ever depends entirely on how long a window you measure, and the number everyone is quoting overstates how much oil the United States could actually get out of the ground in a hurry.
Here is the whole 44-year arc, animated. It is worth watching to the end, because the shape of the last few seconds is the story.
What the strategic petroleum reserve actually is
Most people picture a bank account. It is not. The strategic petroleum reserve is physical crude oil sitting in 60 caverns that were dissolved out of natural salt domes, 2,000 to 4,000 feet underground, at four sites on the Gulf Coast: Bryan Mound and Big Hill in Texas, West Hackberry and Bayou Choctaw in Louisiana. A typical cavern is roughly 200 feet across and 2,500 feet tall and holds about 10 million barrels.
The number is barrels, not dollars. When the reserve falls by 9.9 million in a week, that is 9.9 million physical barrels leaving a salt cavern and entering the market by pipeline. The Department of Energy puts the average price paid for the oil down there at $29.70 a barrel, against a total programme investment of about $25.7 billion.
President Ford signed it into existence on 22 December 1975, in the Energy Policy and Conservation Act, written in the aftermath of the 1973 Arab oil embargo. The statute set a policy target of up to a billion barrels. Design capacity today is 714 million. At 298.7 million the reserve is 41.8 percent full.
What happened at the strait
The war began on 28 February 2026, when US and Israeli strikes hit Iran. Within two days traffic through the Strait of Hormuz had collapsed to almost nothing.
It is tempting to write that Iran closed the strait on a particular date. It is worth resisting, because Iran closed it repeatedly and each time meant something different. Search the crisis and several different closure dates come back, each of them sourced, each describing a real announcement.
The geography explains why any of this matters. The strait is 21 to 22 miles across at its narrowest, and even that carries an ambiguity worth naming: the EIA and the Congressional Research Service differ on whether those are statute or nautical miles, a gap of about 15 percent in the real width. Both agree on the part that counts, which is that the shipping lanes are only two miles wide in each direction, separated by a two mile buffer.
Through that gap, in a normal year, passes roughly 20 million barrels of oil a day. Two different percentages get quoted for this and they are not interchangeable. It is about 20 percent of global petroleum liquids consumption, and roughly a quarter of total global maritime traded oil. The denominators differ by more than 25 million barrels a day, so the sentence is only meaningful with one of them attached. Gas is a third statistic again, not part of either: over 20 percent of global LNG trade, which is not the same thing as 20 percent of the world's gas. Most of this is not headed for the United States. In 2024, 84 percent of the crude and condensate leaving Hormuz went to Asian markets, with China, India, Japan and South Korea taking 69 percent between them.
Traffic has not recovered. Lloyd's List Intelligence counted 78 transits in the week of 3 to 9 August, down from 95 the week before, which is roughly 11 ships a day. Comparing that to normal is harder than it looks, and we are not going to put a number on the ratio. The trackers count different things, some restricting themselves to cargo vessels above a size threshold and others counting every hull, and published pre-war baselines vary widely enough that the choice of tracker moves the answer more than the war does. The weekly counts are also preliminary and get revised upward as late signals arrive: the week before this one was first published as 84 transits and has since been restated as 95.
The pause was paperwork, not hesitation
The obvious story is that the reserve sat frozen for about four weeks while Washington decided what to do. The exact count depends on which closure date you pick, which is reason enough to distrust it: 27 days from the first strikes, 25 from the IRGC's public confirmation. The real story is duller, better documented, and does not depend on that choice at all. On 11 March 2026 the Department of Energy published the order: 32 member nations of the International Energy Agency agreed a coordinated release, and the President authorised DOE to put 172 million barrels into the market, beginning the following week, over approximately 120 days. The IEA confirmed the collective action on 19 March at 426 million barrels, with the US share at 172.2 million, all of it from public stocks.
DOE also publishes how long the machinery takes: 13 days from a presidential decision to oil reaching the market, the time needed to run the sale, award contracts and arrange transport.
Add 13 days to 11 March and you get 24 March. The first weekly decline lands in the week ending 27 March, a week that runs from 21 to 27 March. The reserve was not hesitating. It was being contracted for.
That is an inference, not a proof. The EIA week is seven days wide, so the fit is good to within the resolution of the data rather than to the day, and nothing in the weekly series can distinguish a delivery schedule from a coincidence. What makes it more than a coincidence is that the volume, the start date and the 120 day duration were all published in advance, and the reserve then fell for 20 consecutive weeks.
Twenty weeks, 116.7 million barrels
From the last week of the plateau, 20 March, to 7 August, the reserve lost 116.748 million barrels in 20 weeks. That is 5.837 million barrels a week, or 833,914 barrels every day for 140 days.
The reserve reported exactly 415,442 thousand barrels in three consecutive weeks, ending 6, 13 and 20 March. Date the peak to the first of those and the drawdown is 22 weeks. Date it to the last, which is the week the fall actually began, and it is 20. Both are defensible. Only one is the length of the decline.
The weekly shape is not uniform, and the variation is the most interesting thing in the series.
That 15 May reading is a record. Going back through all 2,289 weekly observations in the series, the largest single-week decline before this year was 8.414 million barrels, in the week ending 9 September 2022. Five weeks in 2026 beat it. In fact the five steepest weeks in the entire 44-year record all fall between 8 May and 19 June 2026.
The comparison that reframes it
Three drawdowns are famous: the Desert Storm sale in 1991, Hurricane Katrina in 2005, and the coordinated Libya release in 2011. Measured on the reserve's own inventory, from each episode's peak to its trough, they removed 21.1, 16.8 and 30.6 million barrels.
On the full record they are barely visible. The chart below is the same month-end series as the video, live rather than animated, so you can hover any month and read it off.
Those three took about 68.5 million barrels out of the caverns between them. The 2026 drawdown has taken 116.7 million in 20 weeks, and it is not finished.
Before that comparison is pushed too far, one warning that applies to every number in this field. Announced is not delivered. In 1991 the United States announced 33.75 million barrels and sold 17.3, about half, because DOE refused bids it judged too low. In 2005 it offered 30 million and awarded 11.0, alongside a separate 9.8 million barrel exchange that was repaid in full by 2007, which is why DOE's own headline for Katrina is 20.8 million. In 2011, by contrast, deliveries slightly exceeded the announcement, and in 2022 the full 180 million barrels announced were delivered. The direction of the gap is not even consistent, which is why every chart here measures the reserve's actual inventory rather than press releases.
Inventory has its own quirk, and it cuts the other way. Because it captures everything leaving the caverns, the 21.1 million barrel fall around Desert Storm includes a separate 3.9 million barrel readiness test sale completed in December 1990, before the emergency authorisation existed. Count only what was delivered under the emergency orders and those three episodes come to about 58.9 million barrels rather than 68.5. Both numbers are real. They answer different questions, and neither should be quoted without saying which.
One thing stands out immediately when the episodes are lined up: 2026 is falling from a much lower starting point. Katrina began from a reserve holding 700.5 million barrels. The 2026 drawdown began from 415.4 million, because the reserve never fully recovered from 2022. How fast each one fell is a harder question, and the next section is about why.
"Fastest ever" depends on how long you measure
We wanted to write that 2026 is the fastest sustained drawdown in the history of the series. It is not that simple, and the reason is worth more than the headline would have been.
Measure the steepest decline over any window up to about four months and 2026 wins. Stretch the window past five months and the 2021 to 2023 drawdown wins. The crossover sits between 17 and 22 weeks, and at 17 weeks the two are separated by 0.33 million barrels a week, which is less than a rounding error on a single week's reading. Measuring in weeks rather than months matters here: months are 28 or 35 days long in a weekly series, so a month-based window quietly compares unequal periods.
Part of that is simply that 2026 has not been running as long. Line the episodes up on their own starting months rather than on the calendar and 2026 pulls clear from the second month on: 89.8 million barrels gone at four months, against 9.9 million for the 2021 to 2023 drawdown at the same age.
The alignment is doing work of its own, and it is worth saying where. Month zero for 2026 is February, the last month-end on the plateau, so its first elapsed month is three flat weeks plus one small decline and registers only 0.4 million. At month one 2026 is fourth of the five, behind Katrina, Desert Storm and the 2021 to 2023 drawdown. It is from month two that nothing else is close. Note also that this chart tracks the whole 2021 to 2023 decline, whose clock starts in June 2021, while the bar chart above dates the 2022 release to March 2022. They are two different questions about the same era, which is why they carry different names.
There is one more way to see how unusual this is. Across 528 month-end changes since 1982, the reserve fell in 185 of them, about one month in three. May 2026 is the single steepest month in the entire 44-year record, at 40.8 million barrels. Four of the twelve steepest months on record are in 2026, seven are in 2022, and the twelfth is August 2011, the Libya release.
The line eases, but do not credit the memorandum
On 17 June, after mediation led by Pakistan, the United States and Iran agreed a 14 point memorandum named for the Islamabad talks. The signatures were not collected there: Trump signed at Versailles on 17 June and Pezeshkian in Tehran the following day. It is routinely described as reopening the strait toll free. The text does not say that. Point four commits the US to "fully end the naval blockade within 30 days"; point five commits Iran to make "its best efforts for the safe passage of commercial vessels with no charge for 60 days only". A best efforts clause and a temporary charge holiday, not a reopening. Neither government released a copy of the document.
The pace did change. Whether the memorandum changed it is a different question.
The drain eased by a quarter within three weeks of the memorandum. What it did not do is snap back when the deal failed. Trump declared the ceasefire over on 8 July, the US reinstated the naval blockade on 14 July, and the pace did not visibly re-accelerate: 4.90 million barrels a week before, 4.45 after. That particular gap is not evidence of anything. It rests on three observations against four, against a week to week spread of well over a million barrels, so the honest reading is that nothing detectable happened rather than that the drain slowed further. Only the final week in the series, ending 7 August, jumps back to 6.115 million.
That is a real limit on how much the chart can tell you, and there is a second one. The programme announced on 11 March was to take about 120 days, which put its end around 9 July. The reserve was still falling four weeks after that, and only about two thirds of the announced 172 million barrels had left the caverns by 7 August. Whatever the weekly line is tracking in late summer, it is not a schedule that finished on time.
What this does not tell us
The reserve is not about to run out, and the arithmetic that says otherwise is unstable. Extrapolating the current pace to zero gives an exhaustion date of June 2027 on a 13 week lookback, November 2027 on a 4 or 26 week lookback, and June 2029 on a 52 week lookback. That is a two year spread from one dataset, and the spread is entirely an artefact of which recent window you pick. It also assumes a refill never happens, when the reserve was refilled once already, from 346.8 million barrels in July 2023 to 415.4 million by early 2026.
More to the point, most of these barrels are contractually coming back. DOE structured the 2026 tranches as exchanges rather than sales, issuing requests for up to 86 million barrels in March and a further 10 million in April. An exchange is a loan: the refiner returns the crude later, with premium barrels on top, so the reserve ends up ahead in volume. DOE said at the time that it had arranged to replace roughly 200 million barrels within a year, about 20 percent more than it was drawing down. A straight line to zero treats a loan as a sale, and the announced programme was in any case projected to leave the reserve near 243 million barrels when it completed.
The headline inventory overstates what is usable. This is the finding that deserves more attention than the 43 year low. The famous maximum drawdown rate of 4.4 million barrels a day is a design specification from 1996, not a current capability. In a report published this year, the Government Accountability Office found effective drawdown capability at 2.700 of 4.415 million barrels a day, about 61 percent, as of December 2025. Big Hill, one of the four sites, was assessed at zero drawdown capability, offline for construction. More than a quarter of the reserve's inventory was not available for drawdown at all. Separate 2023 assessments found more than 70 percent of the wells at Big Hill had moderate to severe casing deformation, with the cause not fully understood.
Nobody outside DOE knows where the floor is. There is no published minimum operating level. A DOE spokesperson has put the level needed to manage the caverns safely at about 70 million barrels, roughly 10 percent of capacity. Brookings has estimated about 150 million. Those two public estimates differ by more than a factor of two. There is a separate statutory floor of 252 million barrels that blocks limited drawdowns, though not emergency ones, and the reserve is now 46.7 million barrels above it.
And these are stocks, not flows. Every figure here is how much oil was in storage on a given date, not how much was consumed that week.
How we did this
Every chart in this piece is built from one public file: EIA series WCSSTUS1, 2,289 weekly observations going back to 20 August 1982, cross checked between the agency's HTML tables and its XLS download, which agree digit for digit. Nothing else is plotted. The facts around the charts are separately sourced: release volumes and mechanisms from Department of Energy and International Energy Agency statements, drawdown capability from the Government Accountability Office, chokepoint volumes from the EIA and CSIS, and vessel counts from Lloyd's List Intelligence. Where we computed something ourselves, such as the window crossover or the monthly distribution, the charts say so on their source line rather than crediting the EIA for our arithmetic.
Why we built it in PlotSet
A series like this one is a good test of a charting tool, because it breaks the usual assumptions. It is long, 44 years at weekly resolution. Its most important feature is a flat stretch, and flat stretches are exactly what most chart defaults smooth away. And the argument depends on measurement choices, the window length and the peak date, which means the tool has to let you rebuild the same chart five ways quickly enough that you actually check.
Two things did the heavy lifting here. The first is the video chart at the top. A 44 year series has a shape that a still image struggles to convey, because the reader sees the ending before they have seen the climb. Animating it in PlotSet puts the 2010 peak and the 2026 collapse in the order they happened, with event markers arriving on their own dates, and it exports as a file you can drop into an article or a social post without a player, a plugin or a live connection. The second is that every static chart here is a live embed rather than a screenshot, so the underlying numbers travel with the article and a reader can hover any week.
What we would not claim is that any of this settles the argument. The most useful chart in this piece is the one that shows 2026 winning at four months and losing at five, and that chart exists because the tool made it cheap to ask the question a second way. A chart that changes its answer when you change the window is not a broken chart. It is the most honest thing in the article, and the reason to build the second version before publishing the first.
Every chart in this piece comes from a single public file. You can build your own version of any of them at plotset.com.
References
- US Energy Information Administration. Weekly U.S. Ending Stocks of Crude Oil in SPR, series WCSSTUS1. The weekly inventory series behind every chart in this article.
- US Energy Information Administration. WCSSTUS1 weekly series, XLS download. The machine readable version, cross checked digit for digit against the HTML table.
- US Department of Energy. United States to Release 172 Million Barrels of Oil. The 11 March 2026 authorisation, the release volume and the 120 day delivery window.
- US Department of Energy. Energy Department Initiates Strategic Petroleum Reserve Exchange. The first tranche RFP that put the release into contract.
- US Department of Energy. Energy Department Initiates Additional Strategic Petroleum Reserve Exchange. The additional emergency exchange issued on 1 April 2026.
- International Energy Agency. IEA confirms member country contributions to collective action. The 19 March 2026 confirmation of the 426 million barrel collective action and the 172.2 million barrel US share.
- US Department of Energy. SPR Quick Facts. Design capacity, current fill, average acquisition price and total programme investment.
- US Department of Energy. SPR Storage Sites. The four Gulf Coast sites, cavern counts and site capacities.
- US Department of Energy. Strategic Petroleum Reserve. The 13 day interval from presidential decision to oil reaching the market, and the drawdown mechanisms.
- US Department of Energy. SPR Origins. The 1975 statute, the embargo that prompted it and the billion barrel policy target.
- US Government Publishing Office. Energy Policy and Conservation Act, Public Law 94-163. The statute itself, signed 22 December 1975.
- US Department of Energy. History of SPR Releases. Announced and delivered volumes for the 1991, 2005, 2011 and 2022 drawdowns.
- US Department of Energy. SPR Sales and Exchanges. The distinction between a sale, an exchange and a congressionally mandated sale.
- US Government Accountability Office. Strategic Petroleum Reserve readiness report GAO-26-106918. Effective drawdown capability at 61 percent of design, Big Hill offline, and the share of inventory not available for drawdown.
- US Government Accountability Office. Does the U.S. have a long term plan for the Strategic Petroleum Reserve?. The readiness findings in plainer language, including cavern and well integrity.
- Congressional Research Service. The Strait of Hormuz: Security Developments and Impacts, report R45281. The 22 nautical mile width, the lane geometry and the share of maritime oil trade.
- US Energy Information Administration. World Oil Transit Chokepoints. Hormuz transit volumes and the two different denominators for the percentage.
- US Energy Information Administration. Oil flows through the Strait of Hormuz. The 20 million barrels a day figure and its destination breakdown.
- US Energy Information Administration. The Strait of Hormuz shipping lanes. The 21 mile width and the two mile lanes with a two mile buffer.
- CSIS. The Strait of Hormuz in 8 Charts. Chokepoint context and the concentration of flows into Asian markets.
- Brookings Institution. From chokepoint to crisis: the Strait of Hormuz and global oil markets. The estimate of a structural minimum operating level near 150 million barrels.
- Agence France-Presse via South China Morning Post. Iran says Hormuz closed for shipping to and from enemy ports. The verbatim wording of the 27 March IRGC declaration.
- Al Jazeera. What the Trump Iran 14 point plan says. The text of points four and five of the Islamabad Memorandum.
- Al Jazeera. Trump says ceasefire over after US Iran strikes. The 8 July collapse of the agreement.
- Al Jazeera. Iran shuts Hormuz strait, but wasn't it already closed?. The sequence of serial closure declarations and why no single date works.
- The Washington Post. US and Israel launch strikes on Iran. The 28 February start of the campaign.
- Lloyd's List Intelligence. Strait of Hormuz brief. The weekly vessel transit counts and the note that preliminary counts are revised upward.


