To choose the right chart for your data, start with the question you want the chart to answer, not with the chart you already know how to make. A ranking, a trend, a share of a total, a relationship and a place each have a chart that shows them best, and a few have charts that quietly mislead. Here is how to match one to the other.
Which chart should I use for my data?
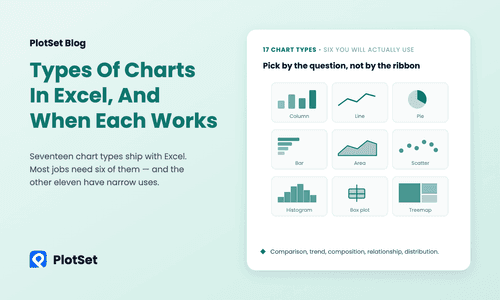
Pick the chart by the question: a bar chart to compare or rank categories, a line chart for change over time, a pie or stacked bar for parts of a whole, a scatter plot for two related numbers, a histogram for a distribution, and a map when place is the point. If two fit, take the simpler.
| Your question | Reach for | Why |
|---|---|---|
| Which is biggest? How do categories compare? | Bar chart | Length is the easiest thing for the eye to compare |
| How did it change over time? | Line chart or area chart | A line shows direction and turning points |
| What share of the whole is each part? | Pie chart, donut or stacked bar chart | Parts are drawn against a total |
| Do two numbers move together? | Scatter plot | Each point is one case, so patterns and outliers show |
| How are the values spread out? | Histogram or box plot | Shows the shape, not just the average |
| Where is it high or low? | Choropleth map | Place carries the pattern |
Compare and rank: use a bar chart
When the job is to compare categories, a bar chart is the safe default. The eye reads length along a common baseline more accurately than it reads angle or area, which is why ranked bars beat pies once you have more than a handful of categories. Put the labels on the vertical axis when they are words, and sort the bars by value unless the categories have a natural order, such as months.
The chart below ranks the 27 EU member states by the share of their energy that came from renewable sources in 2024. Sweden leads at 62.8%, Finland follows at 52.1%, and Belgium is last at 14.3%, against an EU average of 25.2%. Nobody needs a legend to read it, and the sorted order answers "who is first?" before you reach for a number.
Building one takes a table of two columns. The guide to creating a bar chart shows each step in the editor.
Show change over time: use a line chart
Time has a direction, and a line chart keeps it. Use one when the horizontal axis is a date or a year and you care about the shape of the path: rising, falling, flat or jumpy. Add more lines to compare a few series, but past five or six they tangle, and small multiples work better. Choose an area chart only when the size of the total matters, and a column chart when there are few time points and each deserves its own bar. For a walkthrough, see the line chart guide.
Show parts of a whole: pie, donut or stacked bar
Pie and donut charts work for one job: a few parts that add up to a meaningful total. If you have more than five or six slices, or the slices are close in size, switch to a bar chart. A stacked bar is the better choice when you want the same breakdown across several groups or years, because the segments share a baseline. A donut is a pie with a hole in it, so the same limits apply.
Show relationships and distributions
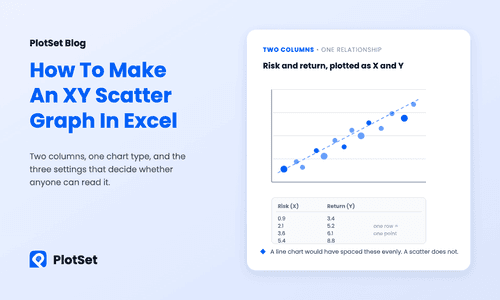
Two numeric columns that might be related belong on a scatter plot. Each point is one case, and the pattern of the points shows whether the relationship is positive, negative or absent, and which cases are outliers. A third variable can set the size or colour of the points. For one numeric column, show the spread rather than a single average: a histogram groups values into bins, and a box plot compresses the spread into a median, a range and outliers so that several groups sit side by side.
Show place: use a map, with a rate
If the question is "where?", a map answers it faster than any table, provided you map a rate or a share rather than a raw count. A count follows population, so a map of totals mostly shows where people live, as most maps only show you where people live explains. The map below uses the same Eurostat renewable-energy table as the bar chart above, shaded by country. The bar chart ranks, and the map shows the north-to-south pattern, with the Nordic countries and Iceland far ahead of a band of Belgium, Luxembourg, Ireland and Poland in the teens.
The same numbers, in two charts, answer two different questions. That is the habit worth building: decide which question matters, then pick the chart for that question.
A quick check before you publish
Before you share a chart, run through five questions:
- Can a reader state the point in one sentence? If not, the chart is trying to do two jobs.
- Is the comparison on a common baseline? Bars should start at zero.
- Are the categories ordered on purpose? Sort by value, or by a natural order, never by accident.
- Do the colours mean something? Use one or two hues for one measure, and a separate colour only when it marks a group.
- Are the title, the unit, the year and the source on the chart? A chart that gets copied into a slide should still make sense.
The Financial Times' Visual Vocabulary is a good one-page reference for matching the relationship in your data to a chart type. If you work in a spreadsheet, types of charts in Excel and when each one works maps the same choices onto Excel's chart menu. To build the chart from a sentence rather than by hand, connect an assistant through the PlotSet MCP server. The renewable-energy figures above come from Eurostat.
FAQ
How do I choose the right chart for my data?
Start from the question. Compare or rank categories with a bar chart, show change over time with a line chart, show parts of a whole with a pie or stacked bar, relate two numbers with a scatter plot, show a spread with a histogram, and show place with a map.
What is the best chart for comparing categories?
A bar chart. Bars share a baseline, so differences in length are easy to judge, and sorting the bars by value turns the chart into a ranking. Use horizontal bars when the labels are long.
When should I use a pie chart instead of a bar chart?
Use a pie chart only when a few parts, ideally five or fewer, add up to a meaningful whole and you want to show that share. For many categories, or values that are close together, a bar chart reads more accurately.
What is the best chart for showing change over time?
A line chart. It keeps the order of time and makes the direction and turning points visible. Use an area chart when the size of the total matters, and columns when there are only a few time points.
Which chart shows the relationship between two variables?
A scatter plot. Each point is one case, with one variable on each axis, so you can see whether the variables rise together, move apart or have no pattern, and spot outliers.
Can I make these charts for free?
Yes. PlotSet's free plan includes the full chart library, live embeds and PNG and SVG export. Upload a CSV, paste from a spreadsheet or link a Google Sheet, and publish.