
Cada gráfico aqui começou como uma planilha.
Mapas, bar chart races, treemaps, pictogramas e mais. Abra um e refaça com os seus dados.
 3D globeEntwicklung der CO2-Emissionen von 1960 bis 2023
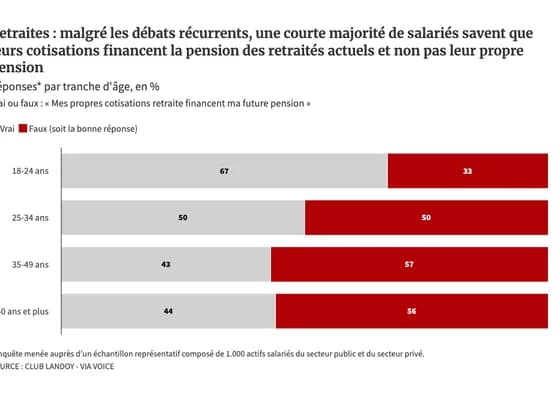 Line, bar and pie chartsRetraites : malgré les débats récurrents, une courte majorité de salariés savent que leurs…
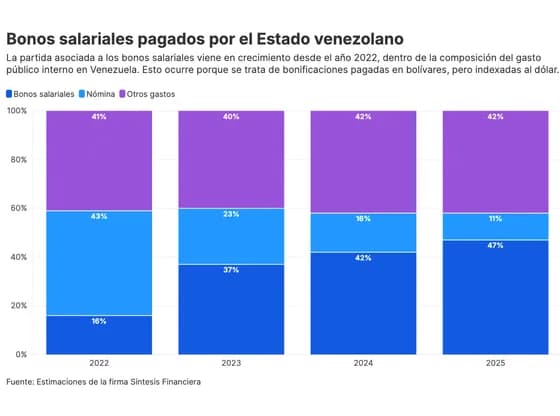 Line, bar and pie chartsBonos salariales pagados por el Estado venezolano
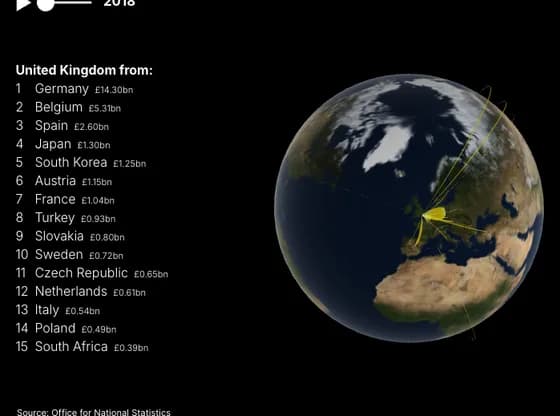 Connections and flow mapsThe dramatic rise of Chinese car imports to the UK
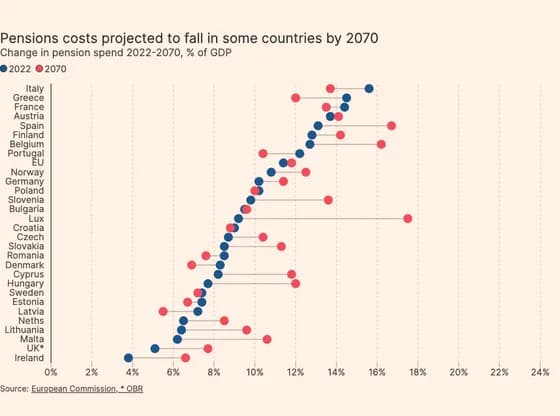 ScatterPensions costs projected to fall in some countries by 2070
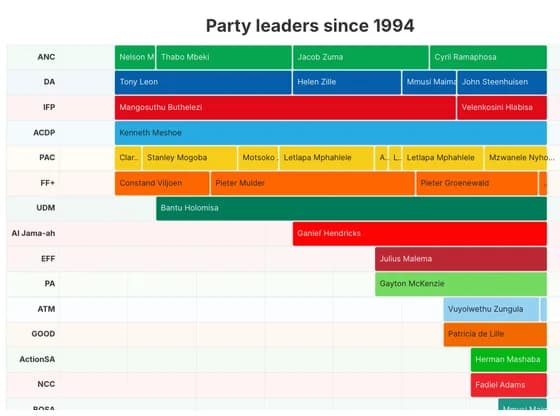 Gantt chartParty leaders since 1994
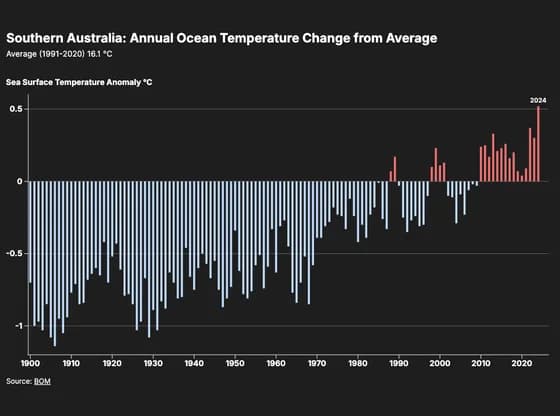 Line, bar and pie chartsSouthern Australia: Annual Ocean Temperature Change from Average
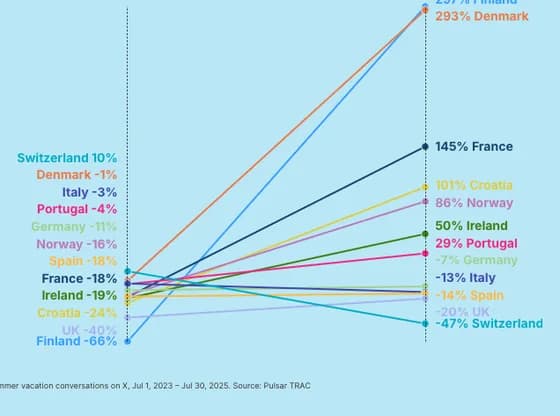 Slope chartCoolcations: Nordics emerge as the new Summer escape from the heat
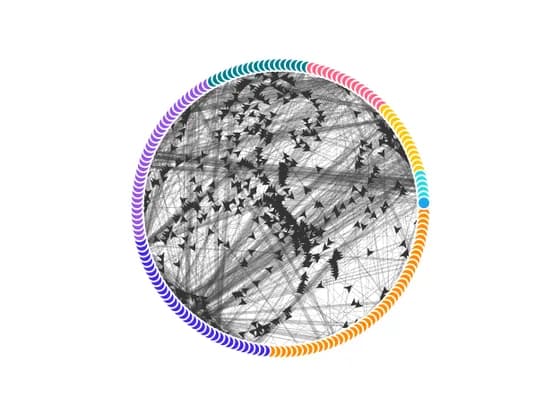 Network graphDegree Transition Network
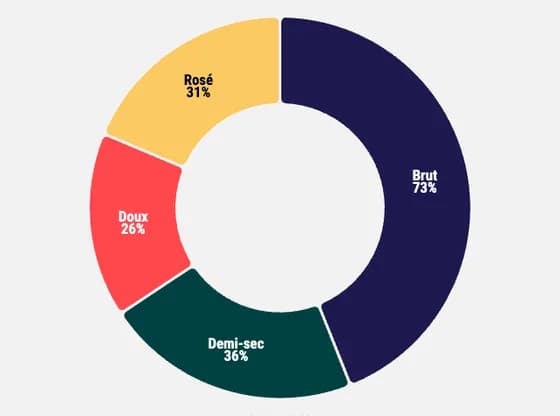 Line, bar and pie chartsConsommation par type de vin effervescent* en France
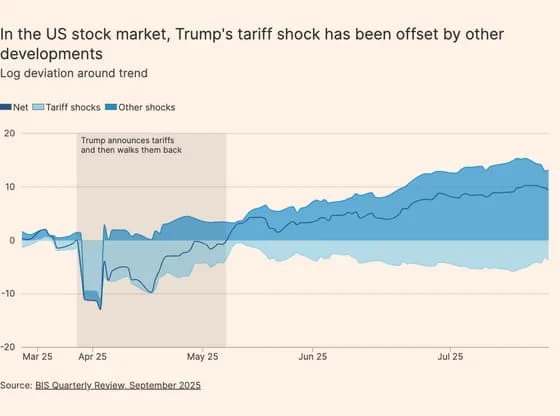 Line, bar and pie chartsIn the US stock market, Trump's tariff shock has been offset by other developments
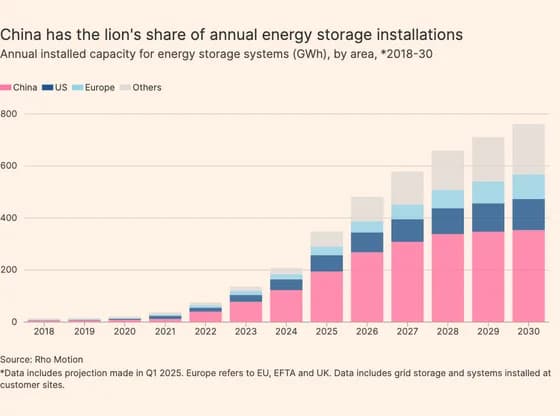 Line, bar and pie chartsChina has the lion's share of annual energy storage installations
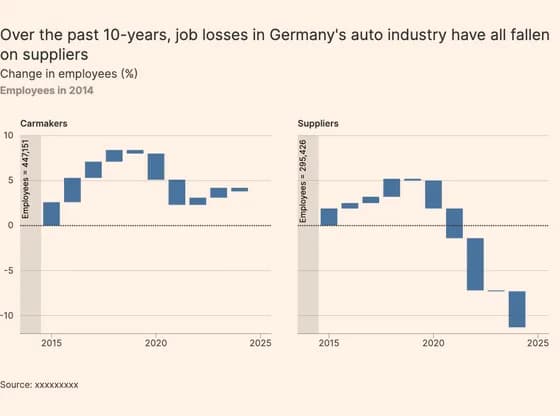 Line, bar and pie chartsOver the past 10-years, job losses in Germany's auto industry have all fallen on suppliers
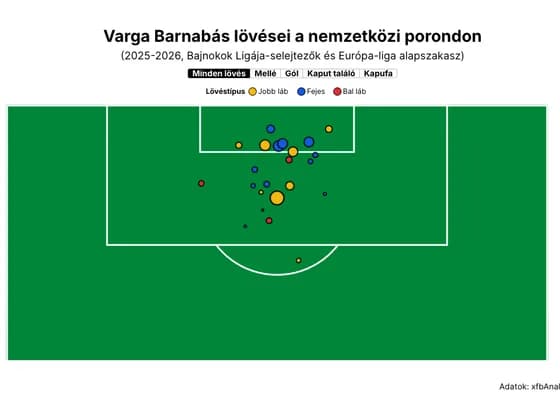 SportsVarga Barnabás lövései a nemzetközi porondon
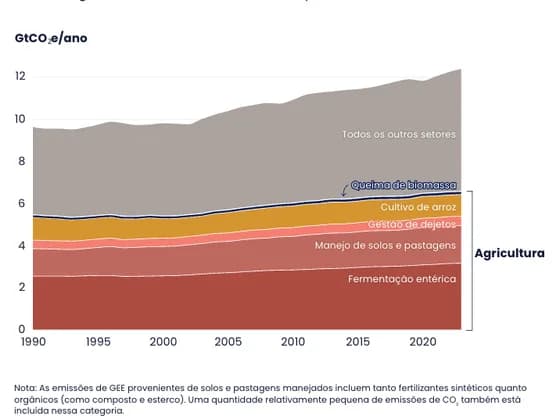 Interactive SVGA agricultura é responsável por mais da metade das emissões de metano e óxido nitroso
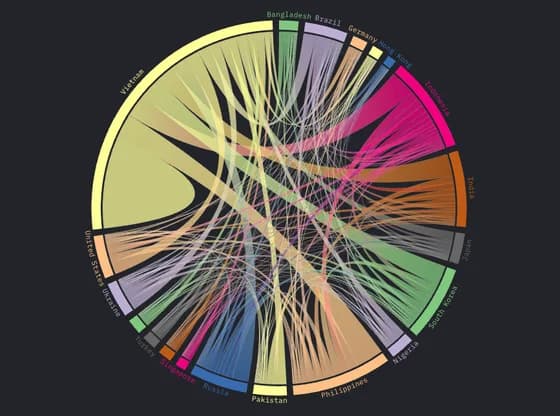 Network graphSentry Node Connection Chord Graph
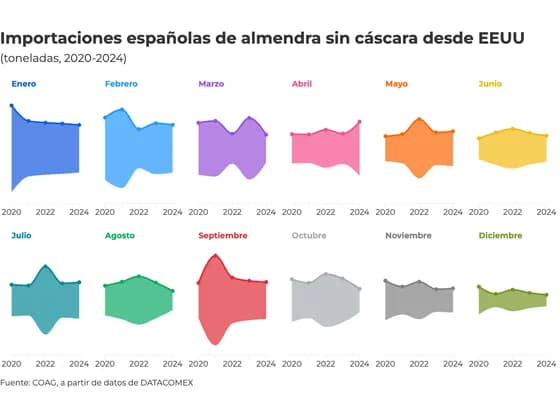 Line, bar and pie chartsImportaciones españolas de almendra sin cáscara desde EEUU
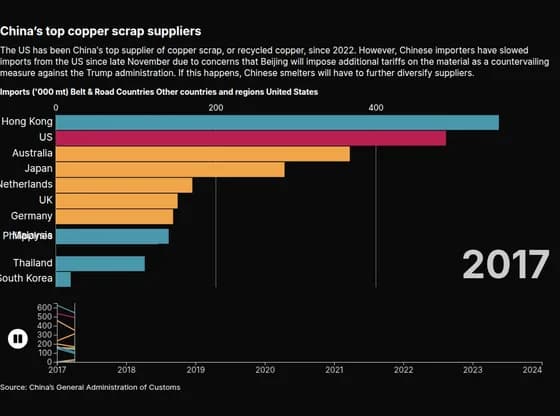 Animated chartsChina’s top copper scrap suppliers
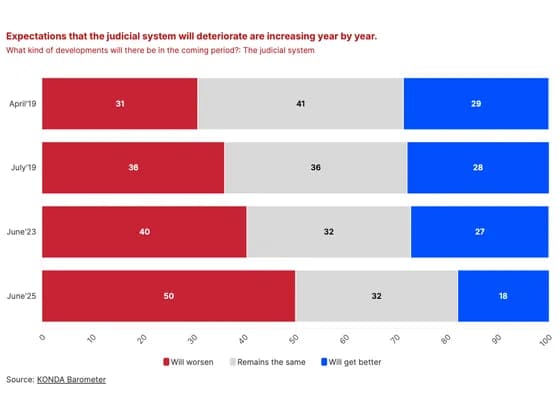 Line, bar and pie chartsExpectations that the judicial system will deteriorate are increasing year by year.
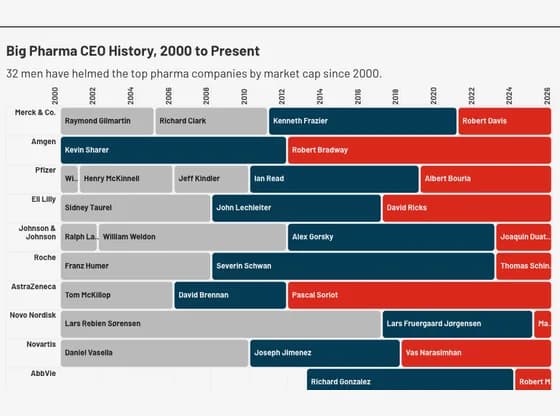 Gantt chartBig Pharma CEO History, 2000 to Present