
Cada gráfico aqui começou como uma planilha.
Mapas, bar chart races, treemaps, pictogramas e mais. Abra um e refaça com os seus dados.
 Interactive toolsThe bread supply chain, from mills to bakeries
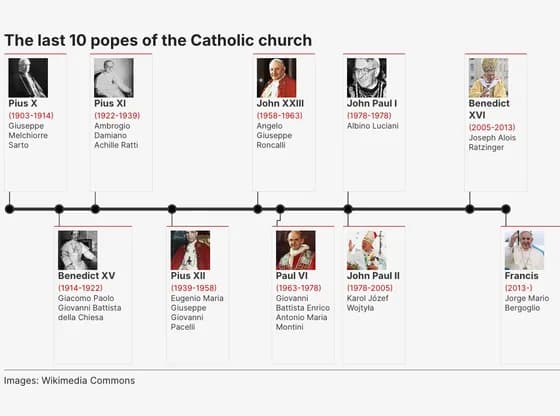 TimelineThe last 10 popes of the Catholic church
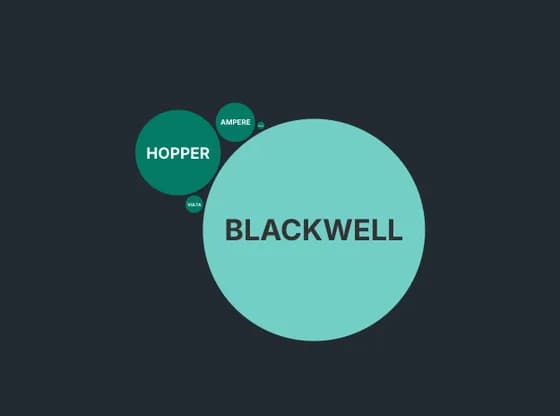 Distribution chartsNVIDIA'S AI CHIPS KEEP GETTING MORE POWERFUL
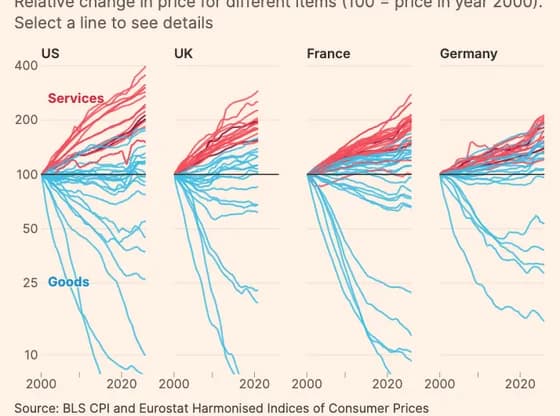 Line, bar and pie chartsCosts of labour-intensive services have soared in high-income countries, while tradable goods…
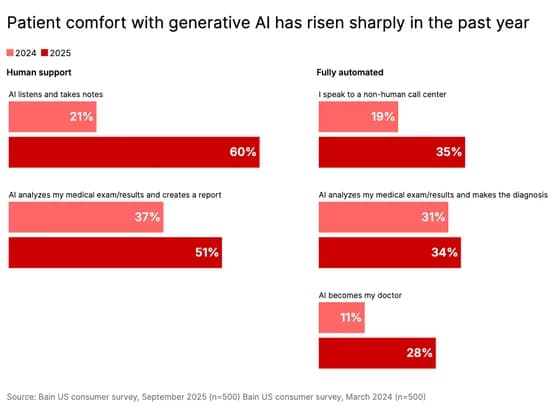 Line, bar and pie chartsPatient comfort with generative AI has risen sharply in the past year
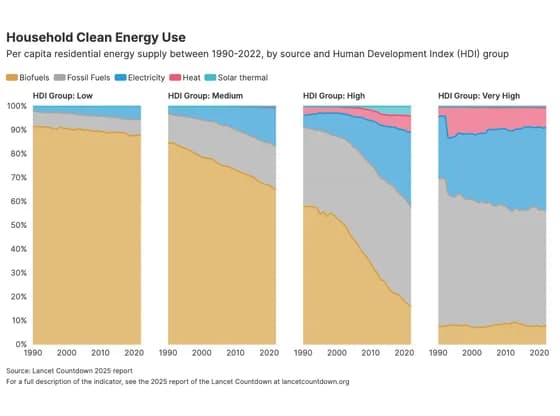 Line, bar and pie chartsHousehold Clean Energy Use
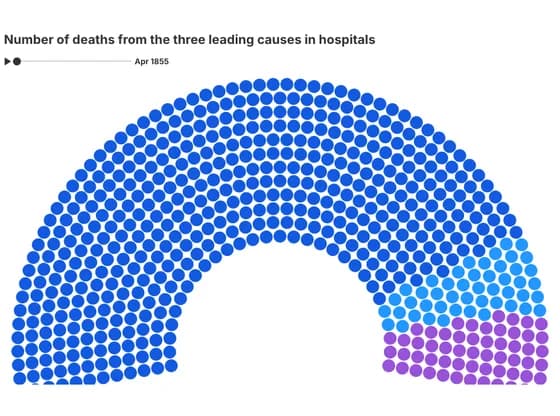 Elections and parliamentsNumber of deaths from the three leading causes in hospitals
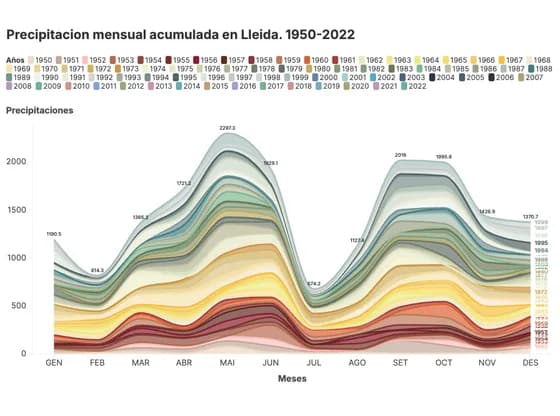 Line, bar and pie chartsPrecipitacion mensual acumulada en Lleida. 1950-2022
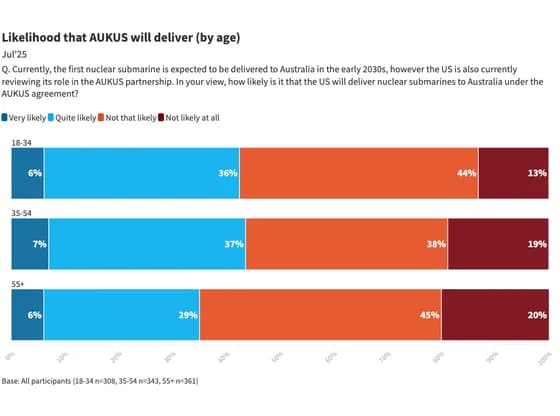 Line, bar and pie chartsLikelihood that AUKUS will deliver (by age)
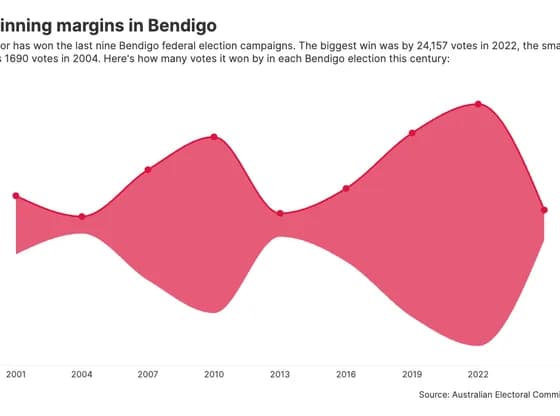 Line, bar and pie chartsWinning margins in Bendigo
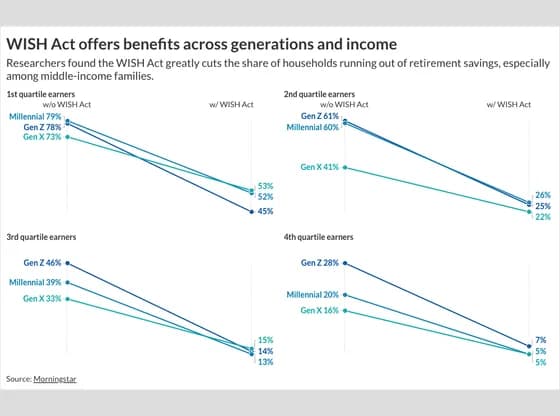 Slope chartWISH Act offers benefits across generations and income
 3D globeEntwicklung der CO2-Emissionen von 1960 bis 2023
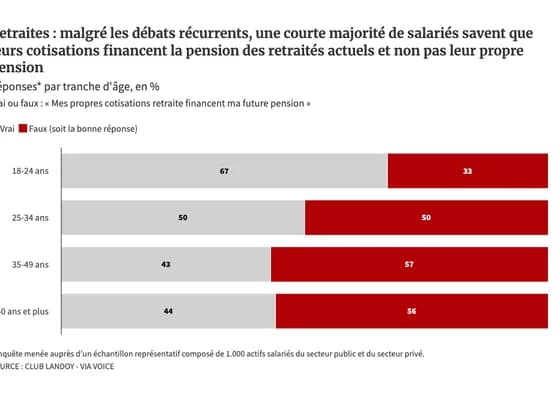 Line, bar and pie chartsRetraites : malgré les débats récurrents, une courte majorité de salariés savent que leurs…
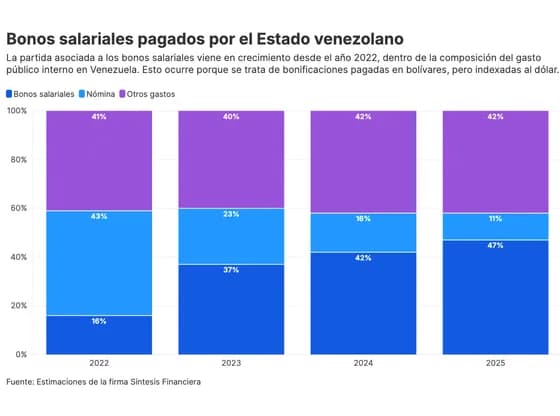 Line, bar and pie chartsBonos salariales pagados por el Estado venezolano
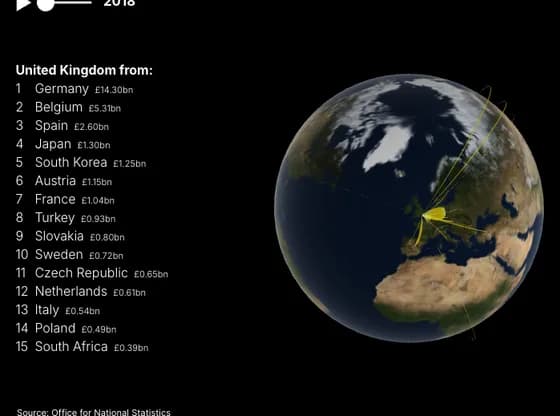 Connections and flow mapsThe dramatic rise of Chinese car imports to the UK
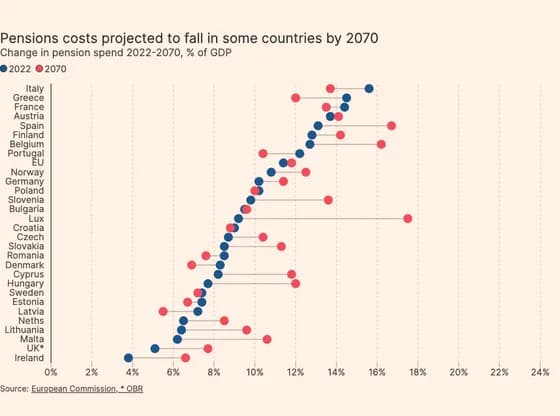 ScatterPensions costs projected to fall in some countries by 2070
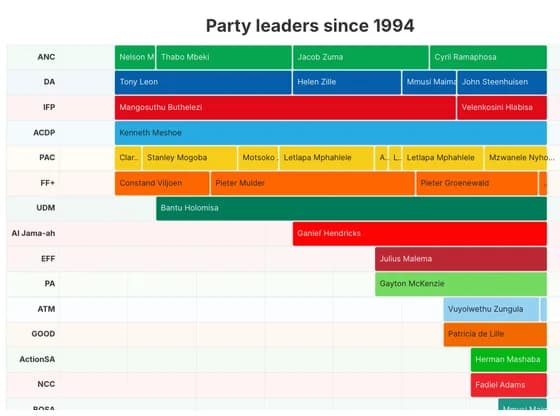 Gantt chartParty leaders since 1994
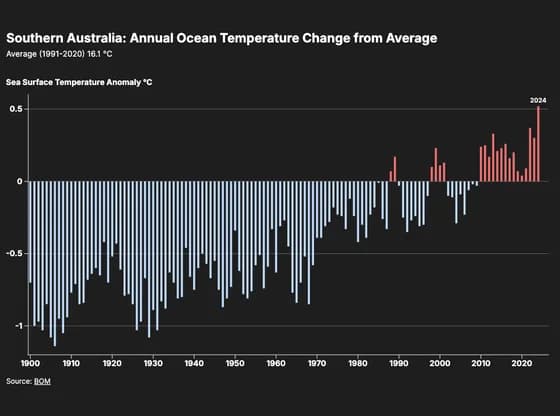 Line, bar and pie chartsSouthern Australia: Annual Ocean Temperature Change from Average
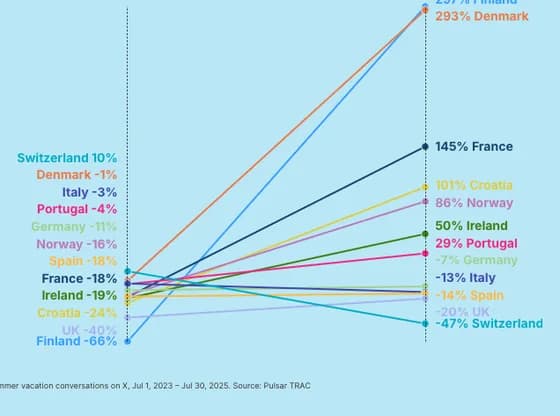 Slope chartCoolcations: Nordics emerge as the new Summer escape from the heat
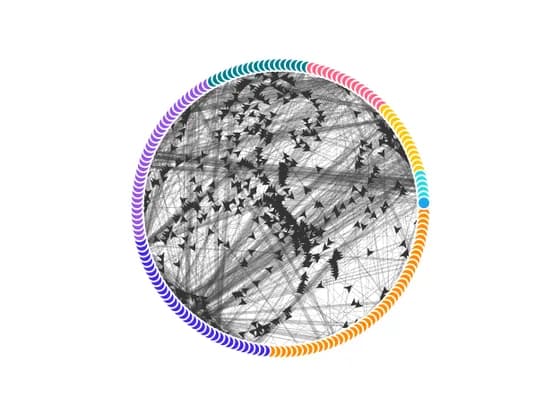 Network graphDegree Transition Network