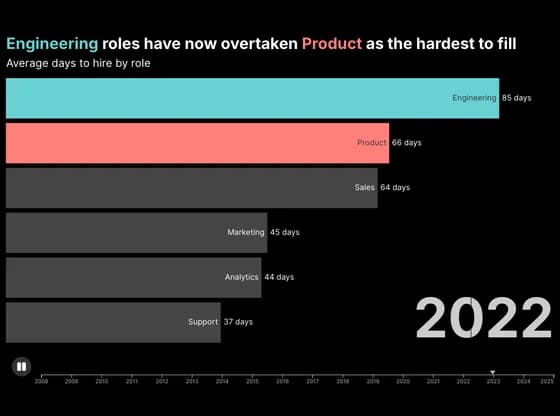
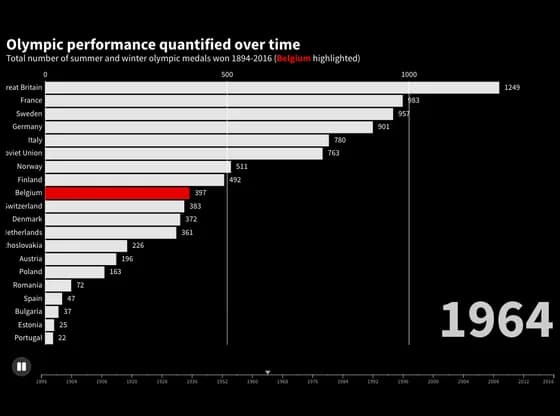
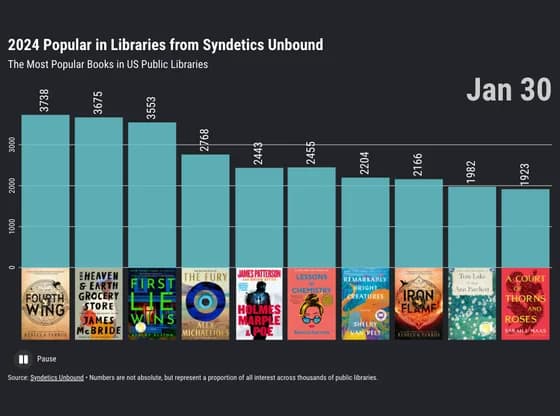
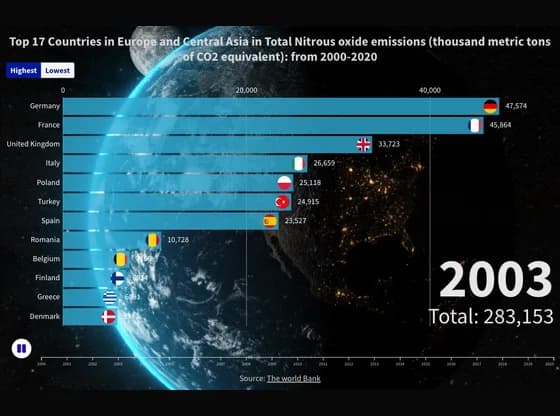
Cada gráfico aqui começou como uma planilha.
Mapas, bar chart races, treemaps, pictogramas e mais. Abra um e refaça com os seus dados.
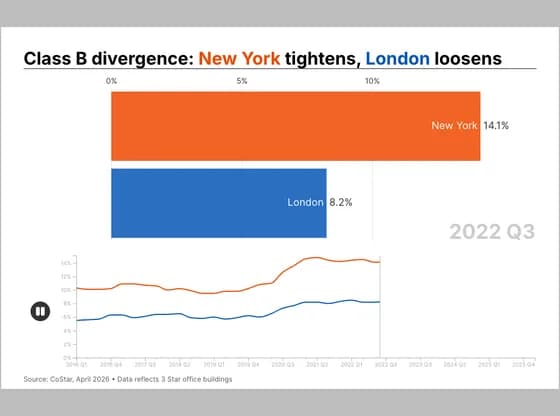 Animated chartsClass B divergence: New York tightens, London loosens
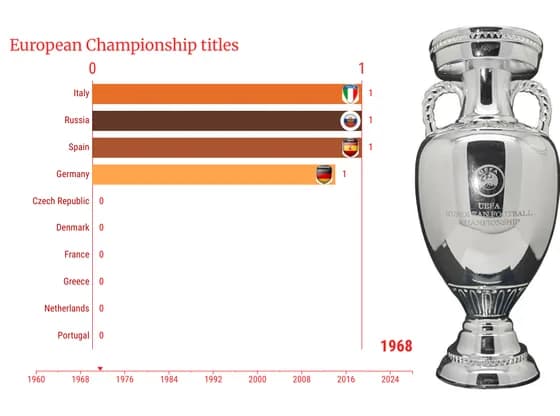 Animated chartsEuropean Championship titles
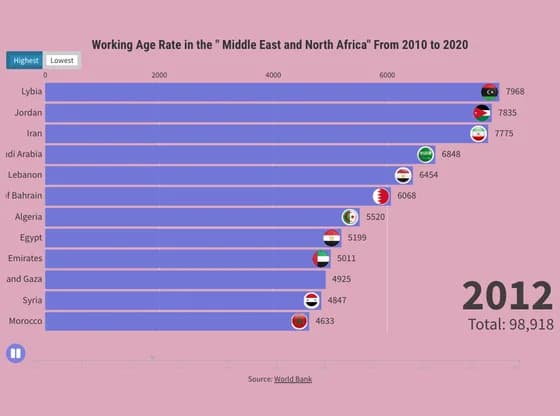 Animated chartsWorking Age Rate in the " Middle East and North Africa" From 2010 to 2020
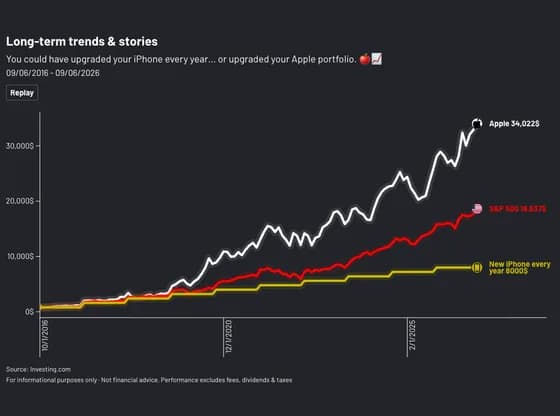
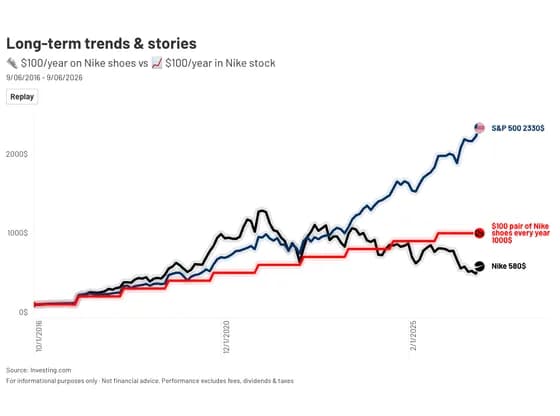 Animated chartsLong-term trends & stories
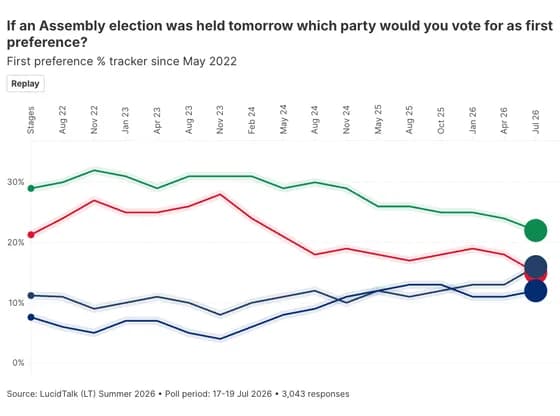 Animated chartsIf an Assembly election was held tomorrow which party would you vote for as first preference?
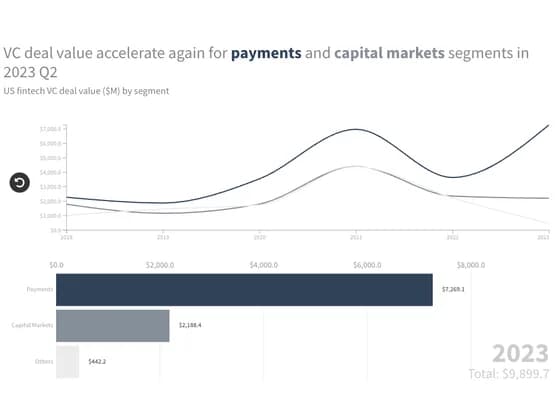 Animated chartsVC deal value accelerate again for payments and capital markets segments in 2023 Q2
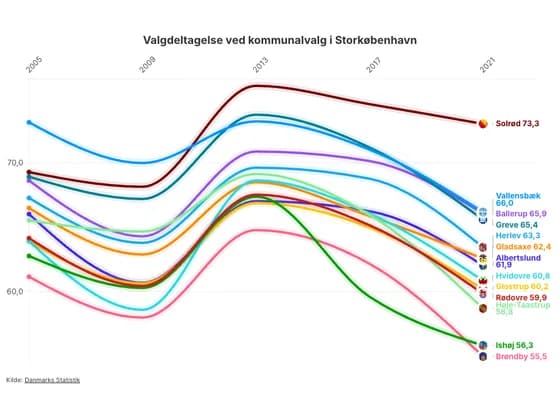 Animated chartsValgdeltagelse ved kommunalvalg i Storkøbenhavn
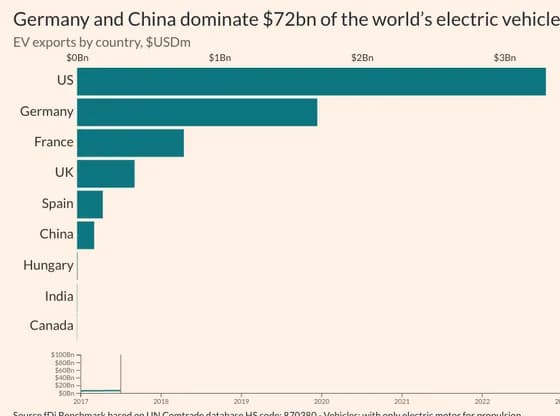 Animated chartsGermany and China dominate $72bn of the world’s electric vehicle exports
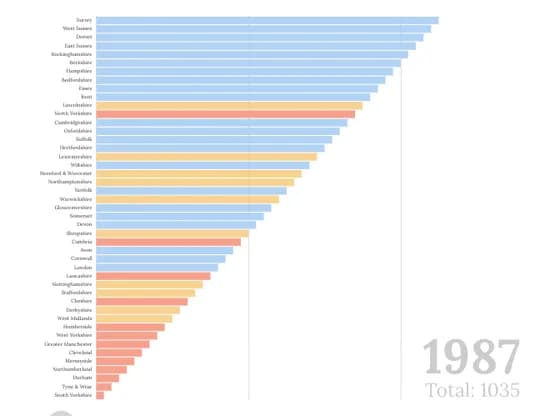 Animated chartsEnglish counties ranked by Conservative vote share
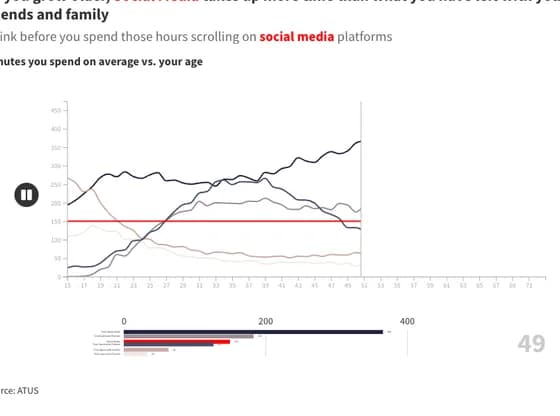 Animated chartsAs you grow older, Social Media takes up more time than what you have left with your friends and…
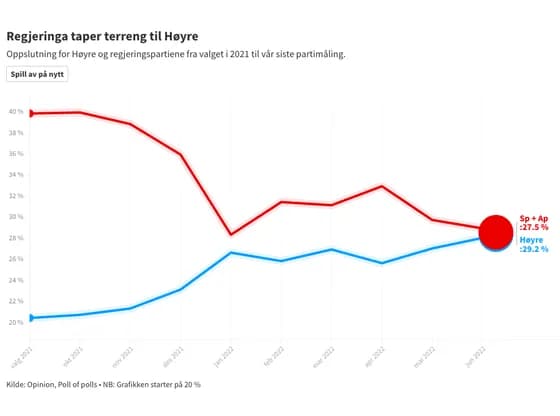 Animated chartsRegjeringa taper terreng til Høyre
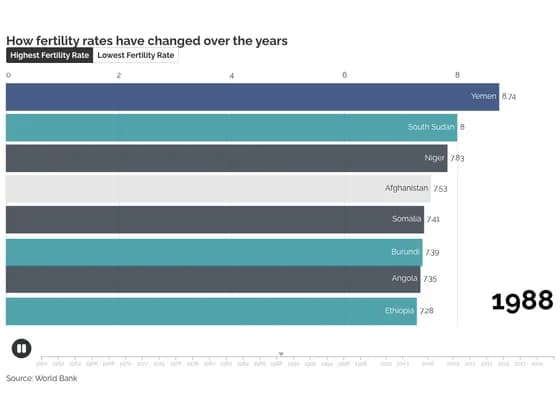 Animated chartsHow fertility rates have changed over the years
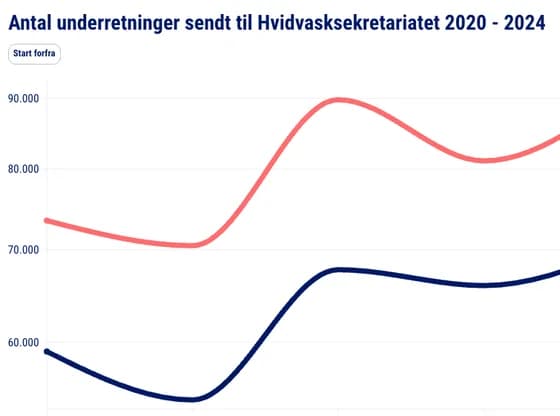 Animated chartsAntal underretninger sendt til Hvidvasksekretariatet 2020 - 2024
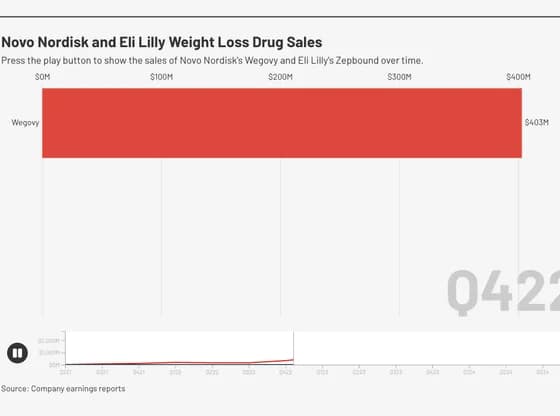 Animated chartsNovo Nordisk and Eli Lilly Weight Loss Drug Sales
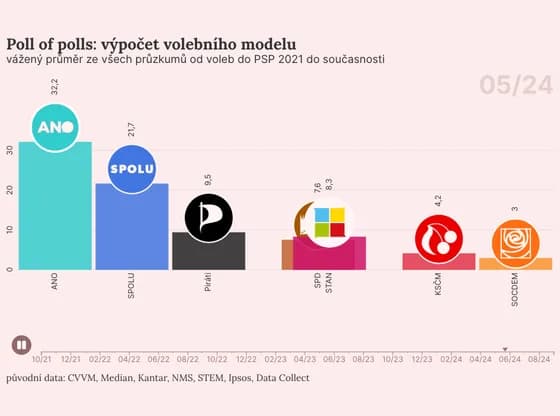 Animated chartsPoll of polls: výpočet volebního modelu
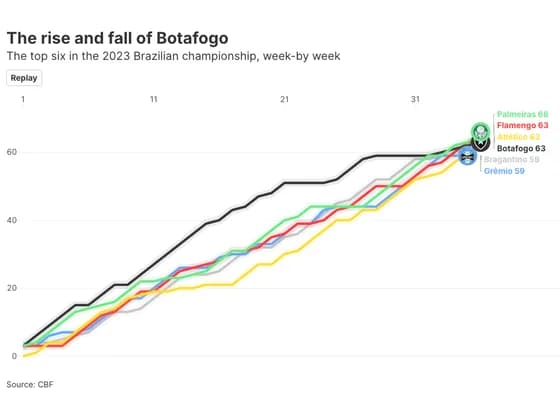 Animated chartsThe rise and fall of Botafogo
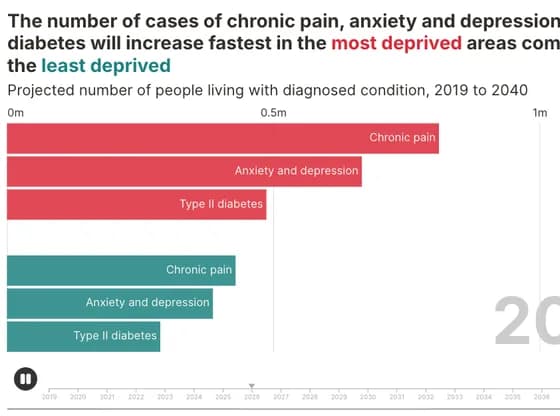 Animated chartsThe number of cases of chronic pain, anxiety and depression and diabetes will increase fastest…
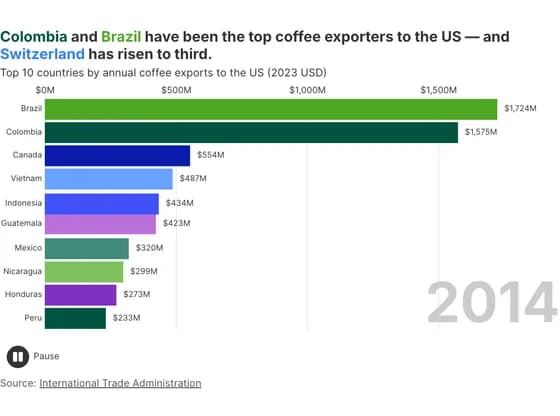 Animated chartsColombia and Brazil have been the top coffee exporters to the US — and Switzerland has risen to…
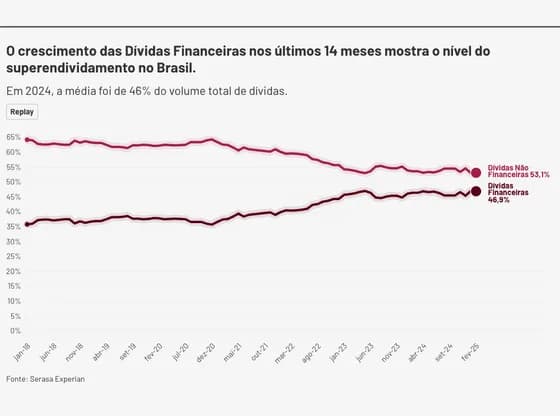 Animated chartsO crescimento das Dívidas Financeiras nos últimos 14 meses mostra o nível do superendividamento…
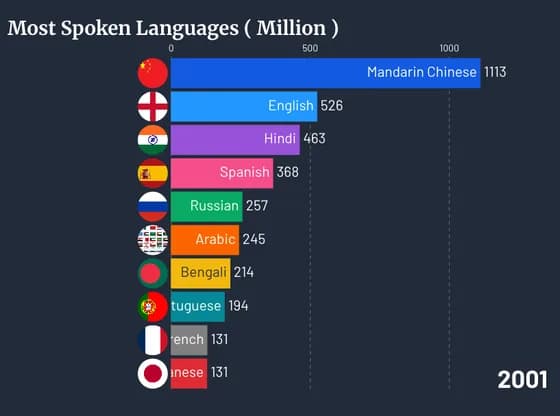
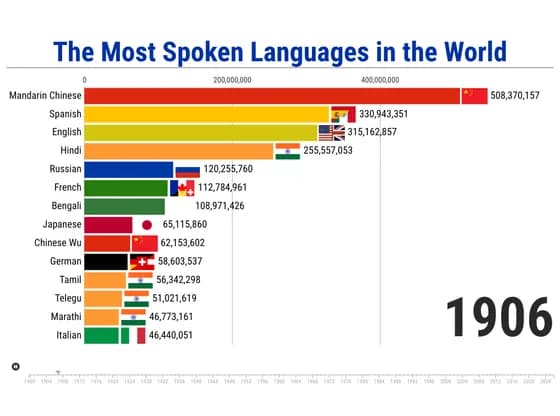 Animated chartsThe Most Spoken Languages in the World
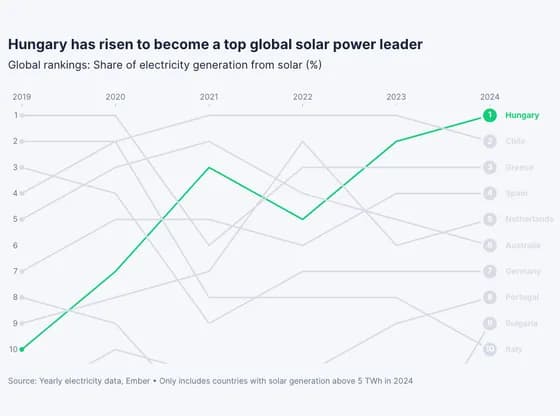 Animated chartsHungary has risen to become a top global solar power leader
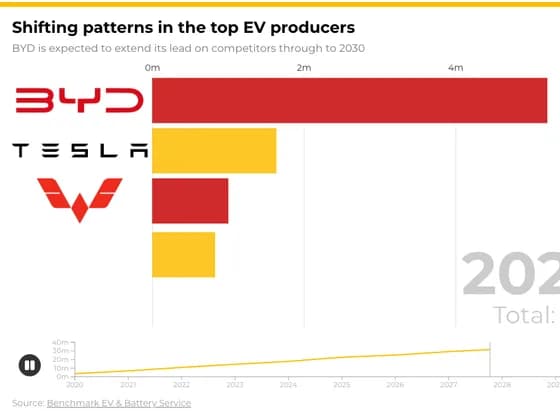 Animated chartsShifting patterns in the top EV producers