PlotSet LogoPlotSet

How to Create a Quiz

A step by step walkthrough for building a graded quiz in PlotSet, with slider and multiple choice questions, feedback on each answer and a result at the end.

About 10 minutes

You will end up with an embeddable quiz that grades each answer, shows feedback and closes with a result for the reader's score.

Expect about ten minutes. Most of it goes on writing the questions and feedback in the sheet.

The data you need

One sheet with one row per question, feedback line or result band, told apart by a type column.

Sample CSV
TypeQuestionInput typeCorrect answerMultiple choice optionsAnswer / PointsText
questionHow many planets are in our solar system?slider8
questionWhich planet is the hottest?multiple choiceVenusMercury :: Venus :: Mars
scoreWhich planet is the hottest?VenusCorrect!
result0-3Keep exploring.
Notes

The type column holds question, score or result. Leave it unbound and every row is a question.

A number is the answer for a slider. Exact text is the answer for a choice.

Separate multiple choice options with a double colon.

A score row names its question and the answer it answers. Write *-* for any answer.

A result band stops just before its upper number, so 0-3 and 3-5 do not overlap.

The steps

The exact click path in PlotSet, from a blank template to a finished chart.

  1. 01

    Open the Quiz template

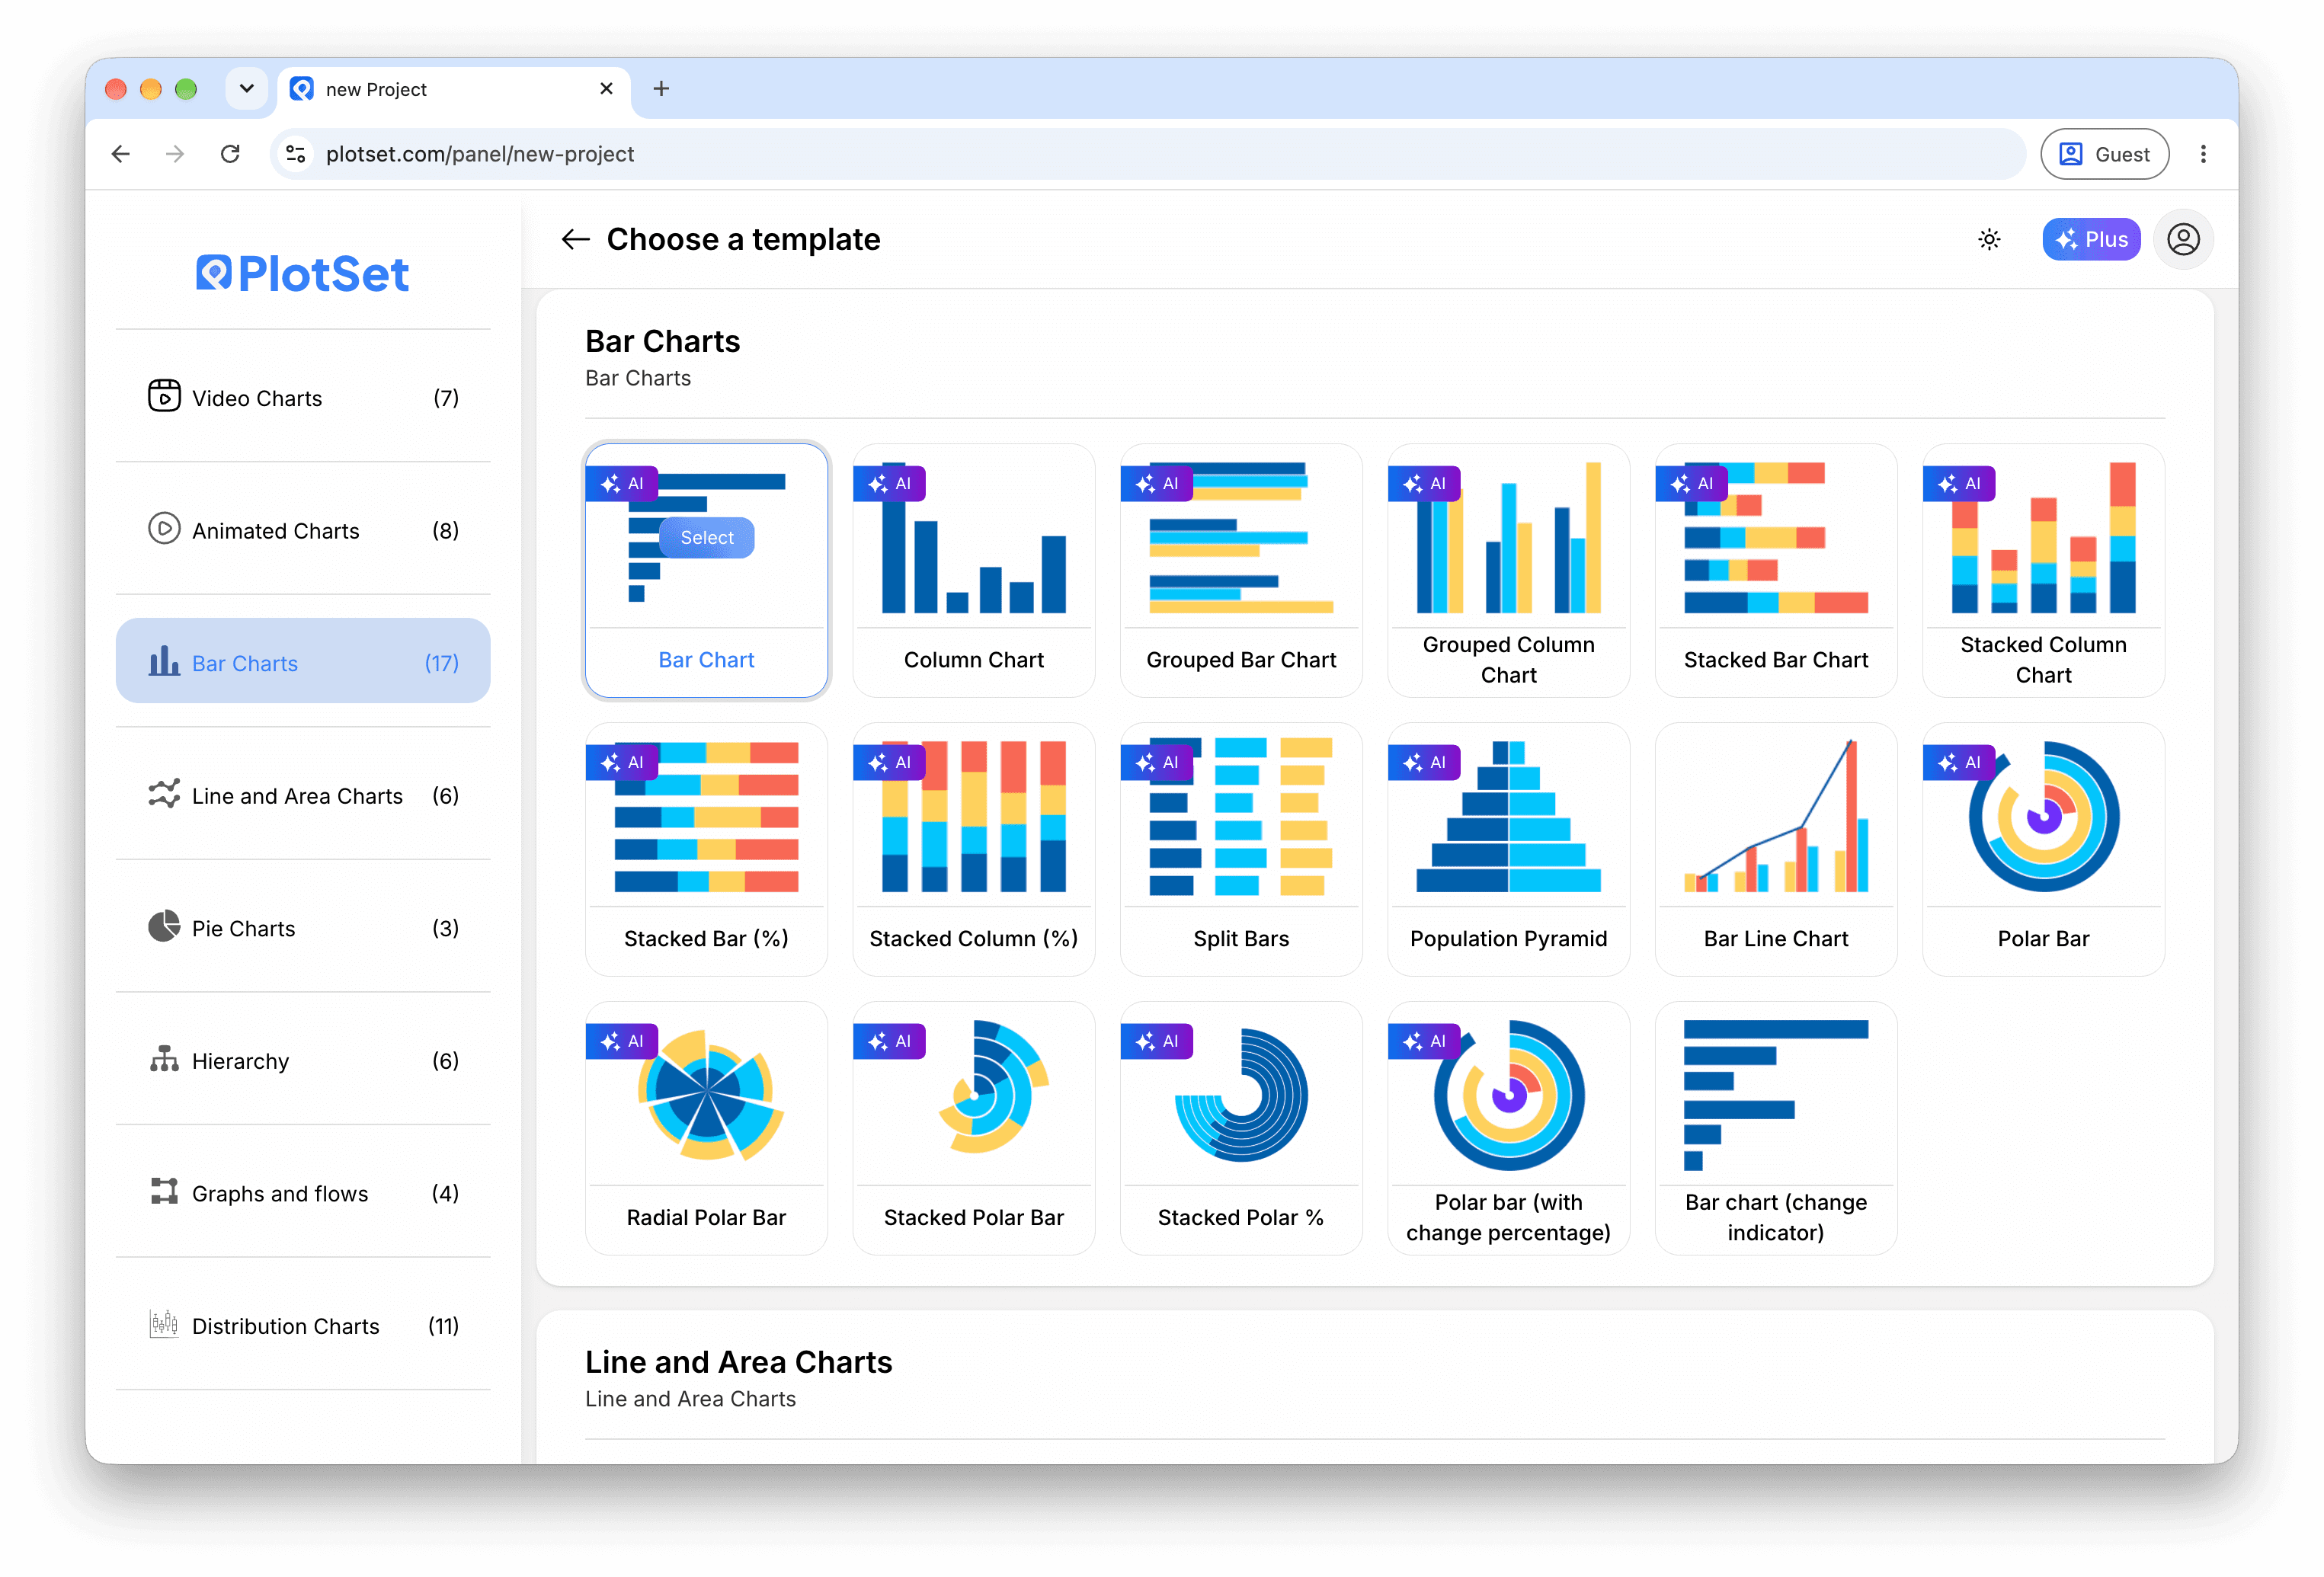
    From the PlotSet dashboard, start a new project and search for Quiz. It opens with five questions about the solar system.

    PlotSet's template picker: chart categories listed down the left, the Bar Charts grid open, and the Bar Chart template card showing its Select button.
    Every guide starts here. Pick the category, then the template: it is the same grid whichever chart type you are after.
  2. 02

    Write the questions

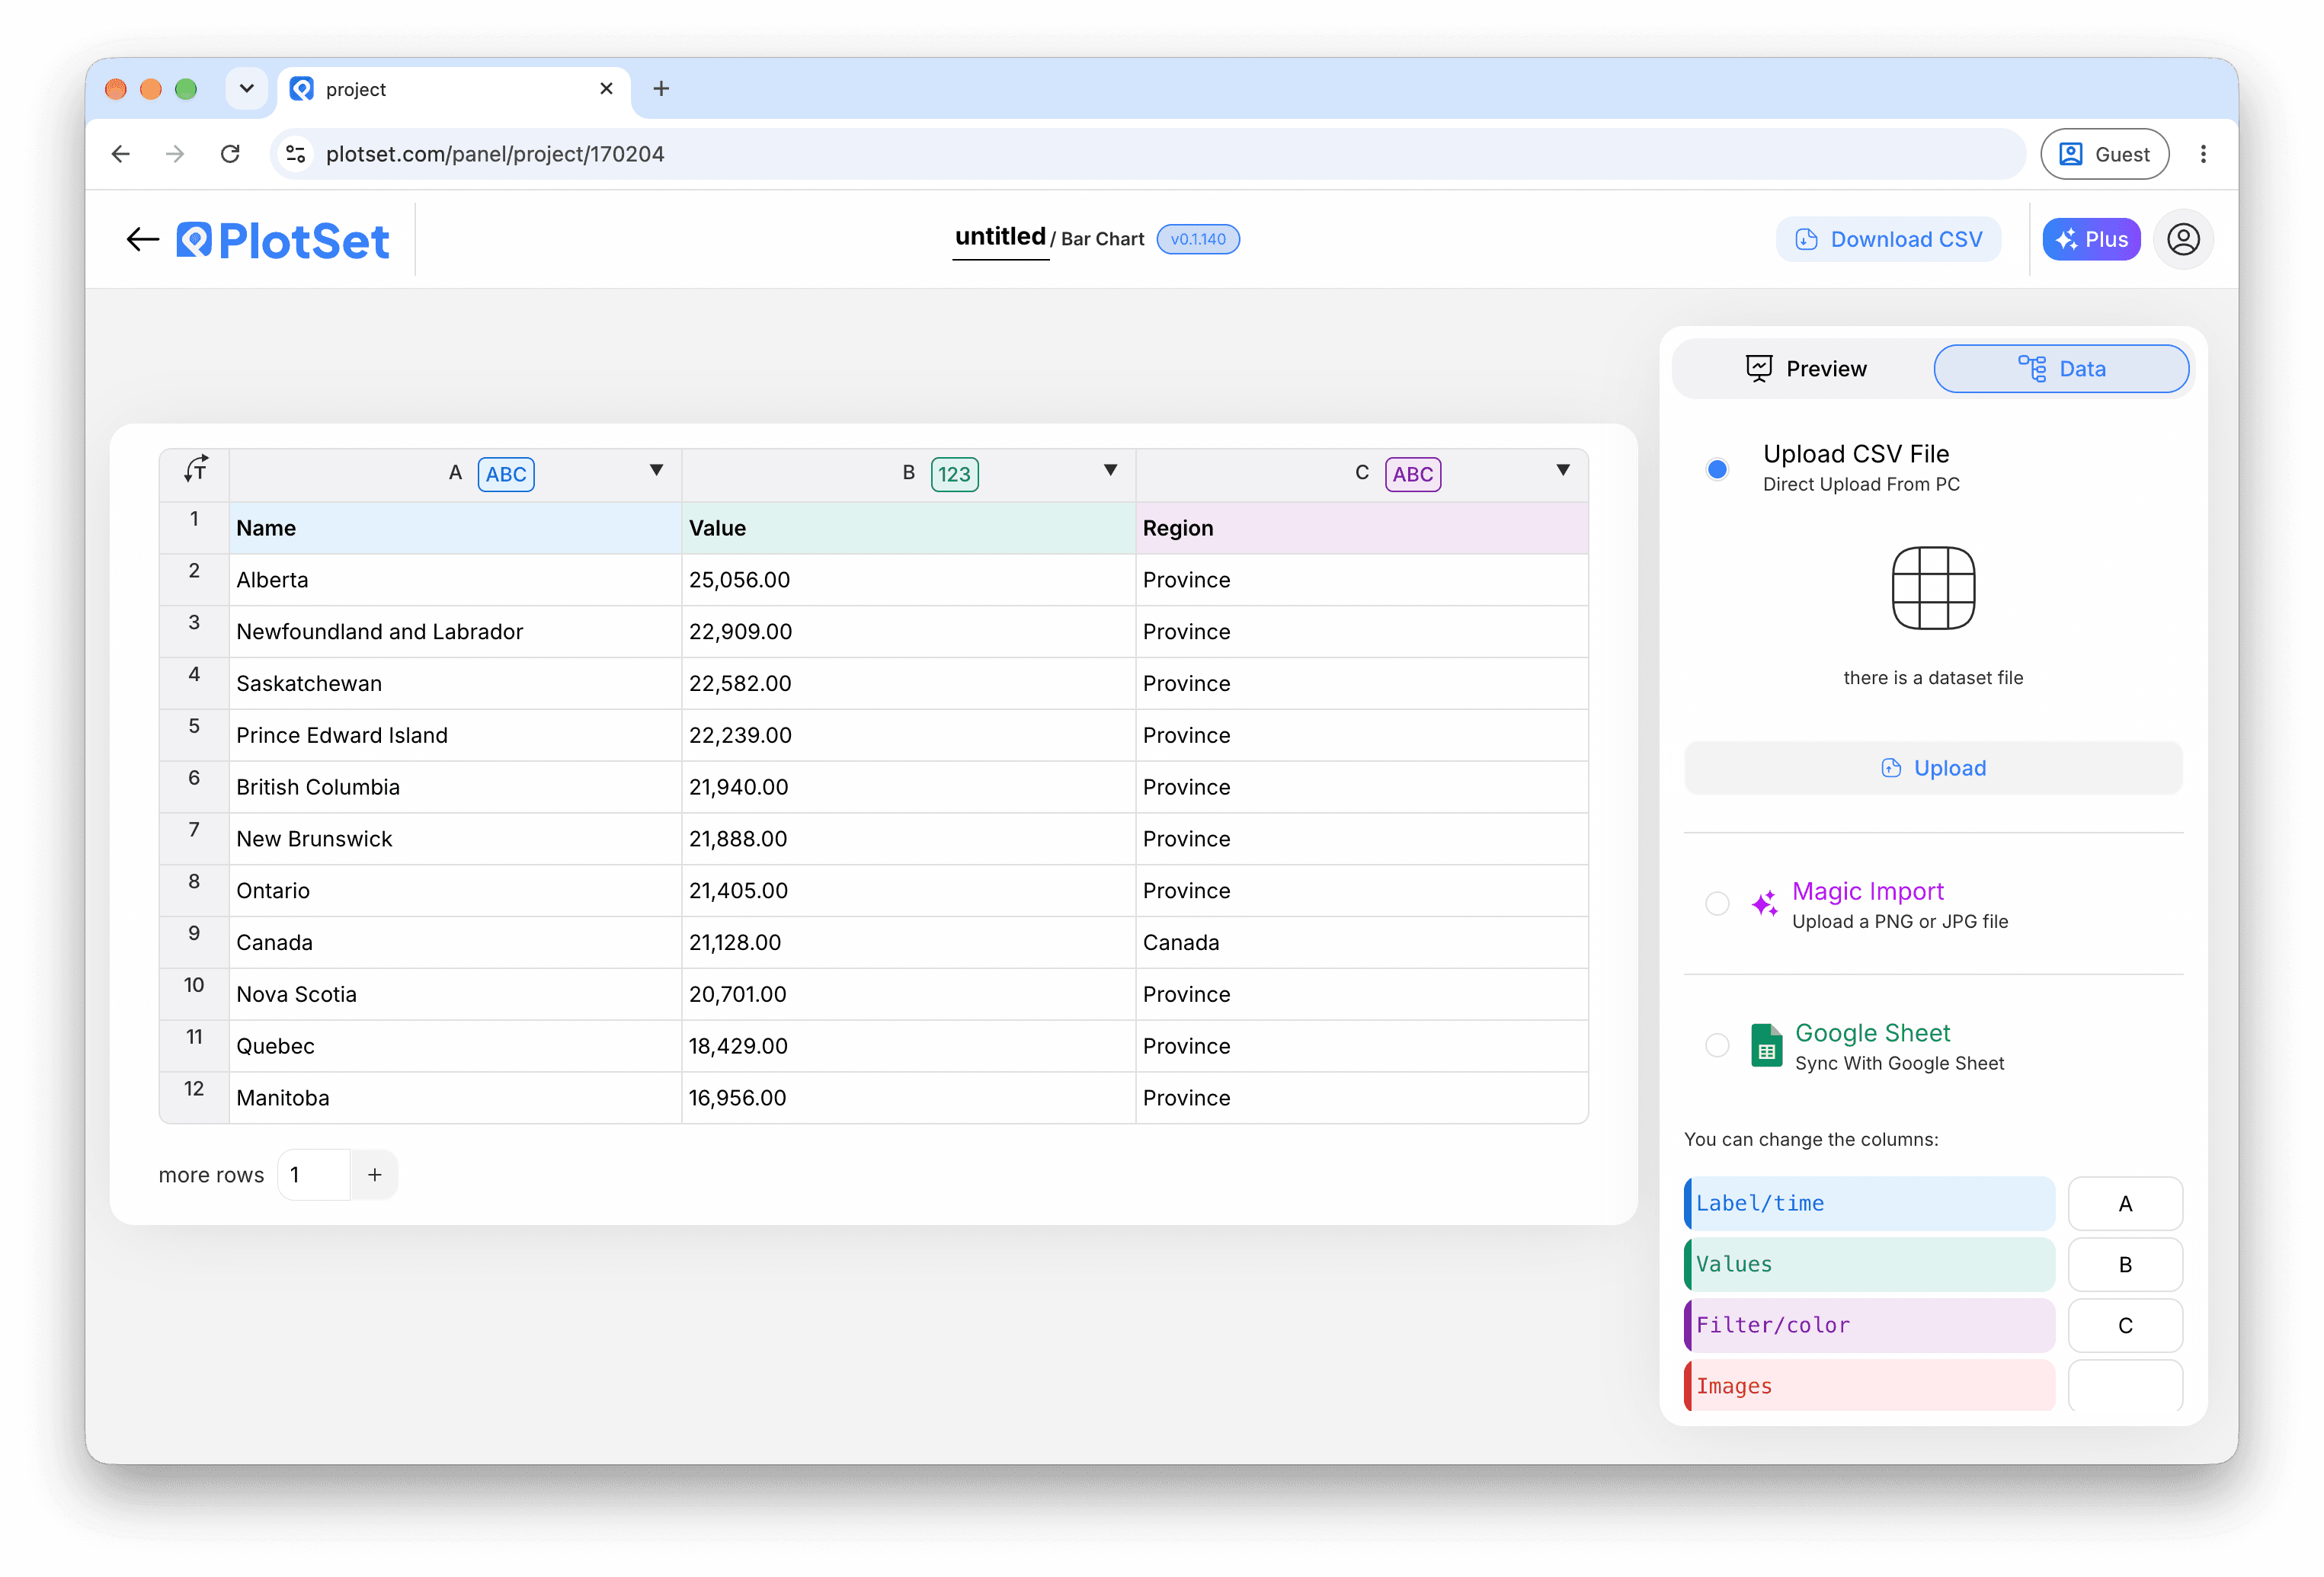
    Edit the question rows, or import a CSV or .xlsx file. Give each one an input type and a correct answer, and add options for a multiple choice question.

    The PlotSet editor's data view: a spreadsheet grid with Name, Value and Region columns filled with Canadian province figures, beside the Data panel offering CSV upload, Magic Import and Google Sheet sync.
    The data view, shown here on a bar chart project. Upload a CSV, lift the numbers out of an image with Magic Import, or sync a Google Sheet. The panel is identical for every chart type.
  3. 03

    Check the column bindings

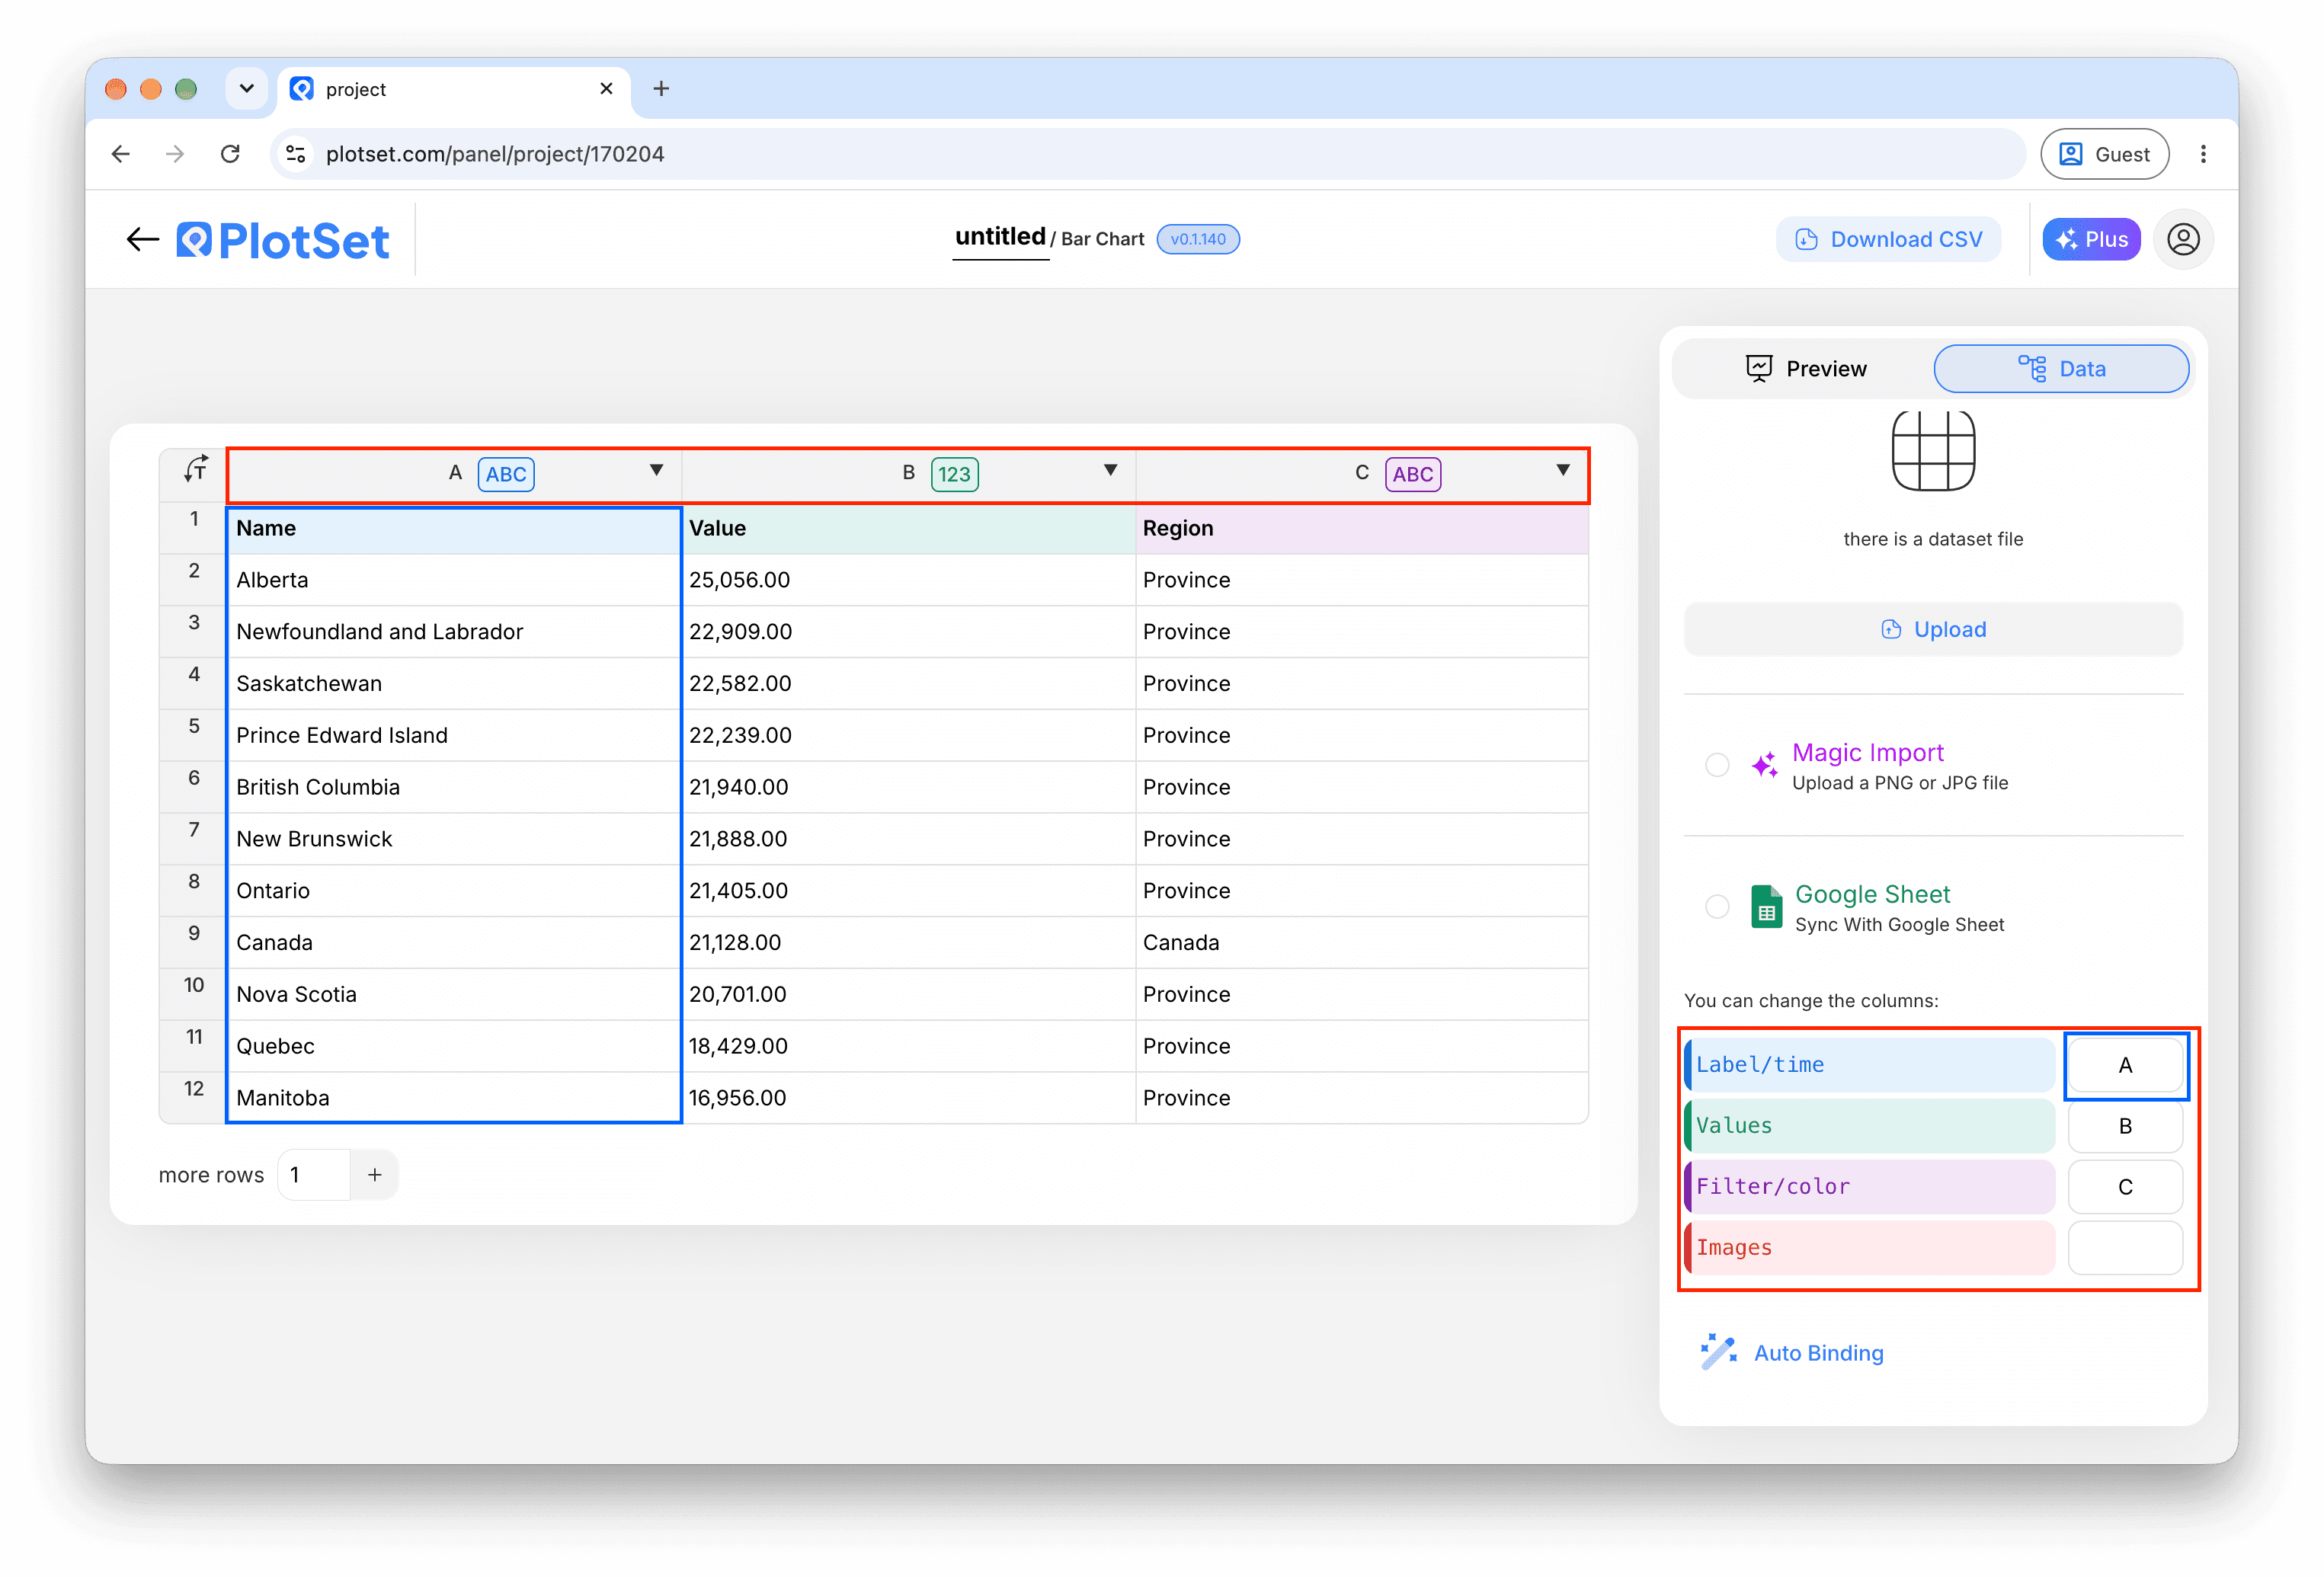
    Bind the columns for the question, the correct answer, the input type and the choices, then the row type and the feedback text.

    The PlotSet data panel with the column bindings highlighted: Label/time mapped to column A, Values to column B and Filter/color to column C, with the Auto Binding button below.
    Bindings decide which column becomes the label, which supplies the values and which drives the colour. Auto Binding guesses them from your headers, so check it rather than assume it.
  4. 04

    Add feedback for each answer

    Add score rows that name a question and an answer, with a message and, if you like, an image link.

  5. 05

    Add result bands

    Add result rows for the total score, such as 0-3 and 3-5, each with a closing message.

  6. 06

    Choose the flow

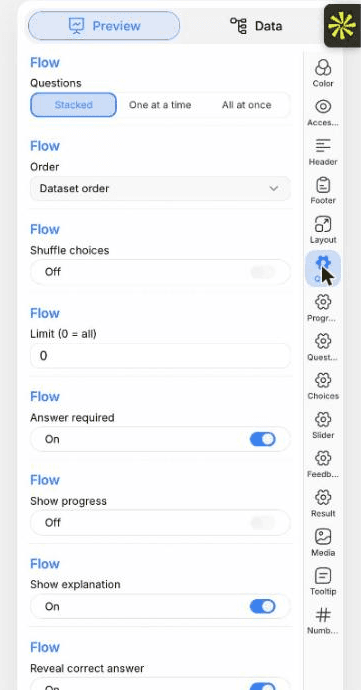
    In the Quiz tab, show the questions stacked, one at a time or all at once, and decide whether an answer is required before moving on.

    The PlotSet editor on the Preview tab: a finished Quiz on the canvas, with the settings panel outlined in red down the right-hand side.
    The Preview tab for a Quiz. Every styling control lives in the outlined panel, each on its own tab: appearance, header, footer and the options specific to this chart type.
  7. 07

    Set the sliders and labels

    The Slider tab sets how close a guess must be to count. The Quiz tab lets you reword every button.

  8. 08

    Publish and embed

    Publish for a live quiz and copy the embed code from the Share dialog. Take the quiz once yourself before you share it.

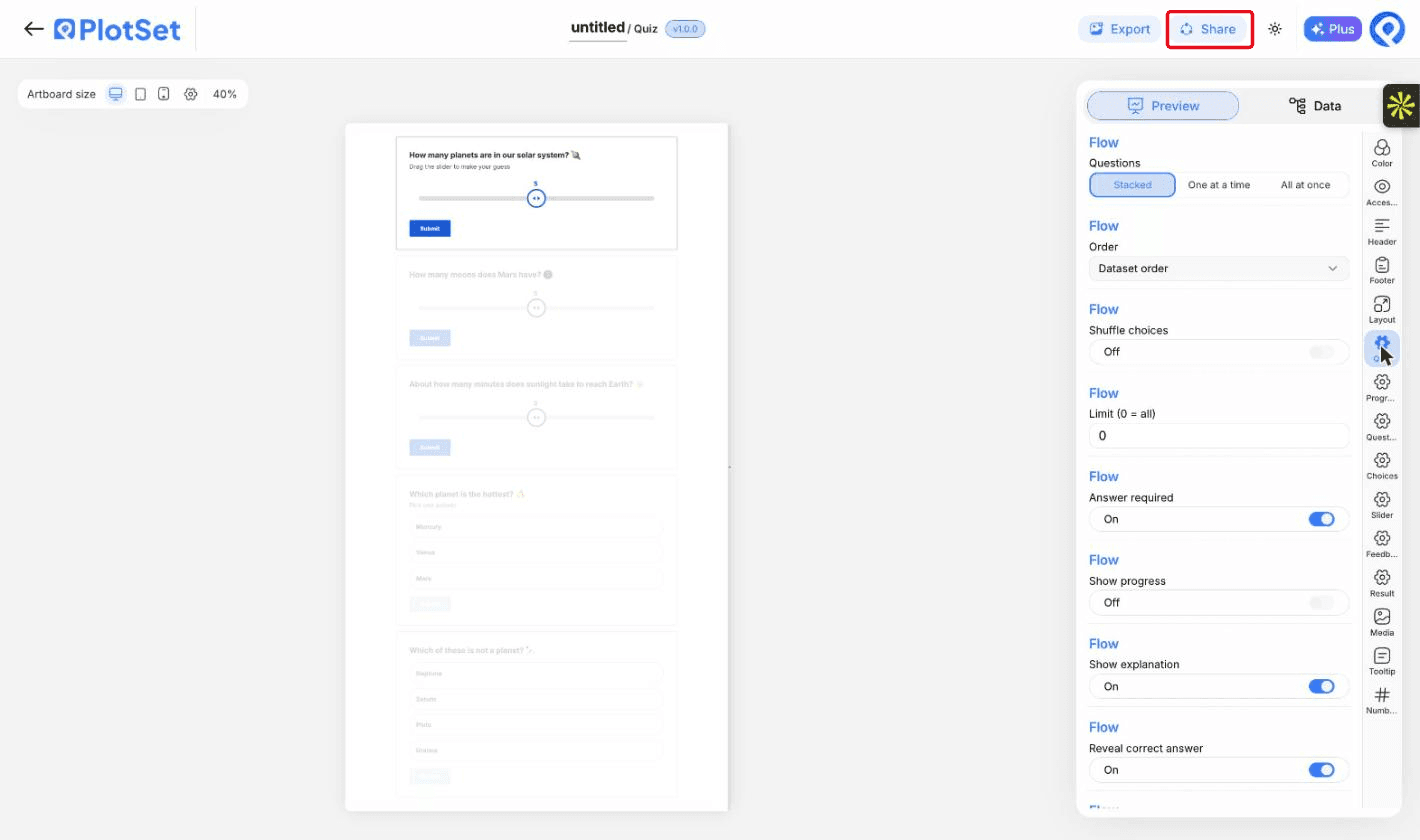
    The PlotSet editor toolbar with the Share button highlighted, sitting next to the Export button.
    Share is how a finished chart becomes a public link and an embed code.

Start from the Quiz template with sample data already loaded, then swap in your own.

Open the template

Publish, embed or export it

The last stretch is the same for every chart type: Share turns the chart into a live public link and an embed code, Export writes it out as a static file.

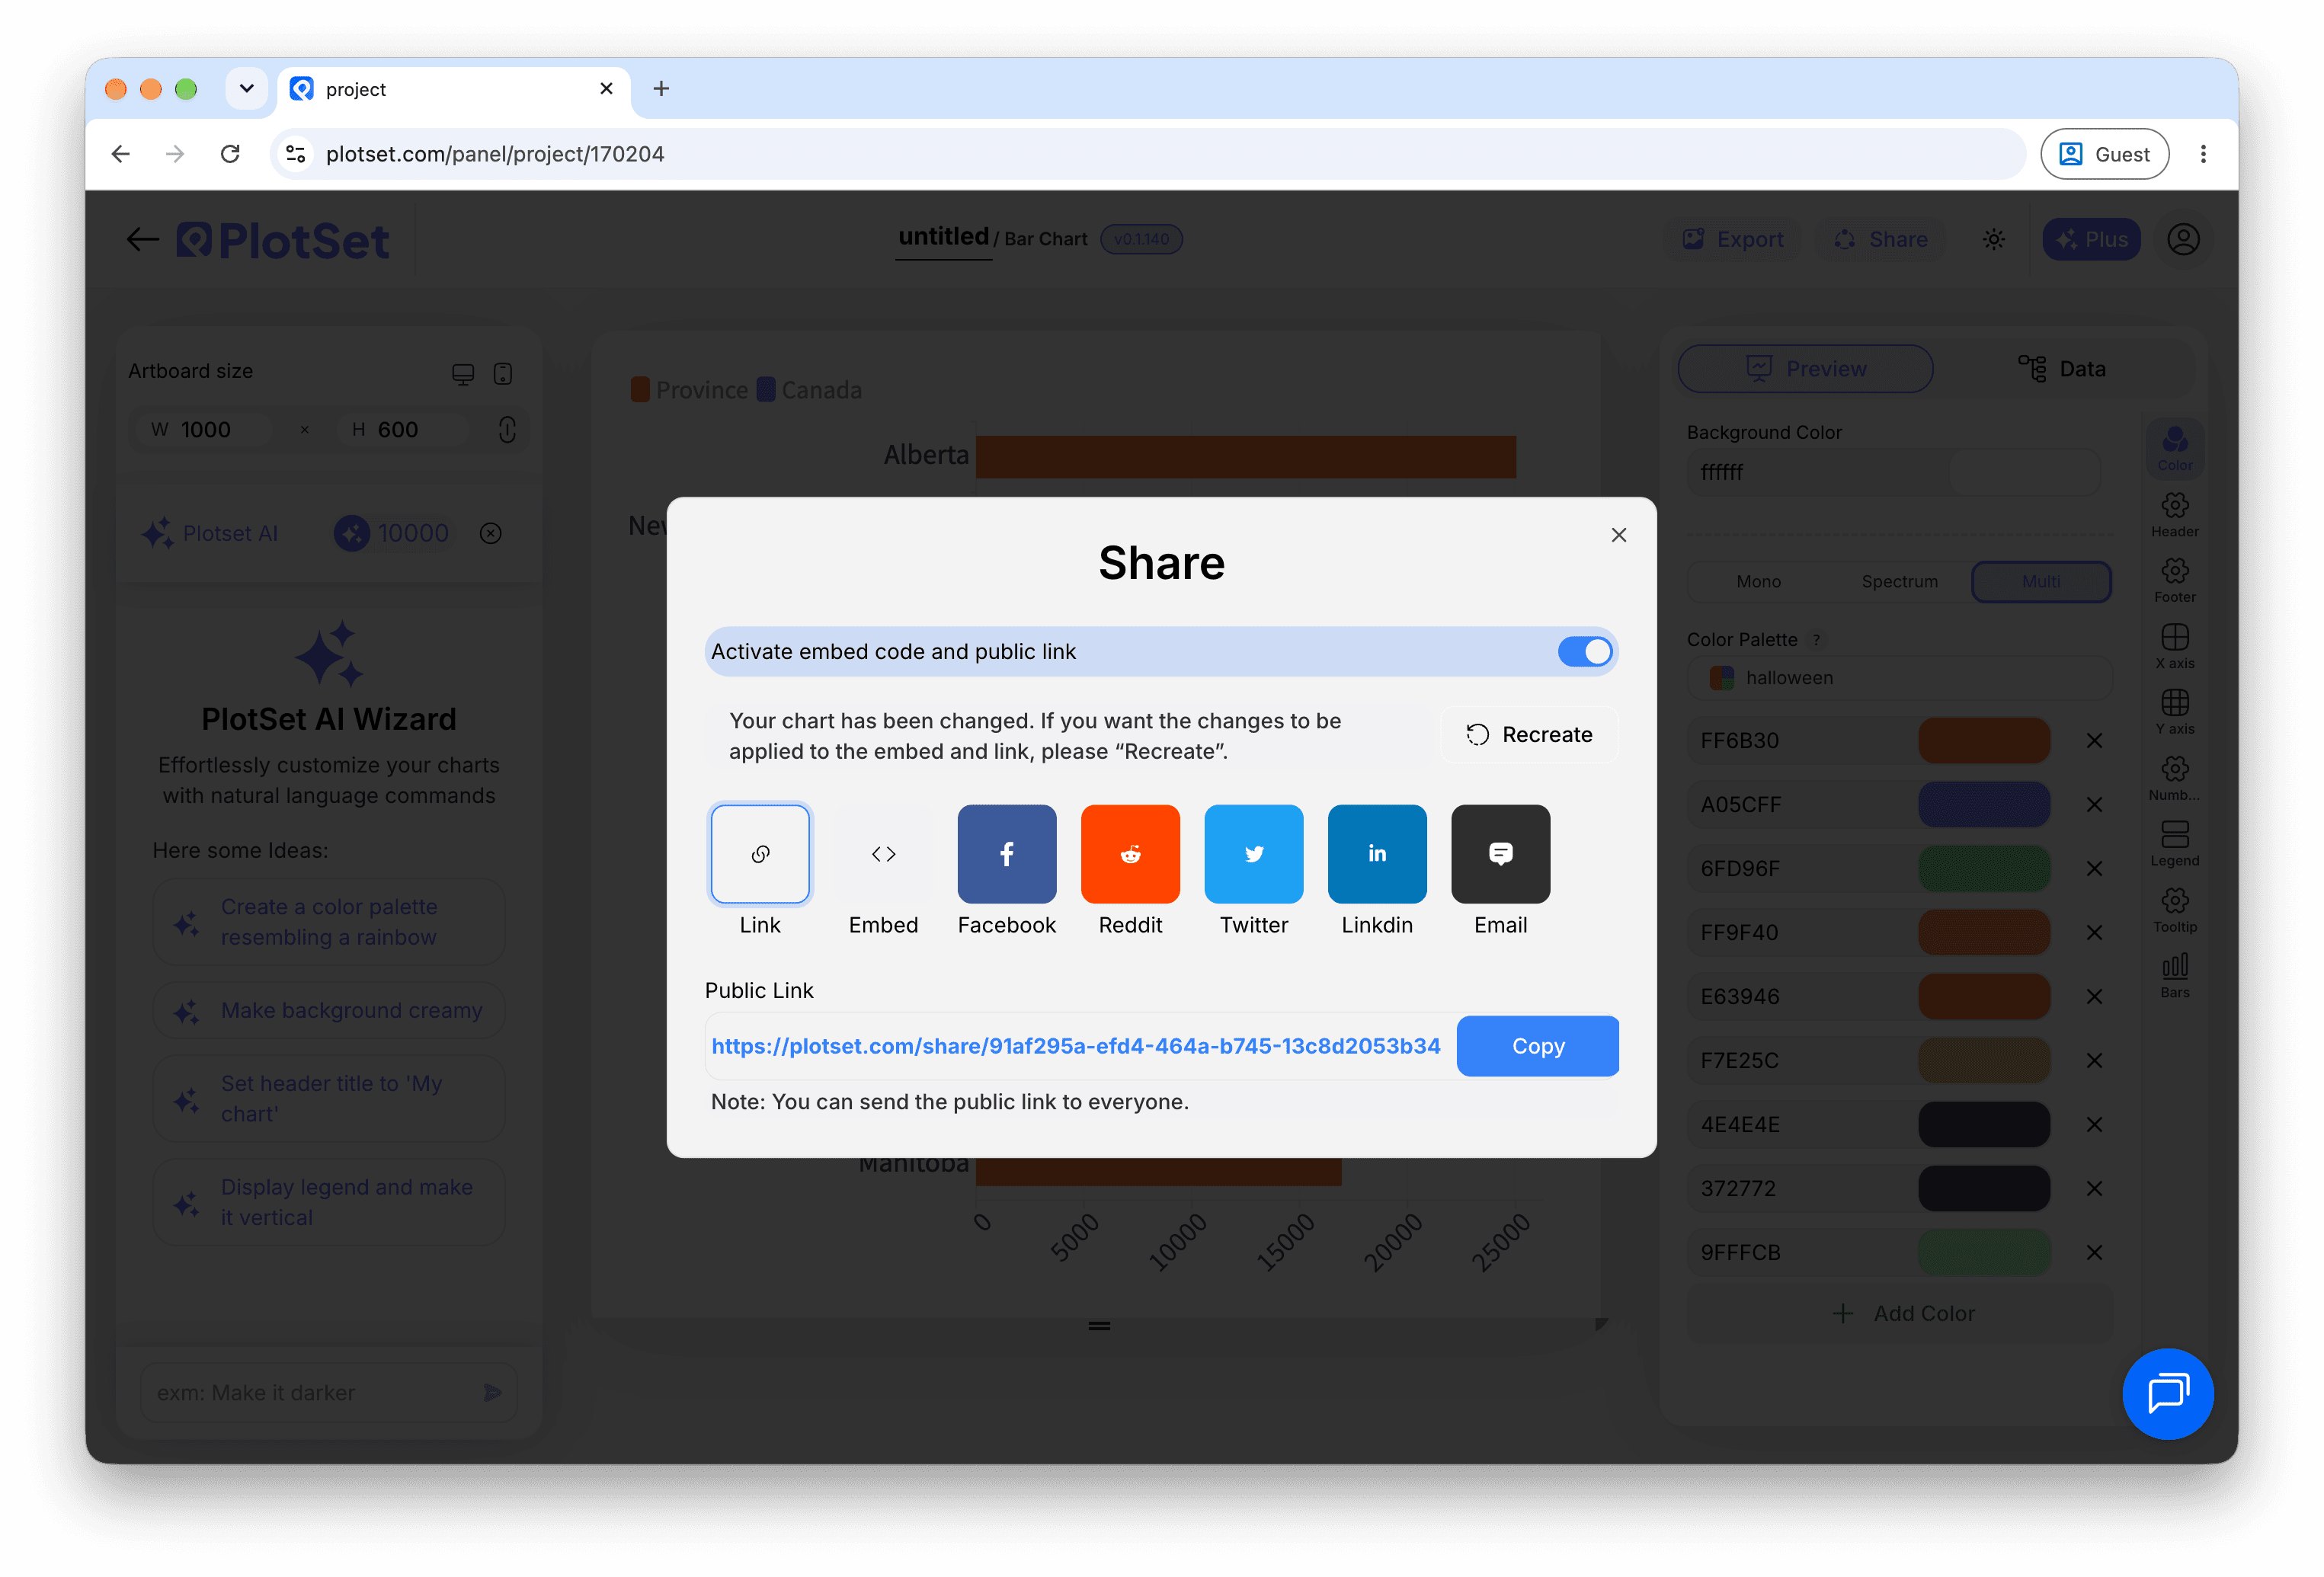
Share: public link and embed code

Activating the embed code and public link publishes the chart. The link is safe to send to anyone, and the embed code drops into any page as an iframe that keeps the hover tooltips and the interactivity. Edit the chart later and hit Recreate to push those changes out to both.

The PlotSet editor toolbar with the Share button highlighted, sitting next to the Export button.
Share is how a finished chart becomes a public link and an embed code.
PlotSet's Share dialog: the toggle activating the embed code and public link, buttons for Link, Embed, Facebook, Reddit, Twitter, LinkedIn and Email, and the public chart link with a Copy button.
Switch on the embed code and public link, then copy the link or take the iframe. Recreate pushes later edits out to everyone already holding it.

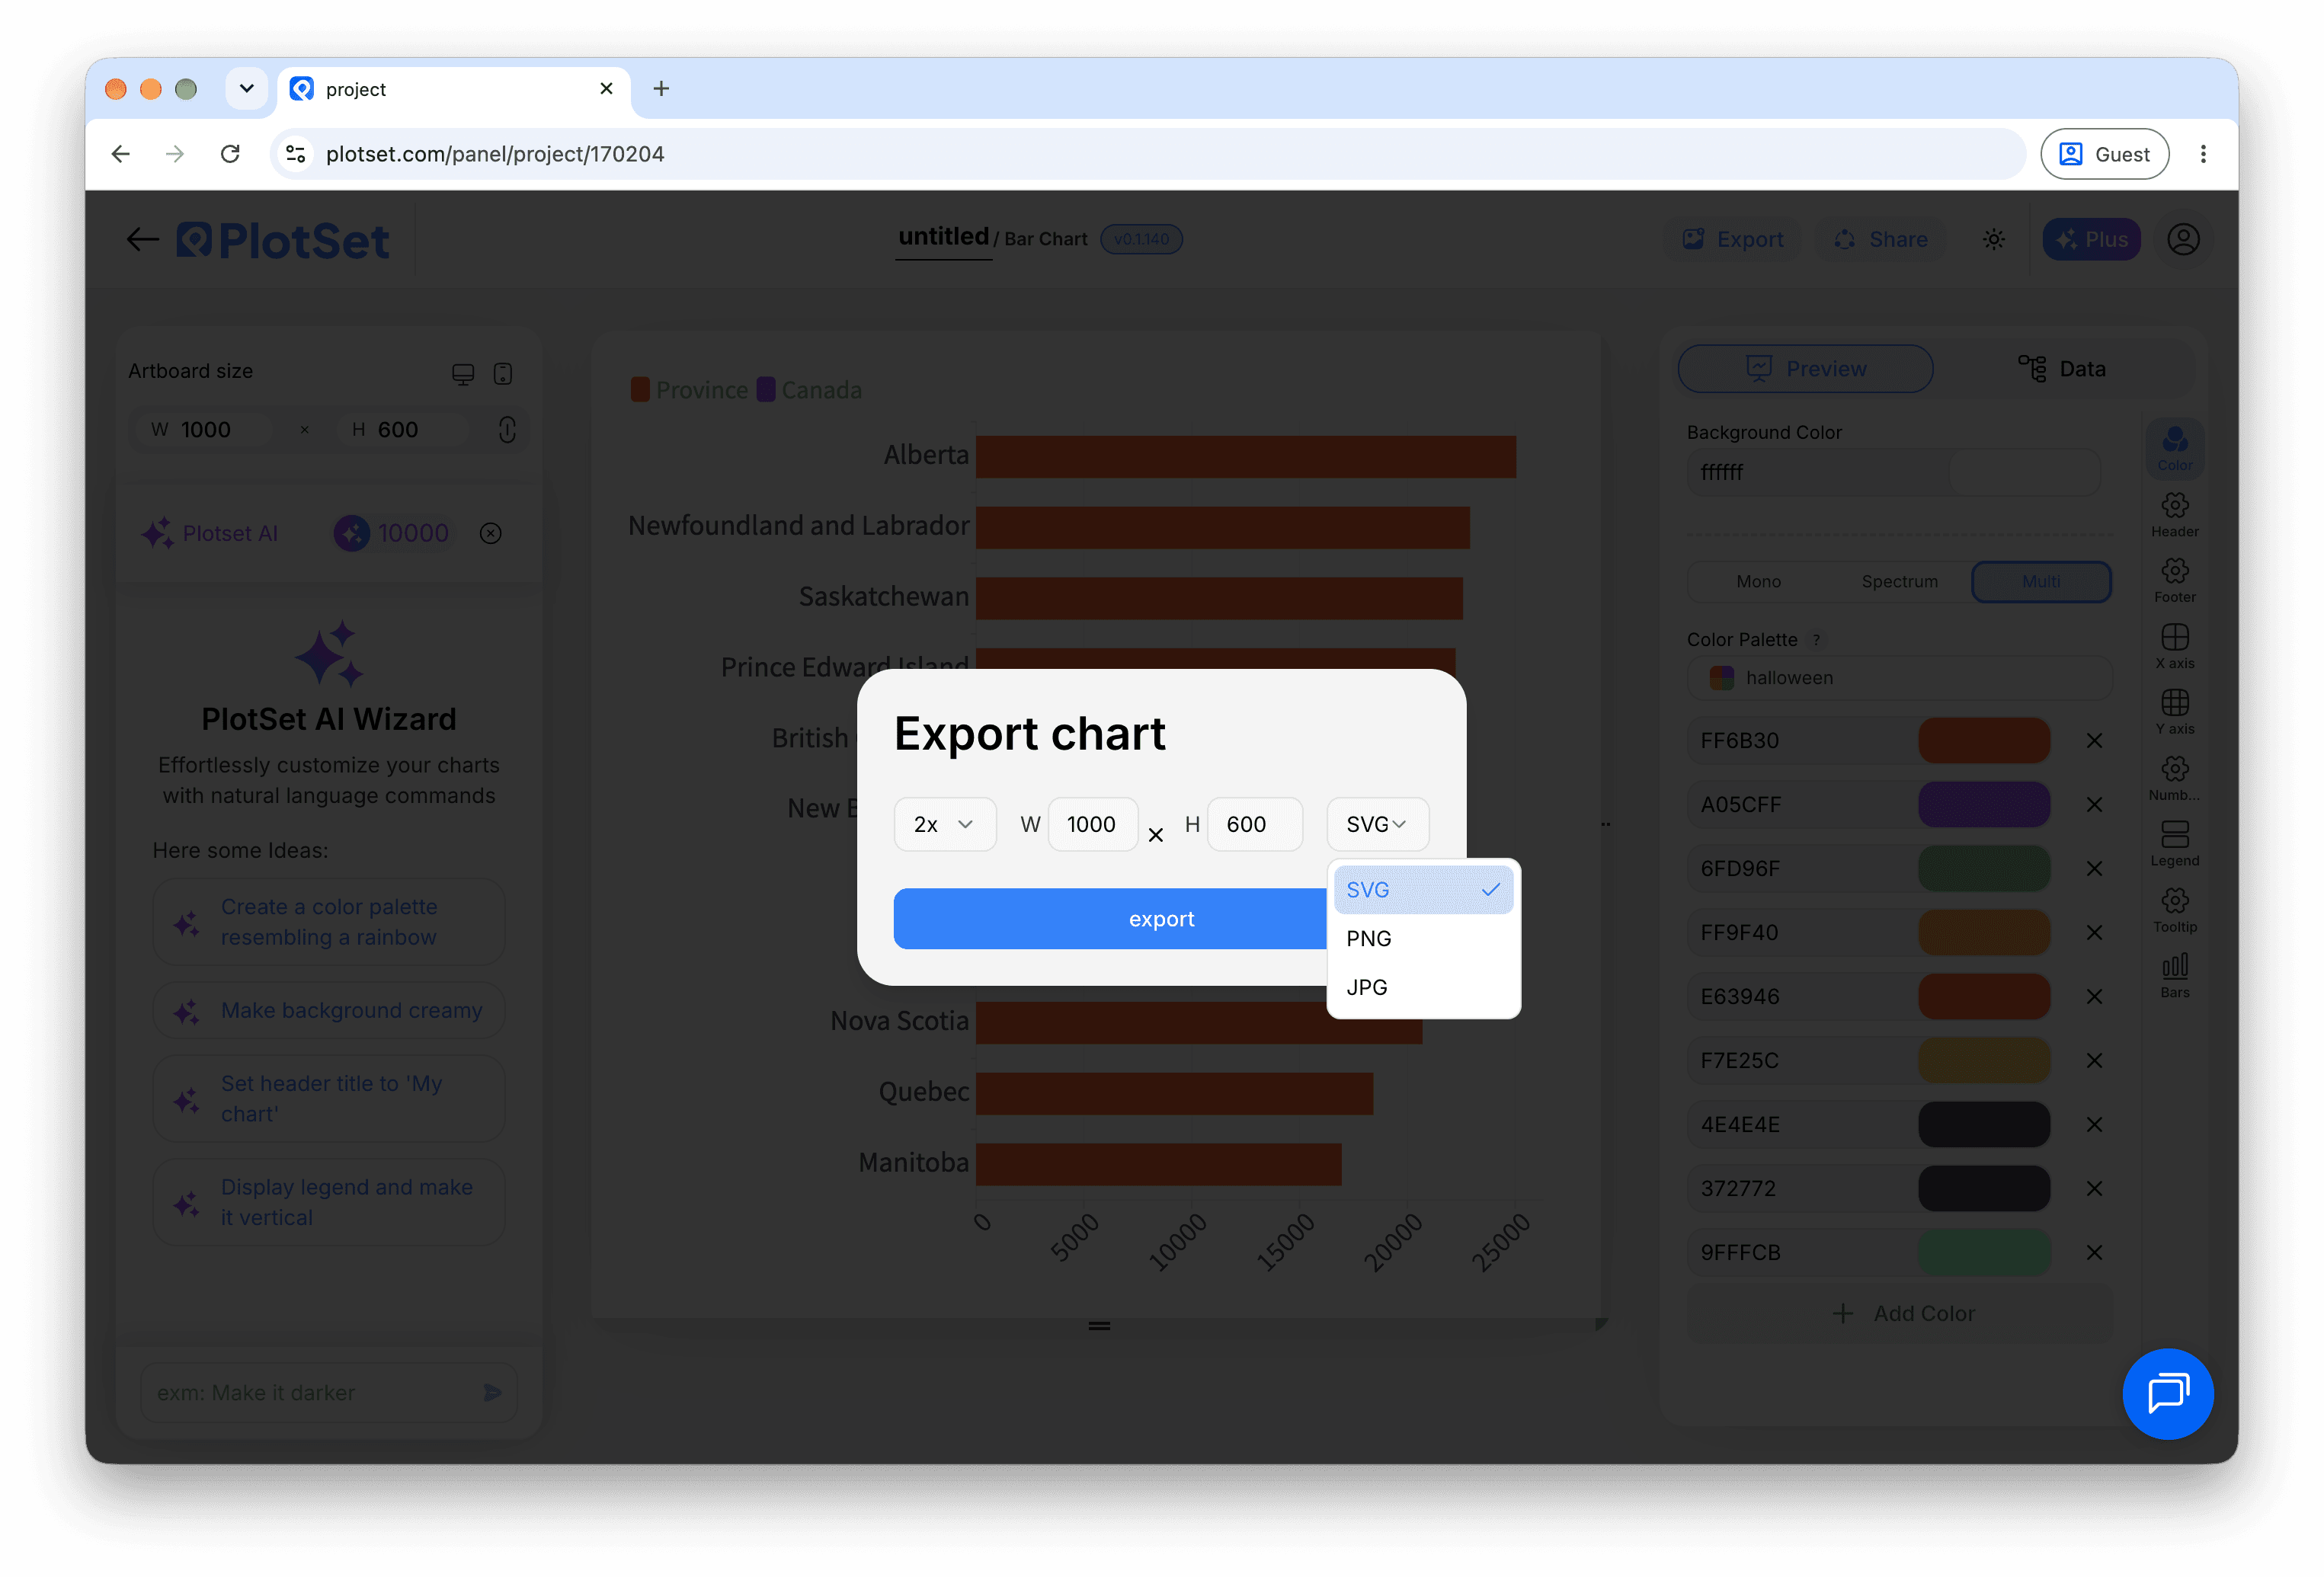
Export: SVG, PNG or JPG

Export writes a static copy at whatever size you need. SVG stays sharp at any scale and can still be edited in a design tool; PNG and JPG are the safe choices for slides and documents. The scale multiplier is what gets you a crisp image on a retina screen.

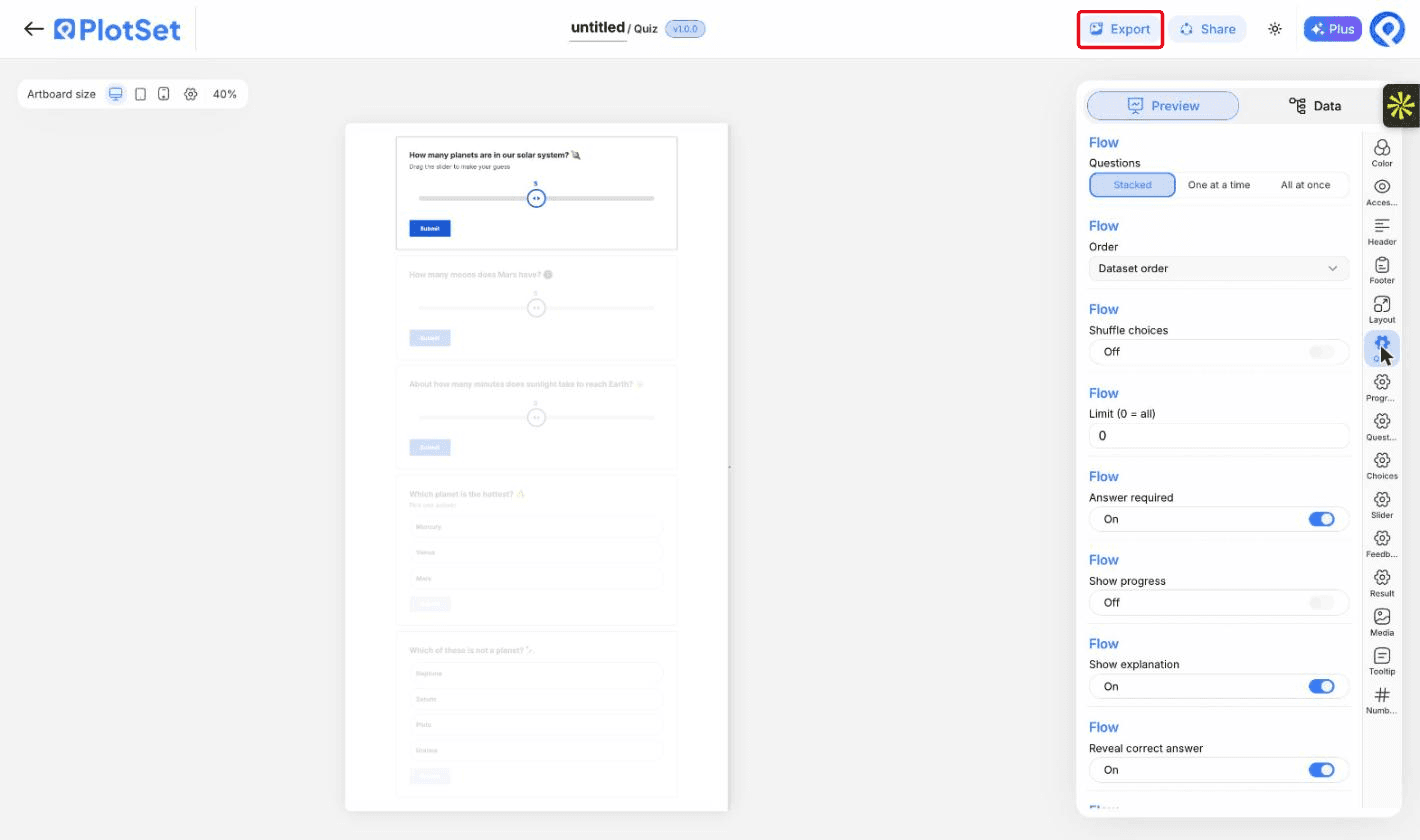
The PlotSet editor toolbar with the Export button highlighted.
Export is the route to a static file for a slide or a report.
PlotSet's Export chart dialog: a 2x scale selector, width and height fields set to 1000 by 600, and the open format menu listing SVG, PNG and JPG.
SVG stays sharp at any size and stays editable in a design tool; PNG and JPG are the safe picks for a deck. Set the scale before you export so the image is crisp on a retina screen.

Styling tips for a Quiz

Mix the question types

A slider or two between multiple choice questions keeps readers engaged.

Explain the answer

A line of explanation after each answer is what readers remember.

Keep it short

Five to ten questions suits most readers.

Use pictures sparingly

An image helps on feedback rows. Too many slow the page.

Common mistakes when making a Quiz

A question is never marked correct

The answer text must match a choice exactly. Check spelling and spaces.

No feedback appears

The score row's question must match the question text exactly, or use its number.

The result card shows default text

No result band matched the final score. Check that the bands cover every possible score.

Everything is treated as a question

The type column is not bound. Bind it to separate questions, feedback and results.

Learn more about the Quiz

Not sure the Quiz is the right choice? See what it is, when to use it and when not to.

About the Quiz

Quiz: common questions

Yes. Set the input type to dropdown and list the options.

Make your Quiz now

Free to start with 600+ templates. No credit card required.