PlotSet LogoPlotSet

How to Create an Online Calculator

A step by step walkthrough for turning a spreadsheet of questions into a published, embeddable calculator in PlotSet, with a formula that computes a result from visitors' answers.

About 10 minutes

A short sequence of questions followed by a computed result, such as a score, an estimate or a recommendation, ready to embed on your page: that is what you will have. Each row of a spreadsheet becomes one question, and a formula you write turns the answers into a number.

Expect about ten minutes. Most of it is deciding the questions and the formula, since the template does the rest. Test it with a few known inputs before you publish.

The data you need

One row per question with a question text and type, then optional answer options, a default answer, help text, an image URL and extra numeric columns such as a weight.

Sample CSV
question_textquestion_typeanswers_rawfallback_valuecontext_textimageweight_co2
How many miles do you drive per week?number50Include commuting and errands0.4
How often do you fly each year?slider"0101"2Return trips count as two250
What is your diet?dropdownVegan|Vegetarian|Mixed|Meat heavyMixed1
How many people live in your home?rating52
Notes

Question type must be one of text, number, dropdown, date, rating, slider or buttons. Anything else becomes a text box.

For dropdown and buttons, separate options with a pipe. Use label=value to store a value different from the label.

For rating, give the number of icons. For slider, give min,max,step, such as 0,10,1.

Extra numeric columns, such as a weight, are available in the formula as q1_weight, named by question number and column header.

The steps

The exact click path in PlotSet, from a blank template to a finished chart.

  1. 01

    Open the Calculator template

    From the PlotSet dashboard, start a new project and choose Calculator from the Other category. It loads with an eight-question sample so you can see every question type working.

    PlotSet's template picker: chart categories listed down the left, the Bar Charts grid open, and the Bar Chart template card showing its Select button.
    Every guide starts here. Pick the category, then the template: it is the same grid whichever chart type you are after.
  2. 02

    Write your questions

    Give each question a prompt and a type, then add options, a sensible default and a line of help text where it helps. Keep each question short and answerable in one move.

  3. 03

    Upload the file, or connect it live

    Import a CSV or .xlsx file from the data panel, paste rows from a spreadsheet, or connect a Google Sheet so changes to the questions flow through. The first row is read as the headers.

    The PlotSet editor's data view: a spreadsheet grid with Name, Value and Region columns filled with Canadian province figures, beside the Data panel offering CSV upload, Magic Import and Google Sheet sync.
    The data view, shown here on a bar chart project. Upload a CSV, lift the numbers out of an image with Magic Import, or sync a Google Sheet. The panel is identical for every chart type.
  4. 04

    Check the column bindings

    Confirm which column is the question text, type, options, default, help text, image and extra data. This is usually right automatically when the headers are clear.

    The PlotSet data panel with the column bindings highlighted: Label/time mapped to column A, Values to column B and Filter/color to column C, with the Auto Binding button below.
    Bindings decide which column becomes the label, which supplies the values and which drives the colour. Auto Binding guesses them from your headers, so check it rather than assume it.
  5. 05

    Write the result formula

    Open the Submit and result tab. In the variables box add one name equals expression line per value, referring to answers as q1, q2 and so on. Then write the result text and put the names in double curly brackets.

    The PlotSet editor on the Preview tab: a finished Calculator on the canvas, with the settings panel outlined in red down the right-hand side.
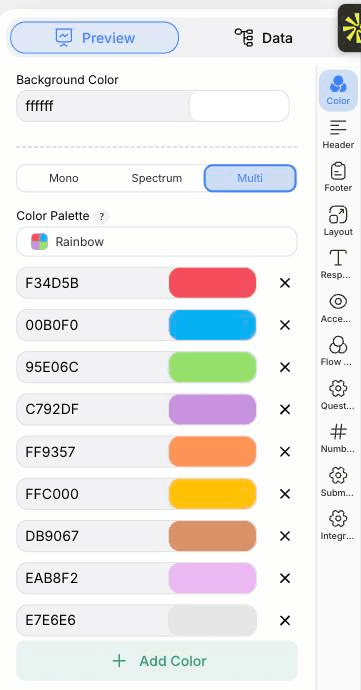
    The Preview tab for a Calculator. Every styling control lives in the outlined panel, each on its own tab: appearance, header, footer and the options specific to this chart type.
  6. 06

    Choose the flow

    In the Flow and design tab, show one question at a time with Back and Next buttons, or all questions on one page. Style the card, buttons and inputs to match your site.

  7. 07

    Style the question types

    The Question types tab styles each control separately: text and number inputs, dropdowns, rating icons, sliders and button groups.

  8. 08

    Test it, then publish

    Answer every question with known values and check the result against a hand calculation. Then publish and copy the embed code from the Share dialog.

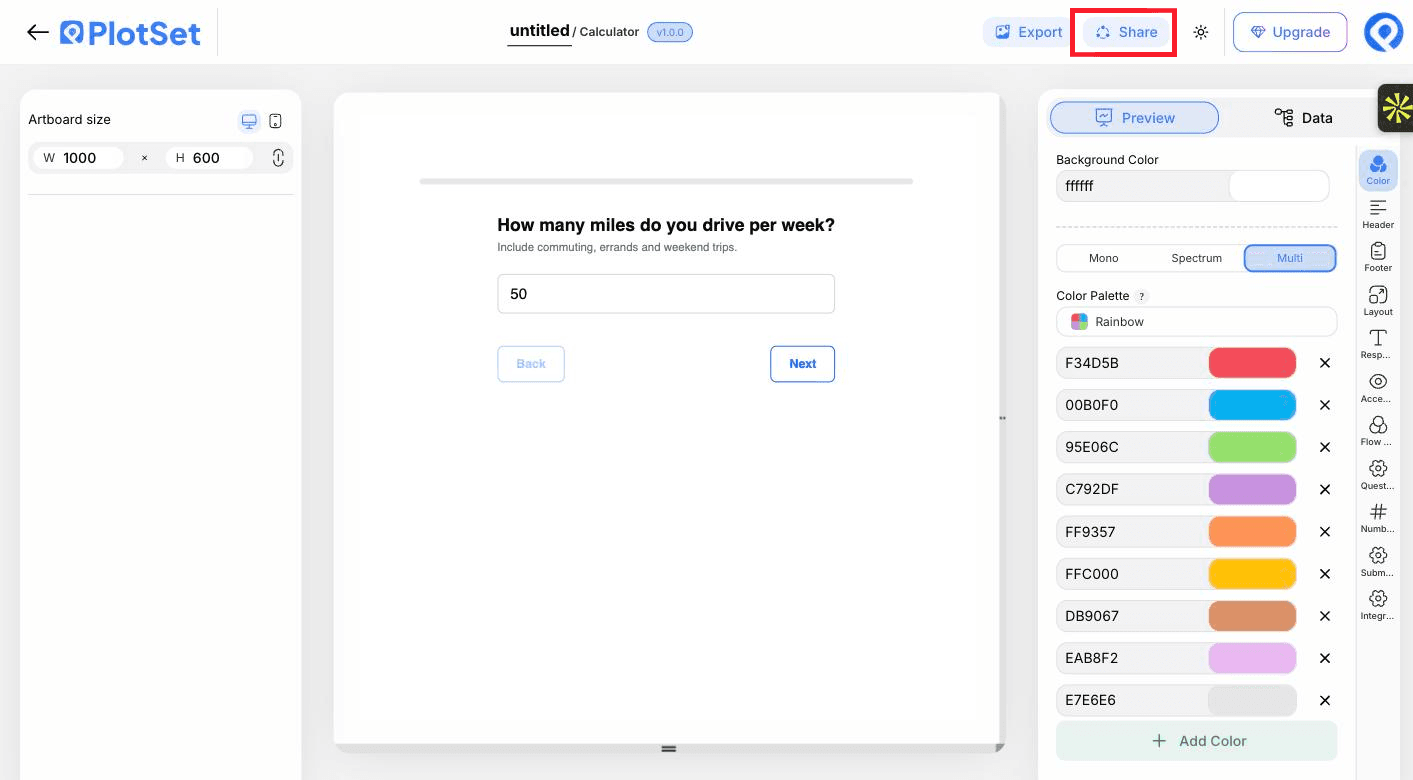
    The PlotSet editor toolbar with the Share button highlighted, sitting next to the Export button.
    Share is how a finished chart becomes a public link and an embed code.

Start from the Calculator template with sample data already loaded, then swap in your own.

Open the template

Publish, embed or export it

The last stretch is the same for every chart type: Share turns the chart into a live public link and an embed code, Export writes it out as a static file.

Share: public link and embed code

Activating the embed code and public link publishes the chart. The link is safe to send to anyone, and the embed code drops into any page as an iframe that keeps the hover tooltips and the interactivity. Edit the chart later and hit Recreate to push those changes out to both.

The PlotSet editor toolbar with the Share button highlighted, sitting next to the Export button.
Share is how a finished chart becomes a public link and an embed code.
PlotSet's Share dialog: the toggle activating the embed code and public link, buttons for Link, Embed, Facebook, Reddit, Twitter, LinkedIn and Email, and the public chart link with a Copy button.
Switch on the embed code and public link, then copy the link or take the iframe. Recreate pushes later edits out to everyone already holding it.

Export: SVG, PNG or JPG

Export writes a static copy at whatever size you need. SVG stays sharp at any scale and can still be edited in a design tool; PNG and JPG are the safe choices for slides and documents. The scale multiplier is what gets you a crisp image on a retina screen.

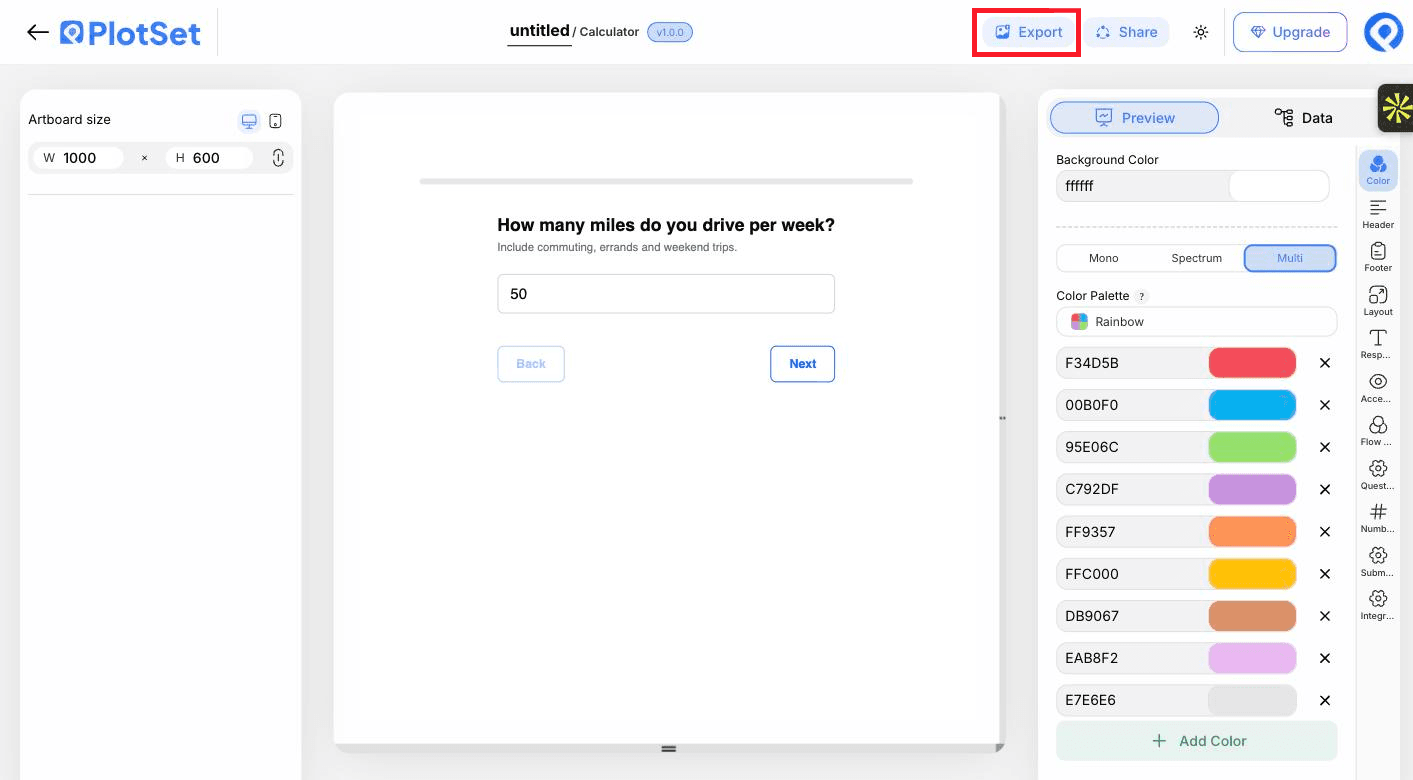
The PlotSet editor toolbar with the Export button highlighted.
Export is the route to a static file for a slide or a report.
PlotSet's Export chart dialog: a 2x scale selector, width and height fields set to 1000 by 600, and the open format menu listing SVG, PNG and JPG.
SVG stays sharp at any size and stays editable in a design tool; PNG and JPG are the safe picks for a deck. Set the scale before you export so the image is crisp on a retina screen.

Styling tips for a Calculator

Test with round numbers

Use inputs whose answer you can work out in your head, so a wrong formula is obvious.

Give honest defaults

An untouched question uses its default, so pick the most common answer rather than zero.

Name your variables

Build the result in named steps, such as driving, flights and total, so the formula stays readable.

Format the result

Use the Number and date format tab to set prefixes, suffixes and decimals so the result reads as a cost, a percentage or a weight.

Common mistakes when making a Calculator

The result shows zero

A line in the formula is probably malformed, and a bad line silently evaluates to zero. Check the spelling of each name and bracket.

A question appears as a text box

The type was misspelled or missing, so it fell back to text. Check it matches one of the seven types exactly.

The numbers shifted after reordering

Formulas use q1, q2 and so on by sheet order. If you move rows, update the formula.

The exported image does not match the live chart

The static export redraws the current state approximately. Use the live embed for the real experience.

Learn more about the Calculator

Not sure the Calculator is the right choice? See what it is, when to use it and when not to.

About the Calculator

Calculator: common questions

A question text and a question type for each row. Options, defaults, help text, an image and extra numeric columns are optional.

Make your Calculator now

Free to start with 300+ templates. No credit card required.