
Every chart here started as a spreadsheet.
Maps, bar chart races, treemaps, pictograms and more. Open one and remake it with your own data.
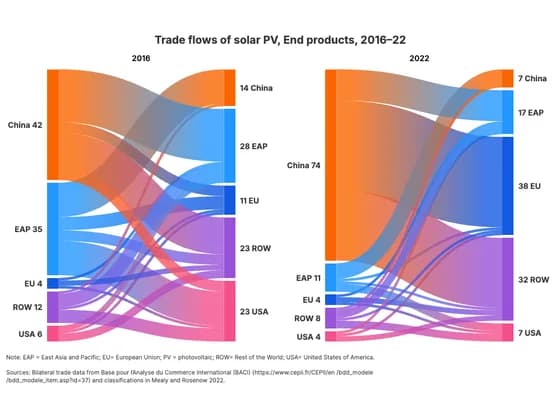 Sankey diagramTrade flows of solar PV, End products, 2016–22
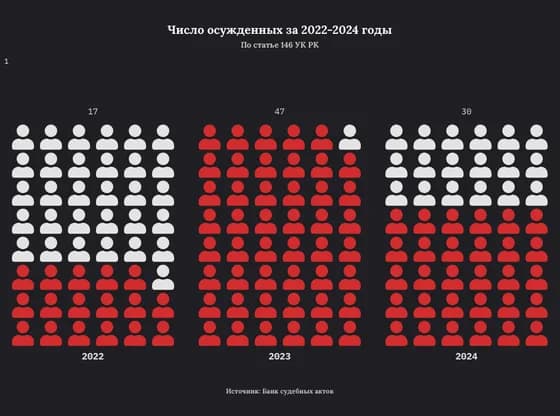 PictogramЧисло осужденных за 2022-2024 годы
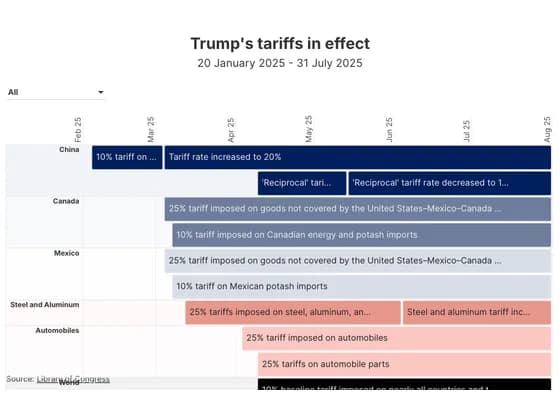 Gantt chartTrump's tariffs in effect
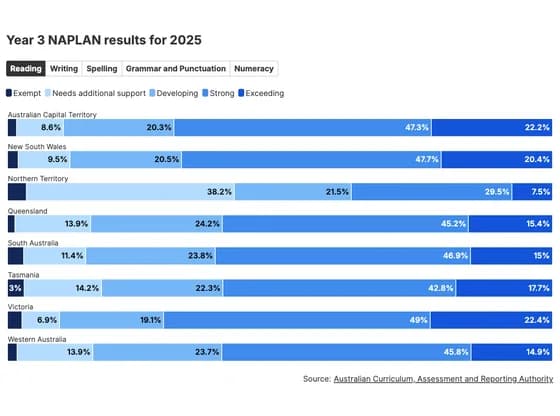 Line, bar and pie chartsYear 3 NAPLAN results for 2025
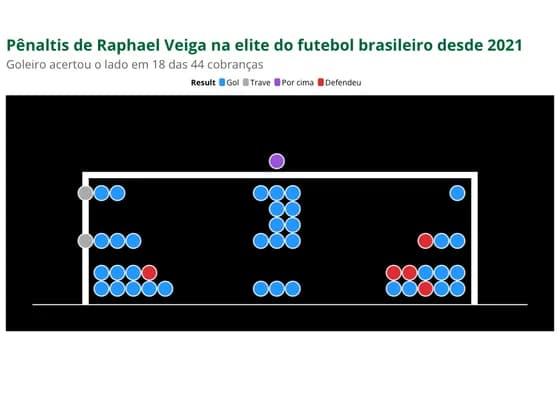 SportsPênaltis de Raphael Veiga na elite do futebol brasileiro desde 2021
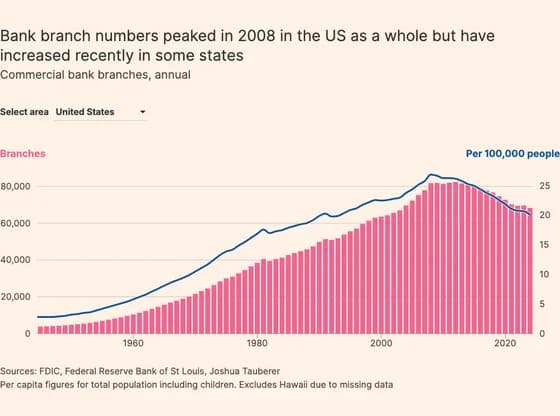 Line, bar and pie chartsBank branch numbers peaked in 2008 in the US as a whole but have increased recently in some states
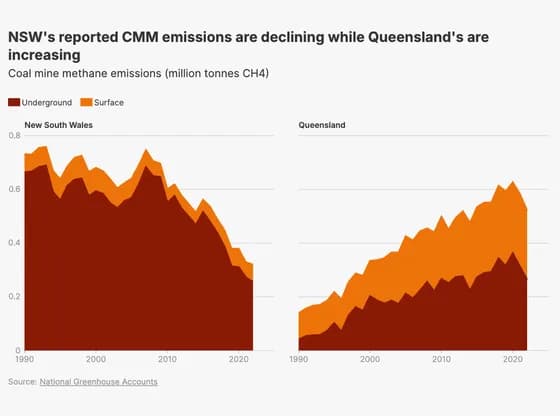 Line, bar and pie chartsNSW's reported CMM emissions are declining while Queensland's are increasing
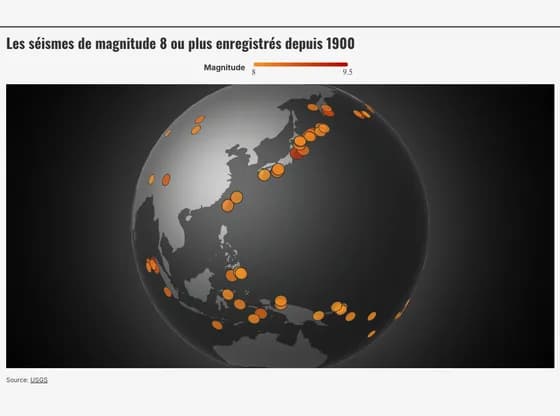 3D globeLes séismes de magnitude 8 ou plus enregistrés depuis 1900
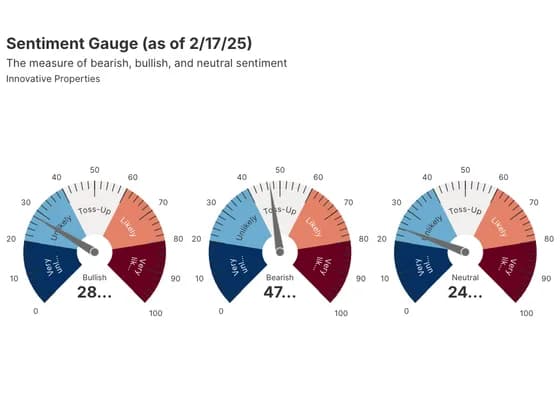 Counters and gaugesSentiment Gauge (as of 2/17/25)
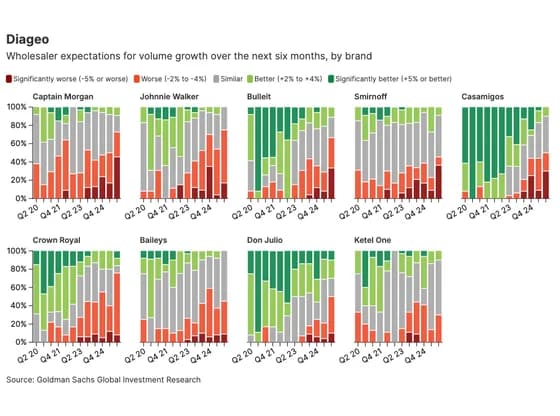 Line, bar and pie chartsDiageo
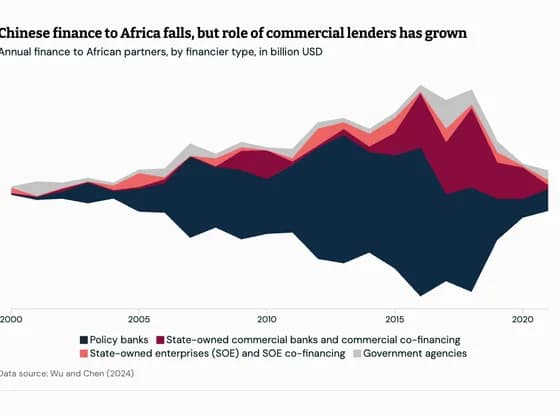 Line, bar and pie chartsChinese finance to Africa falls, but role of commercial lenders has grown
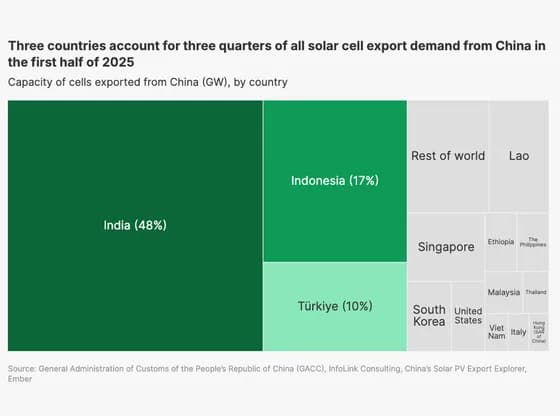 HierarchyThree countries account for three quarters of all solar cell export demand from China in the…
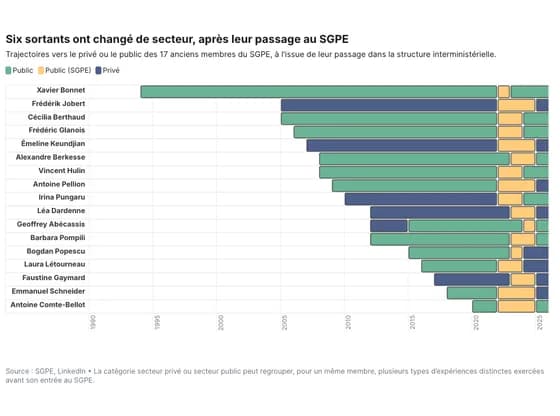 Gantt chartSix sortants ont changé de secteur, après leur passage au SGPE
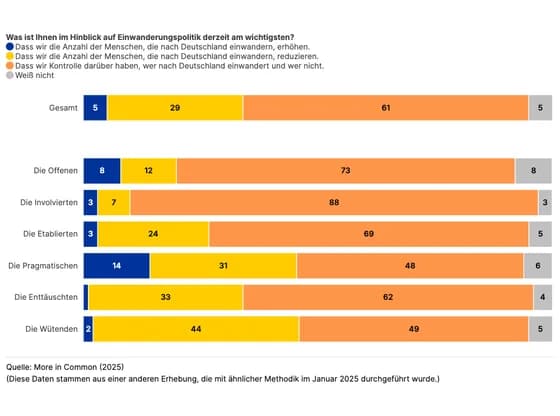 Line, bar and pie charts#348 E50- (ETM design) Kontrolle Erhöhen Reduzieren
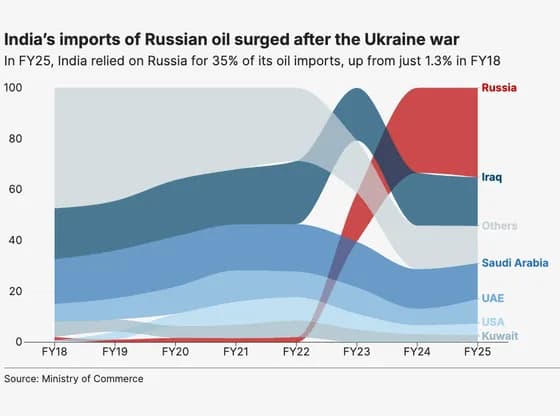 Line, bar and pie chartsIndia’s imports of Russian oil surged after the Ukraine war
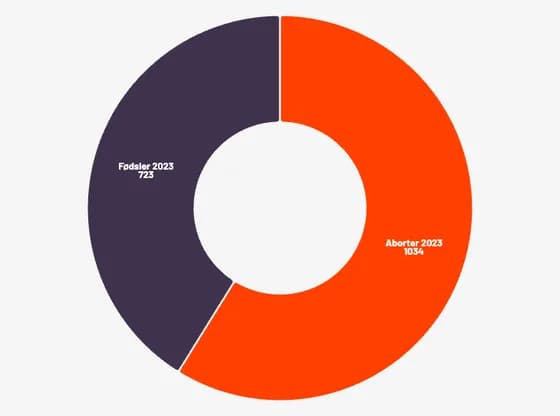 Line, bar and pie chartsI Grønland blev der i 2023 foretaget flere aborter end fødsler
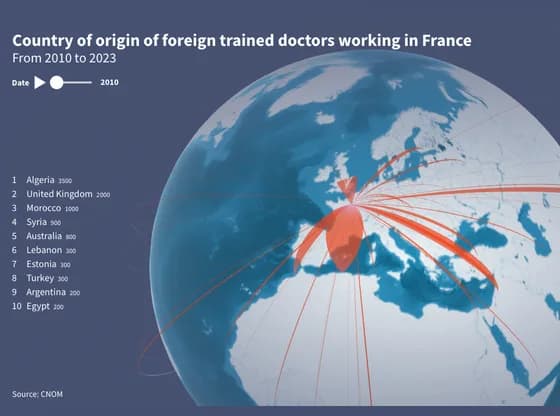 Connections and flow mapsCountry of origin of foreign trained doctors working in France
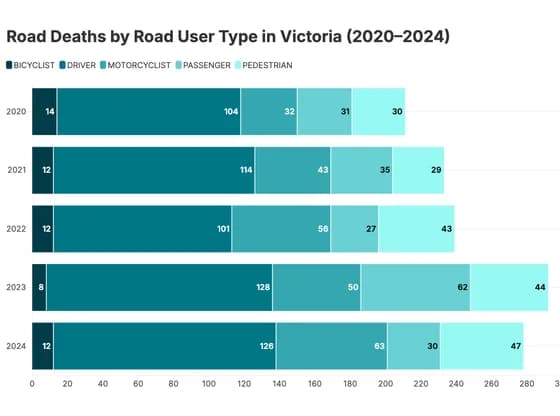 Line, bar and pie chartsRoad Deaths by Road User Type in Victoria (2020–2024)
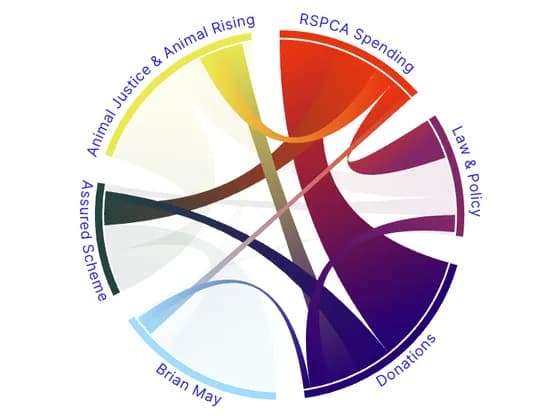 Network graphThe intersection (% overlap) between RSPCA Spending and Donating to the RSPCA September 2024
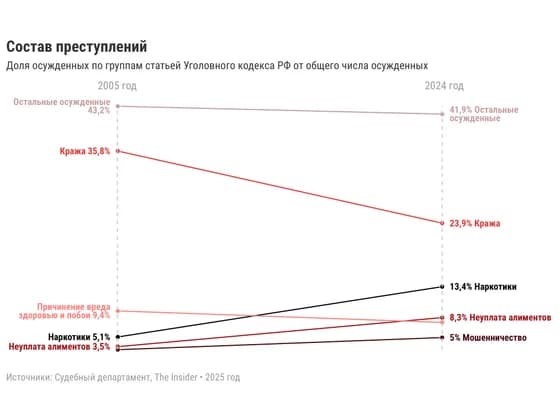 Slope chartСостав преступлений