
Every chart here started as a spreadsheet.
Maps, bar chart races, treemaps, pictograms and more. Open one and remake it with your own data.
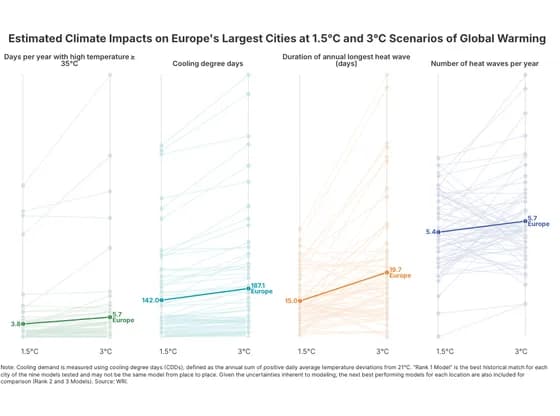 Slope chartEstimated Climate Impacts on Europe's Largest Cities at 1.5°C and 3°C Scenarios of Global Warming
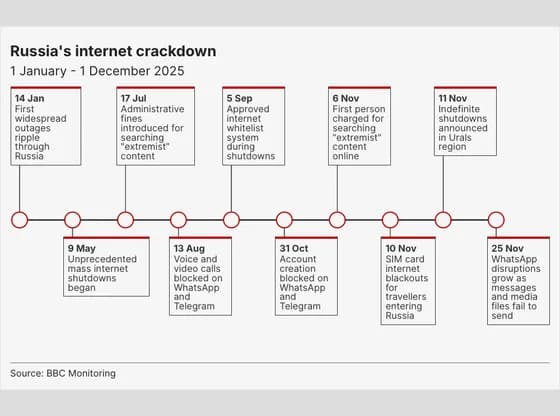 TimelineRussia's internet crackdown
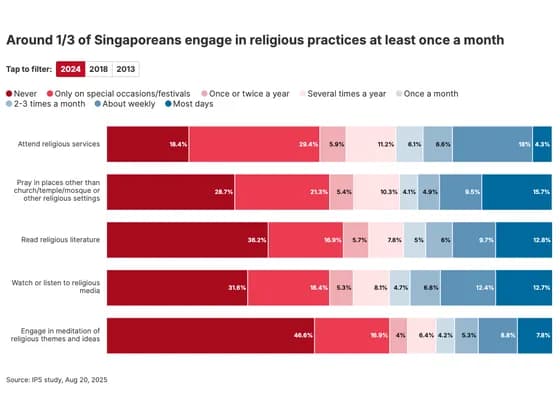 Line, bar and pie chartsAround 1/3 of Singaporeans engage in religious practices at least once a month
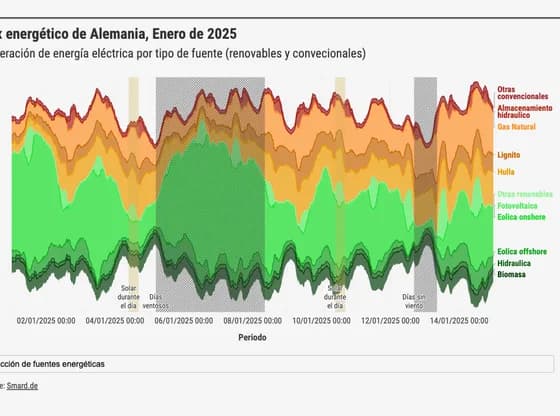 Line, bar and pie chartsMix energético de Alemania, Enero de 2025
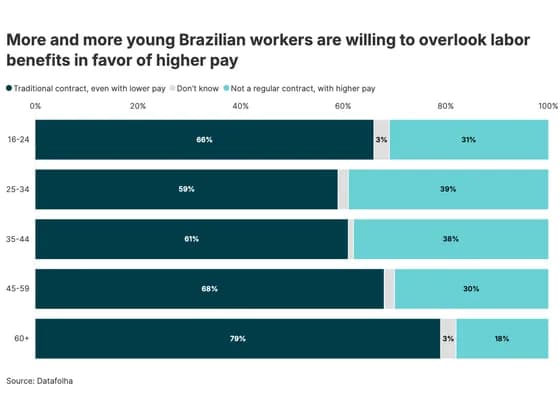 Line, bar and pie chartsMore and more young Brazilian workers are willing to overlook labor benefits in favor of higher pay
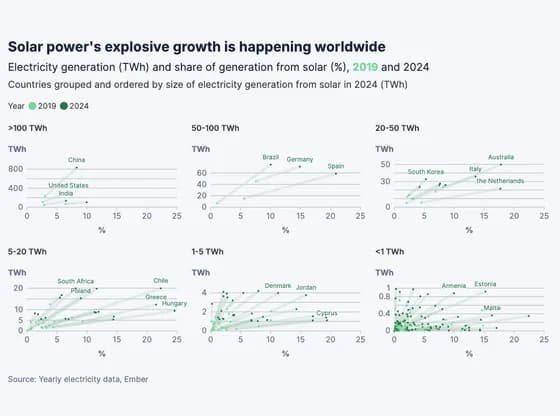 ScatterSolar power's explosive growth is happening worldwide
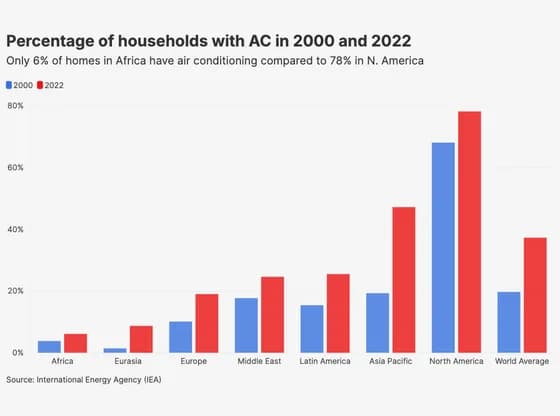 Line, bar and pie chartsPercentage of households with AC in 2000 and 2022
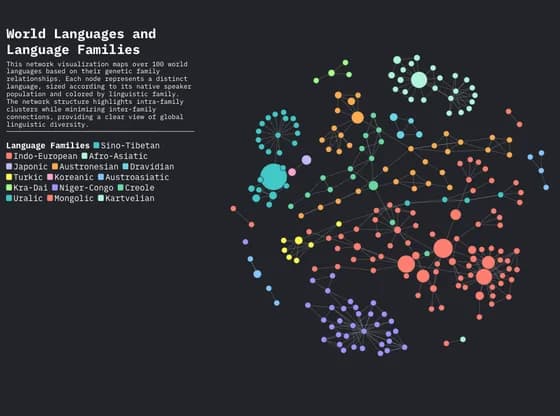 Network graphWorld Languages and Language Families
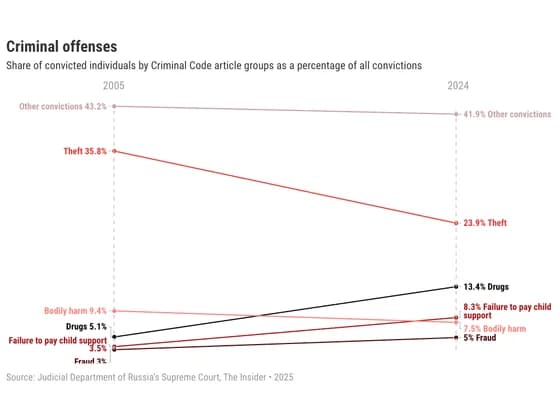 Slope chartCriminal offenses
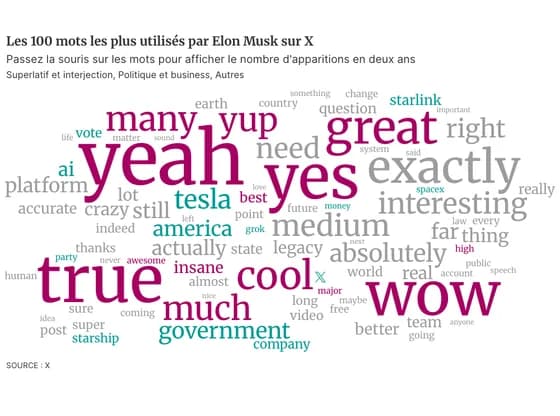 OtherLes 100 mots les plus utilisés par Elon Musk sur X
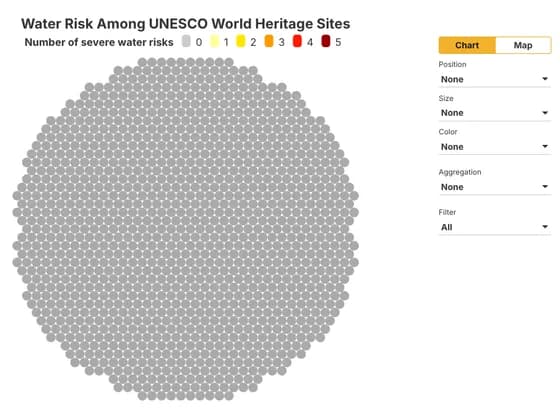 Interactive toolsWater Risk Among UNESCO World Heritage Sites
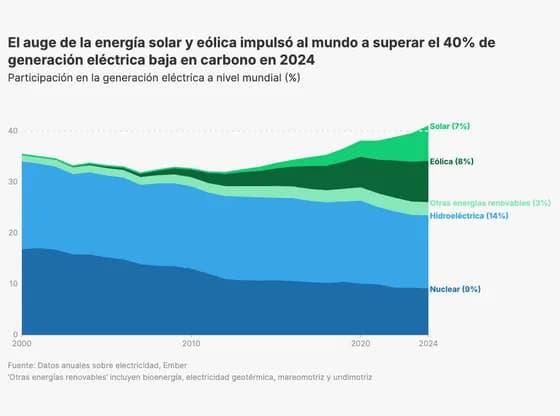 Line, bar and pie chartsEl auge de la energía solar y eólica impulsó al mundo a superar el 40% de generación eléctrica…
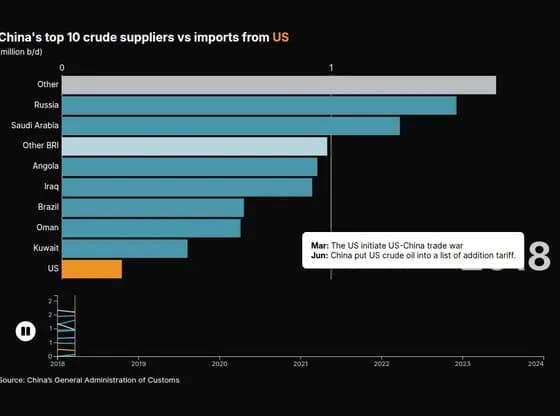 Animated chartsChina's top 10 crude suppliers vs imports from US
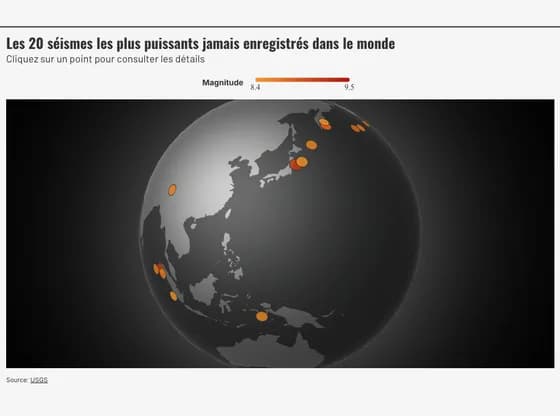 3D globeLes 20 séismes les plus puissants jamais enregistrés dans le monde
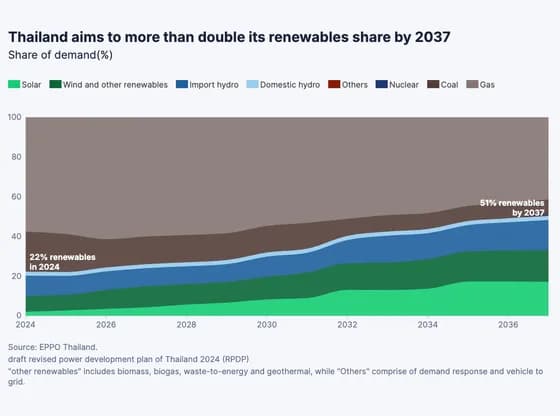 Line, bar and pie chartsThailand aims to more than double its renewables share by 2037
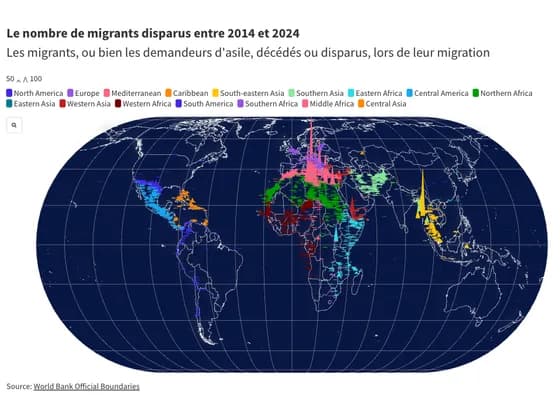 MapsLe nombre de migrants disparus entre 2014 et 2024
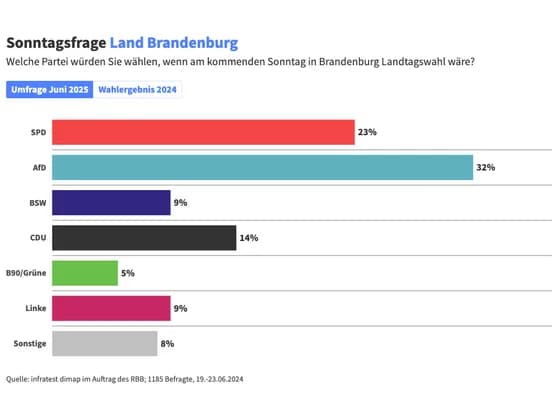 Line, bar and pie chartsSonntagsfrage Land Brandenburg
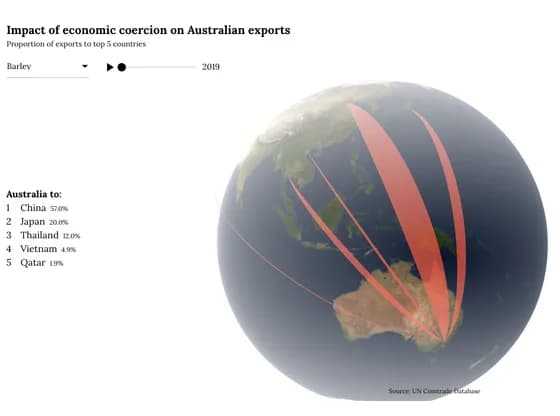 Connections and flow mapsImpact of economic coercion on Australian exports
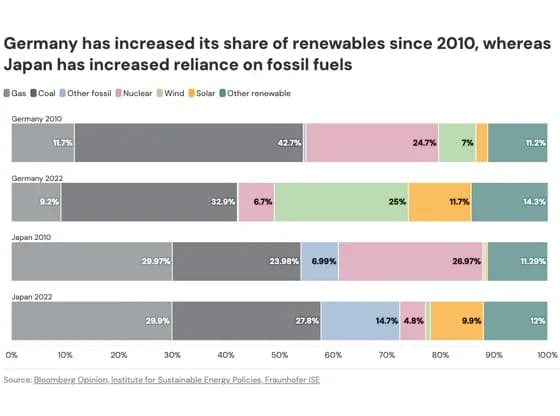 Line, bar and pie chartsGermany has increased its share of renewables since 2010, whereas Japan has increased reliance…
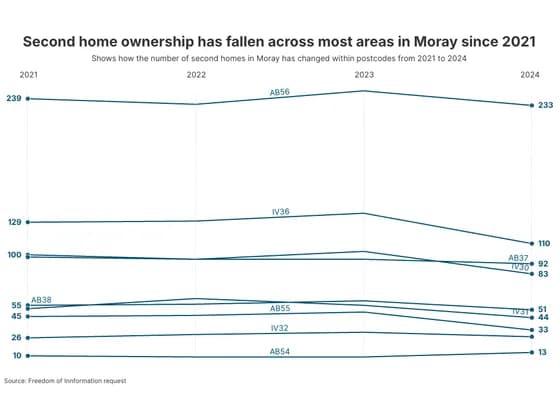 Slope chartSecond home ownership has fallen across most areas in Moray since 2021