
Every chart here started as a spreadsheet.
Maps, bar chart races, treemaps, pictograms and more. Open one and remake it with your own data.
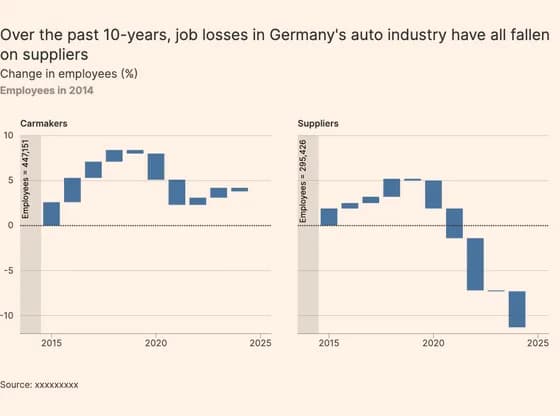 Line, bar and pie chartsOver the past 10-years, job losses in Germany's auto industry have all fallen on suppliers
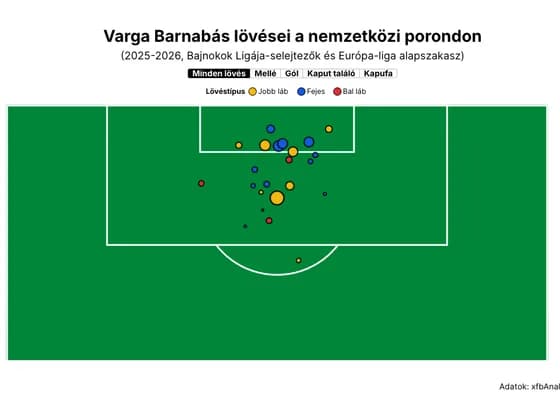 SportsVarga Barnabás lövései a nemzetközi porondon
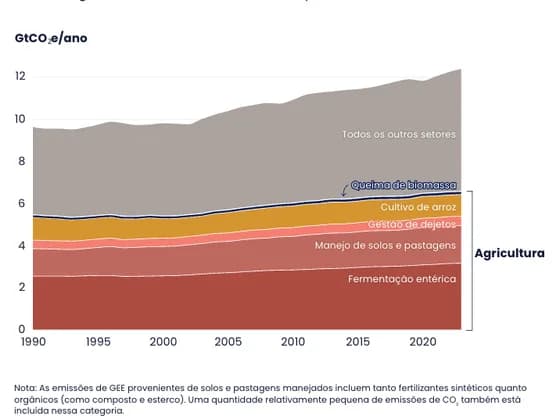 Interactive SVGA agricultura é responsável por mais da metade das emissões de metano e óxido nitroso
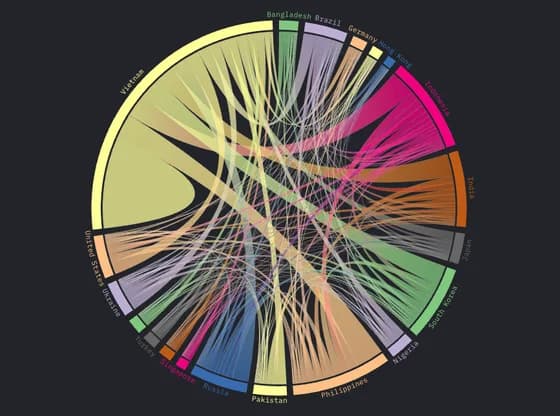 Network graphSentry Node Connection Chord Graph
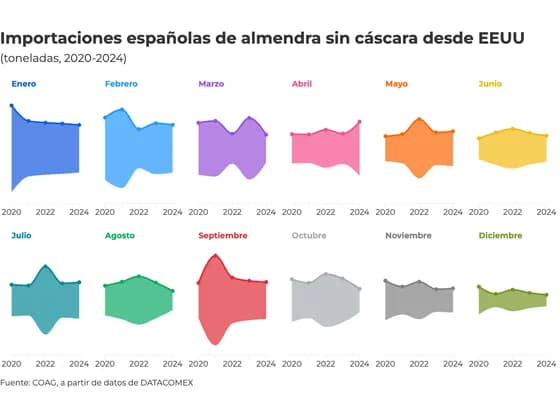 Line, bar and pie chartsImportaciones españolas de almendra sin cáscara desde EEUU
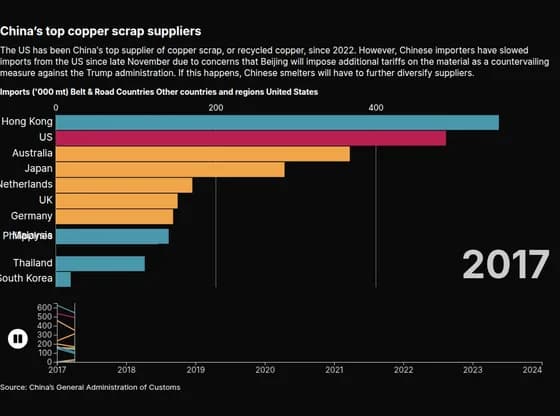 Animated chartsChina’s top copper scrap suppliers
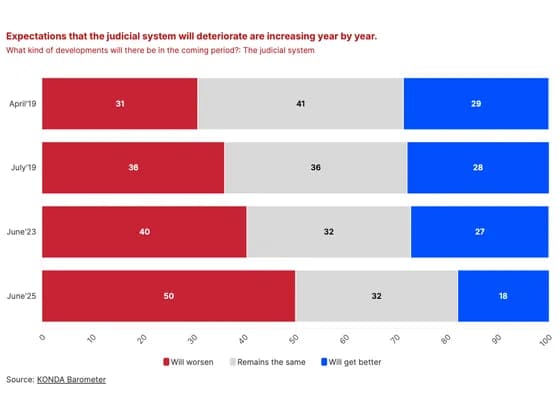 Line, bar and pie chartsExpectations that the judicial system will deteriorate are increasing year by year.
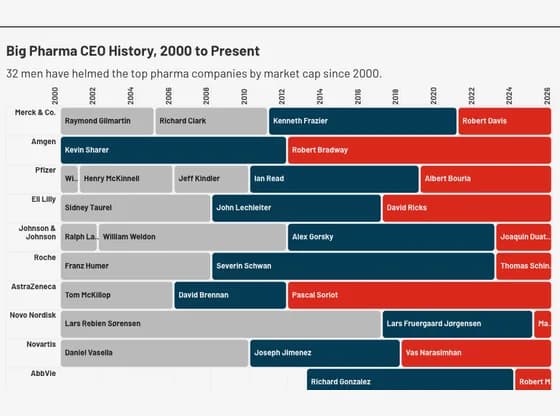 Gantt chartBig Pharma CEO History, 2000 to Present
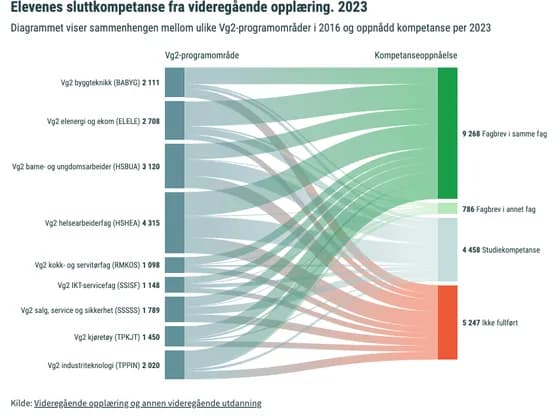 Sankey diagramElevenes sluttkompetanse fra videregående opplæring. 2023
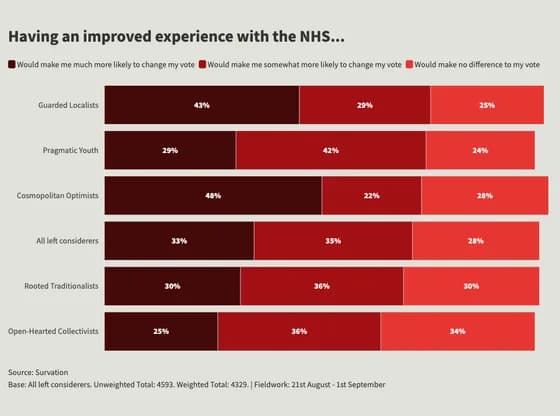 Line, bar and pie chartsHaving an improved experience with the NHS...
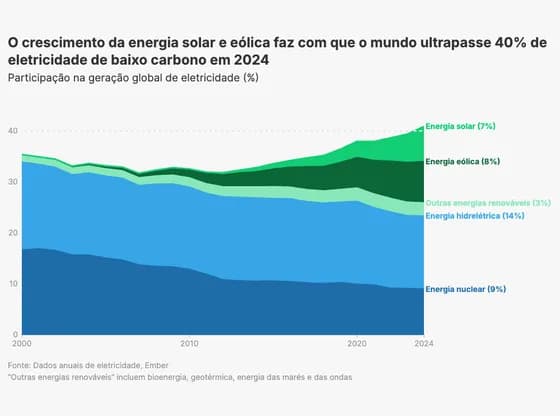 Line, bar and pie chartsO crescimento da energia solar e eólica faz com que o mundo ultrapasse 40% de eletricidade de…
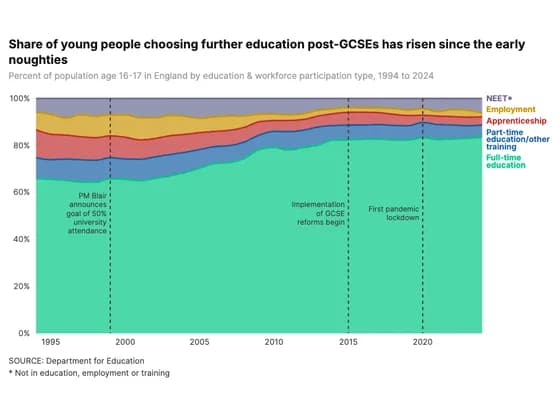 Line, bar and pie chartsShare of young people choosing further education post-GCSEs has risen since the early noughties
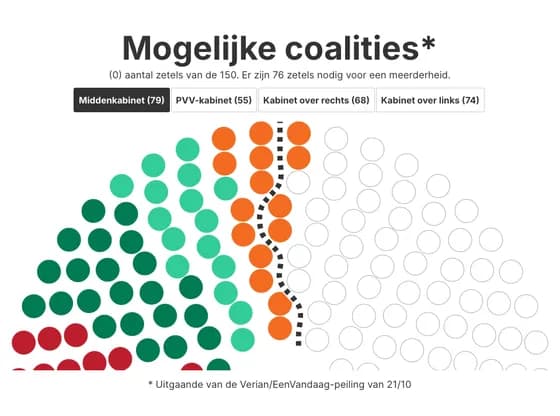 Elections and parliamentsMogelijke coalities*
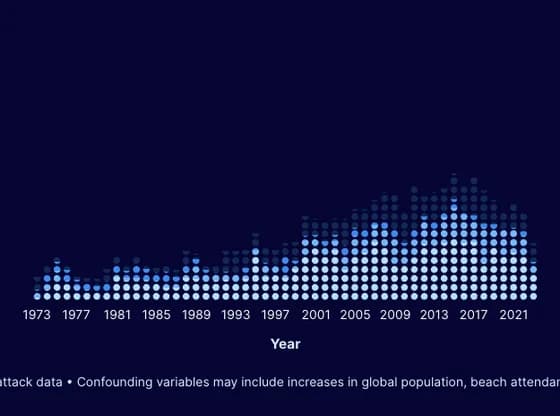 PictogramAre Shark attacks on the up?
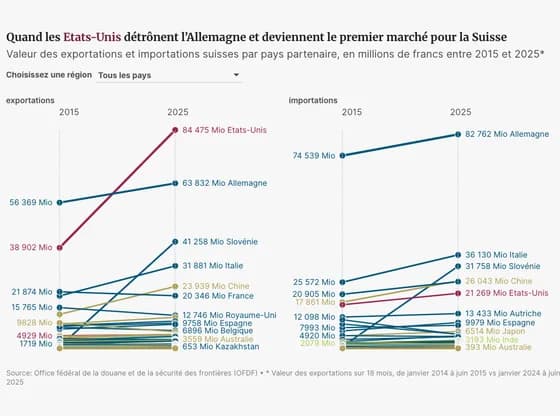 Slope chartQuand les Etats-Unis détrônent l’Allemagne et deviennent le premier marché pour la Suisse
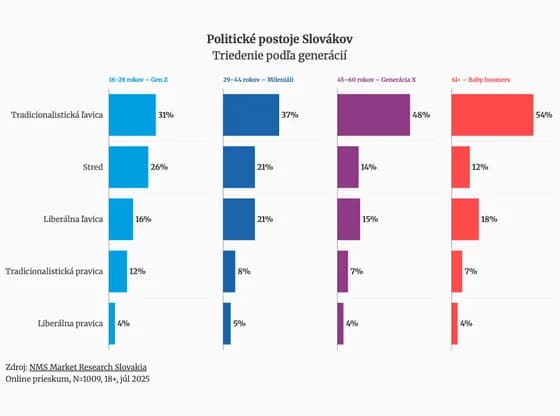 Line, bar and pie chartsPolitické postoje Slovákov
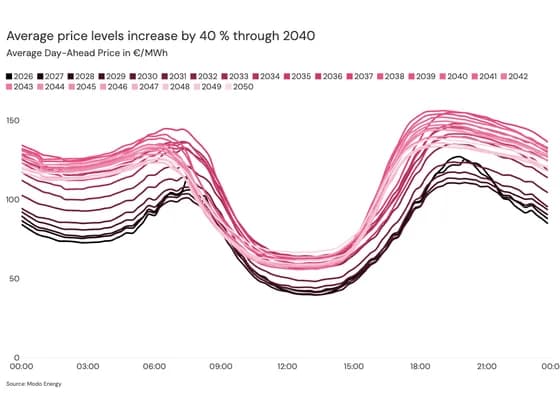 Line, bar and pie chartsAverage price levels increase by 40 % through 2040
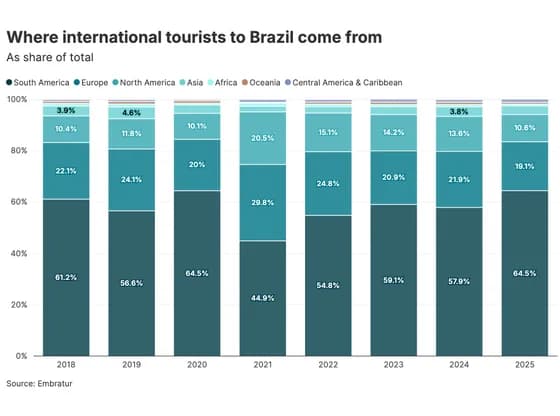 Line, bar and pie chartsWhere international tourists to Brazil come from
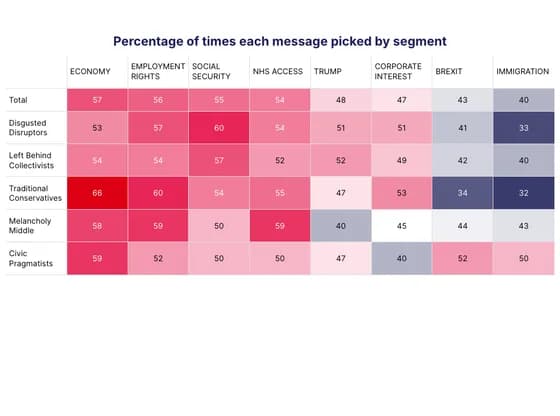 TablePercentage of times each message picked by segment
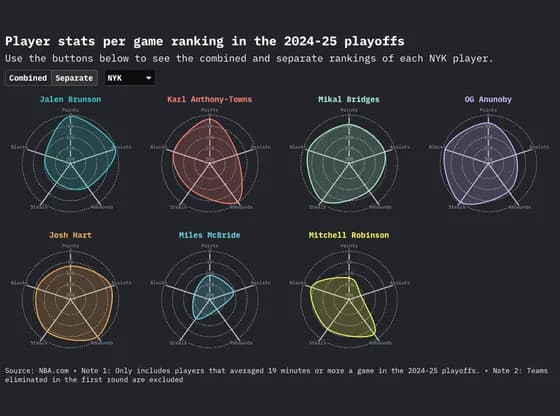 Radar chartPlayer stats per game ranking in the 2024-25 playoffs