
Every chart here started as a spreadsheet.
Maps, bar chart races, treemaps, pictograms and more. Open one and remake it with your own data.
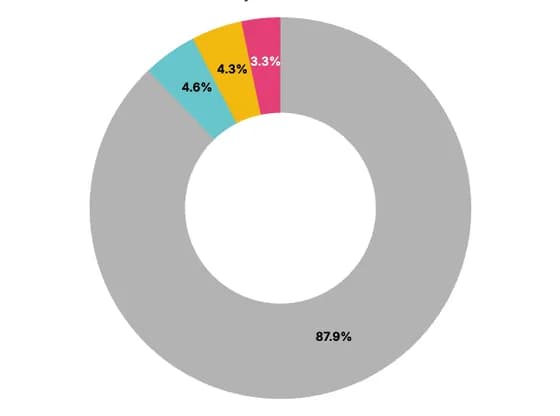 Line, bar and pie chartsCoal accounts for the largest share at ~88% of total generation
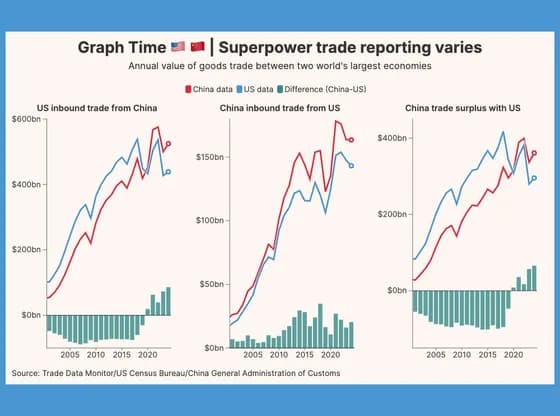 Line, bar and pie chartsGraph Time 🇺🇸 🇨🇳 | Superpower trade reporting varies
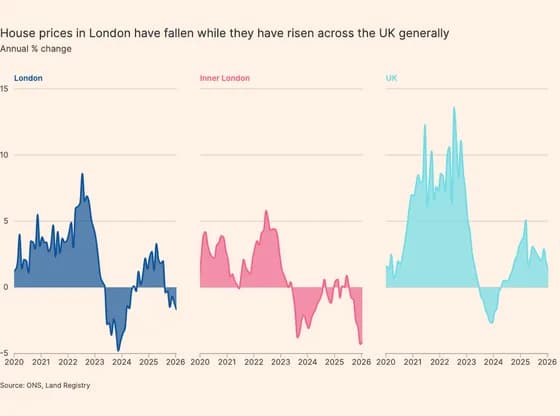 Line, bar and pie chartsHouse prices in London have fallen while they have risen across the UK generally
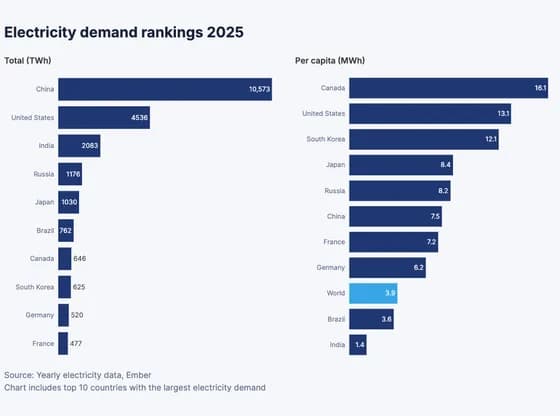 Line, bar and pie chartsElectricity demand rankings 2025
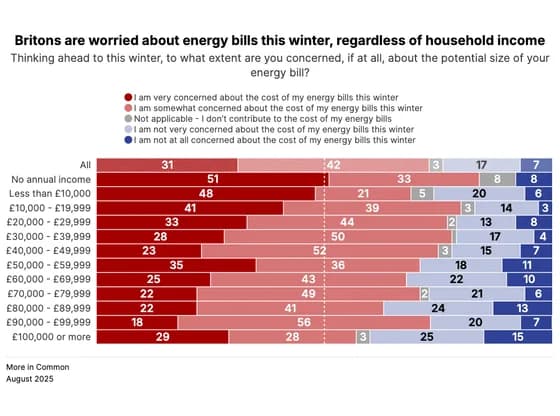 Line, bar and pie chartsBritons are worried about energy bills this winter, regardless of household income
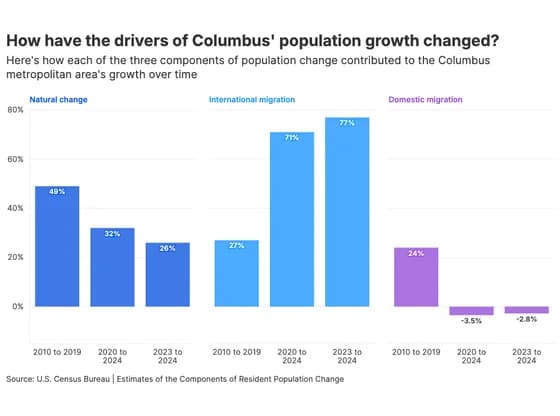 Line, bar and pie chartsHow have the drivers of Columbus' population growth changed?
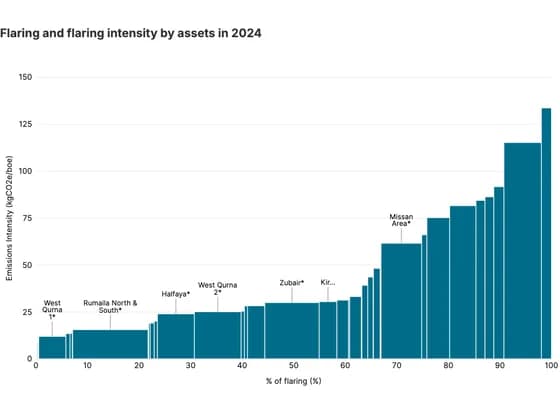 MarimekkoFlaring and flaring intensity by assets in 2024
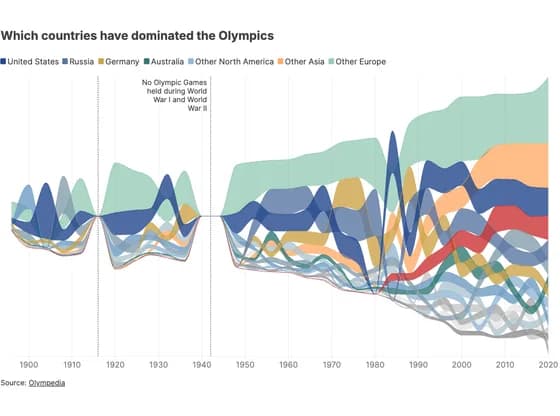 Line, bar and pie chartsWhich countries have dominated the Olympics
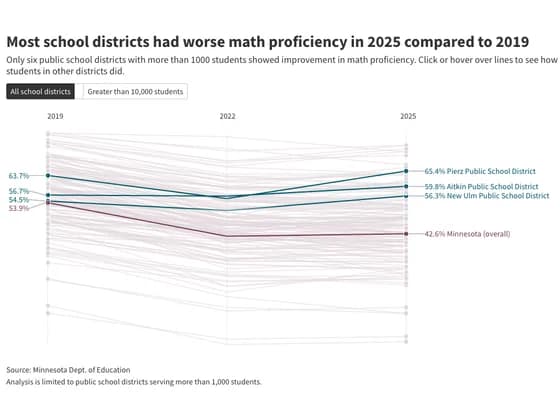 Slope chartMost school districts had worse math proficiency in 2025 compared to 2019
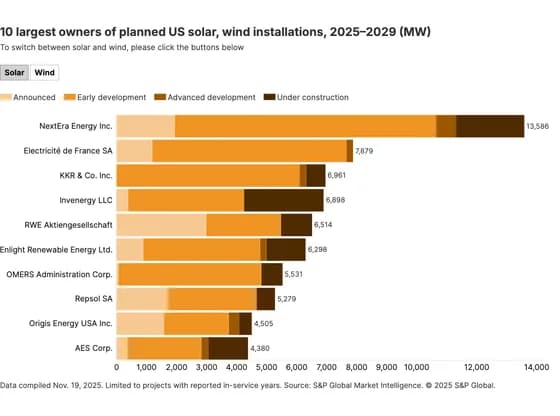 Line, bar and pie charts10 largest owners of planned US solar, wind installations, 2025–2029 (MW)
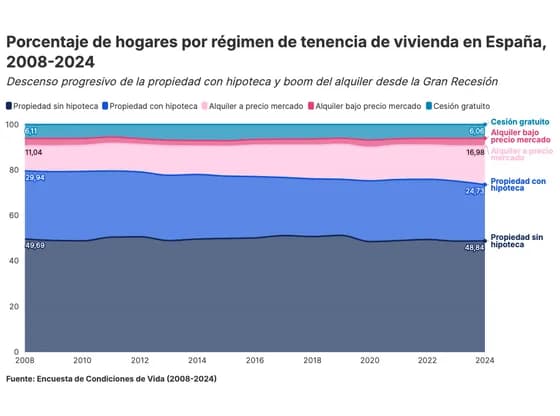 Line, bar and pie chartsPorcentaje de hogares por régimen de tenencia de vivienda en España, 2008-2024
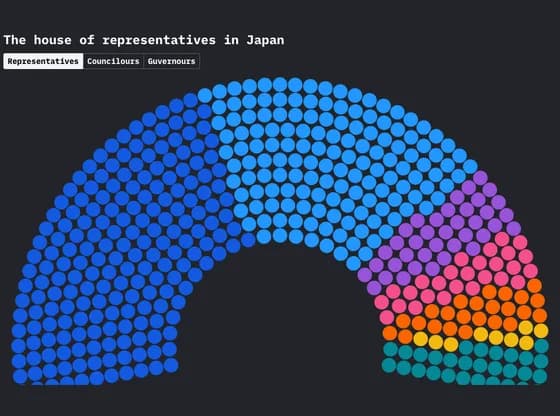 Elections and parliamentsThe house of representatives in Japan
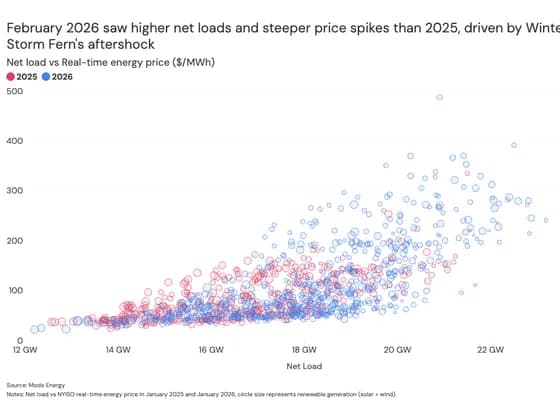 ScatterFebruary 2026 saw higher net loads and steeper price spikes than 2025, driven by Winter Storm…
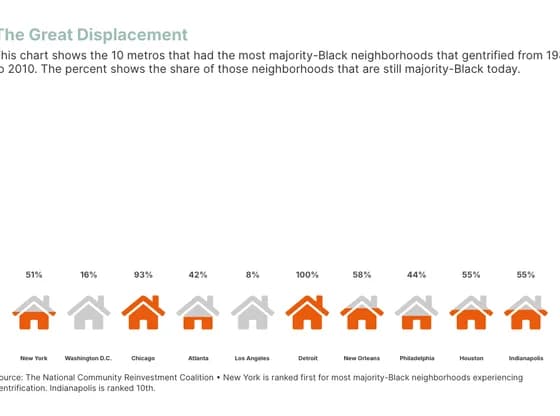 PictogramThe Great Displacement
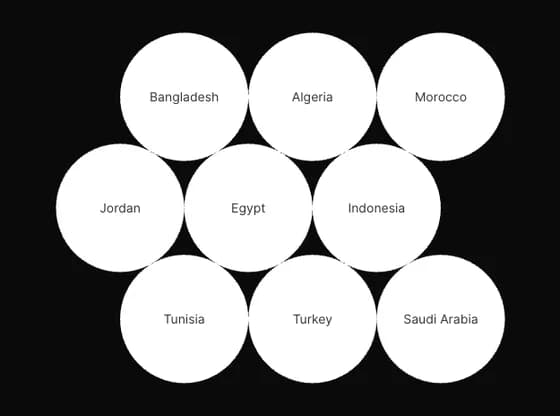 Interactive toolsThe wheat supply chain, from mills to bakeries
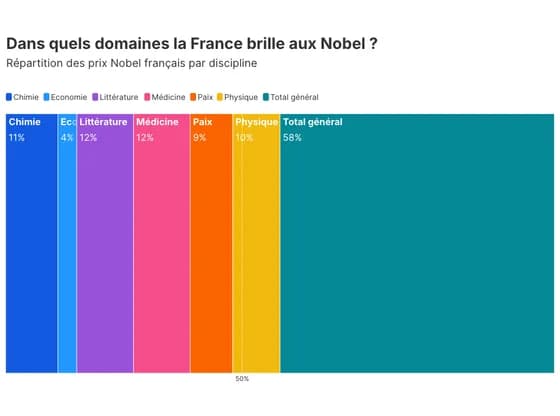 Elections and parliamentsDans quels domaines la France brille aux Nobel ?
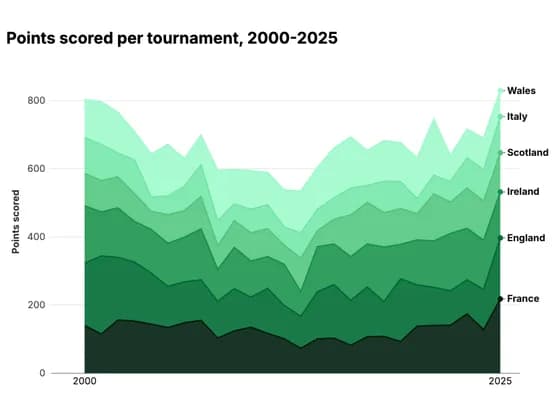 Line, bar and pie chartsPoints scored per tournament, 2000-2025
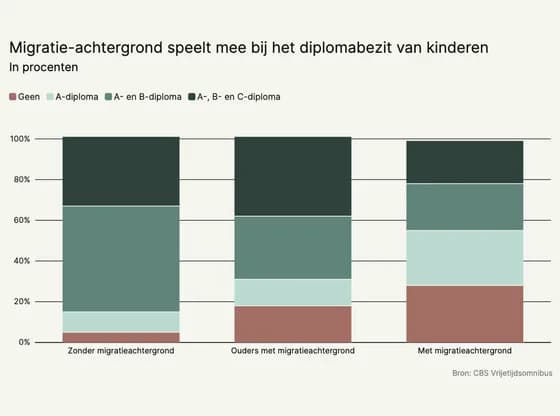 Line, bar and pie chartsMigratie-achtergrond speelt mee bij het diplomabezit van kinderen
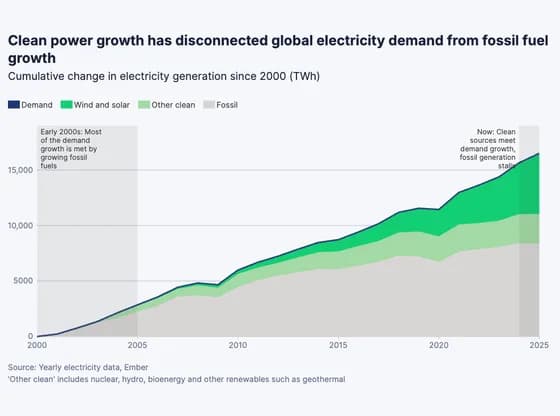 Line, bar and pie chartsClean power growth has disconnected global electricity demand from fossil fuel growth
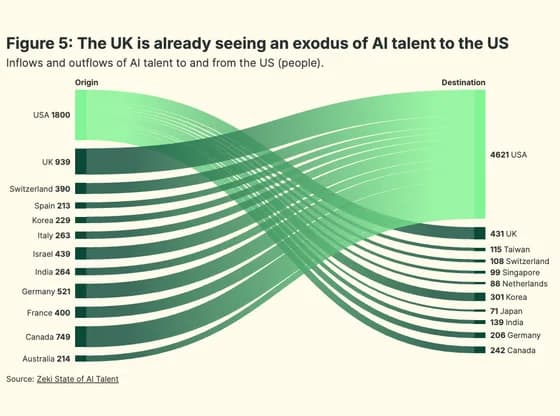 Sankey diagramFigure 5: The UK is already seeing an exodus of AI talent to the US