
Every chart here started as a spreadsheet.
Maps, bar chart races, treemaps, pictograms and more. Open one and remake it with your own data.
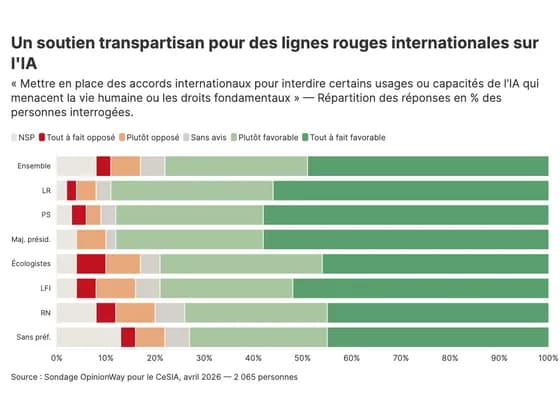 Line, bar and pie chartsUn soutien transpartisan pour des lignes rouges internationales sur l'IA
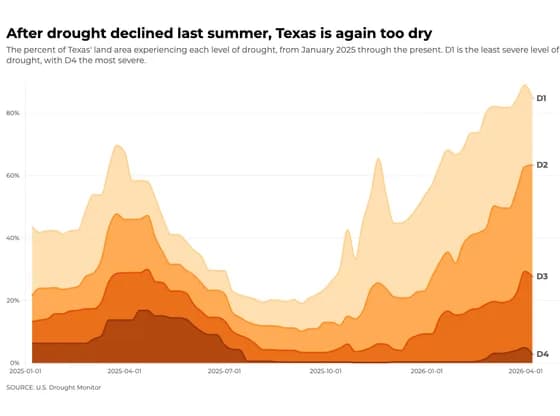 Line, bar and pie chartsAfter drought declined last summer, Texas is again too dry
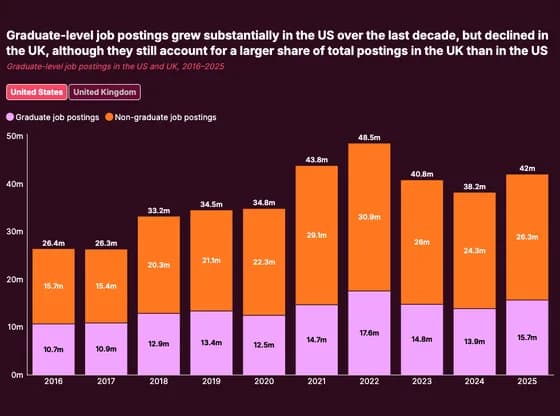 Line, bar and pie chartsGraduate-level job postings grew substantially in the US over the last decade, but declined in…
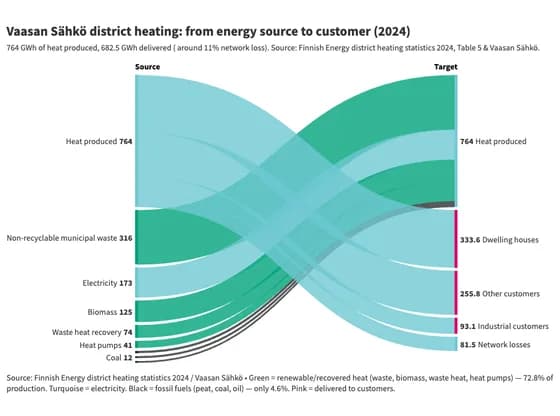 Sankey diagramVaasan Sähkö district heating: from energy source to customer (2024)
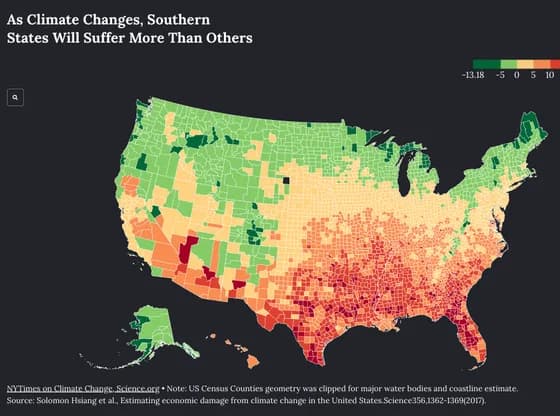 MapsAs Climate Changes, Southern States Will Suffer More Than Others
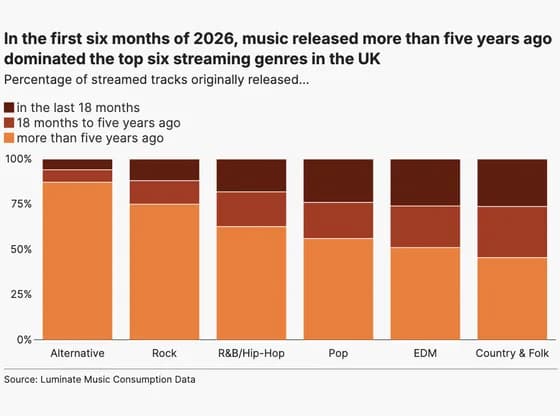 Line, bar and pie chartsIn the first six months of 2026, music released more than five years ago dominated the top six…
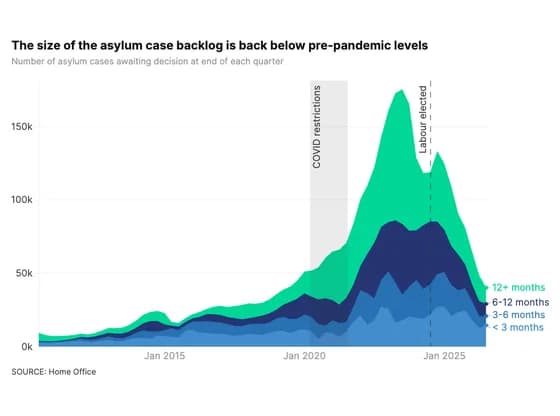 Line, bar and pie chartsThe size of the asylum case backlog is back below pre-pandemic levels
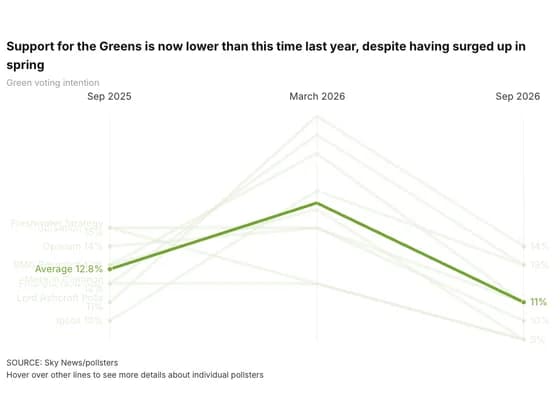 Slope chartSupport for the Greens is now lower than this time last year, despite having surged up in spring
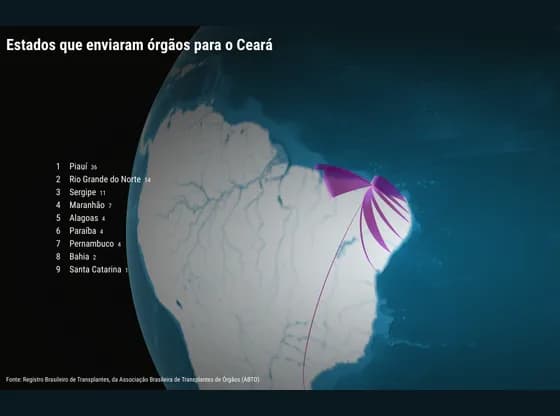 Connections and flow mapsEstados que enviaram órgãos para o Ceará
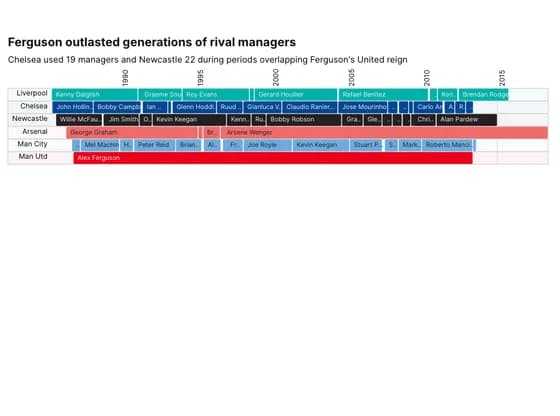 Gantt chartFerguson outlasted generations of rival managers
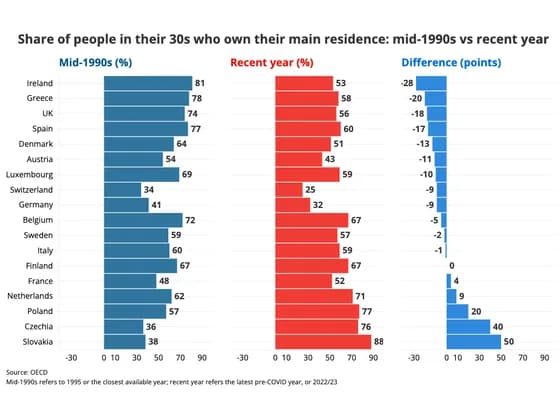 Line, bar and pie chartsShare of people in their 30s who own their main residence: mid-1990s vs recent year
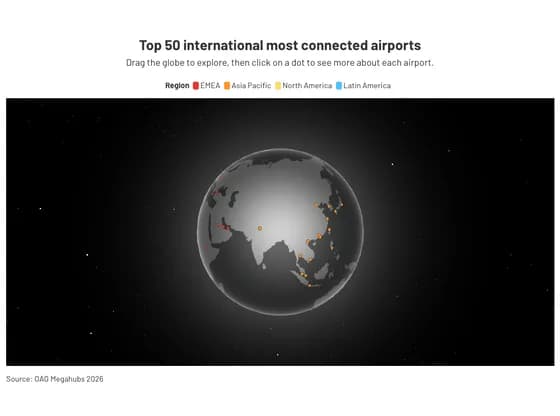 3D globeTop 50 international most connected airports
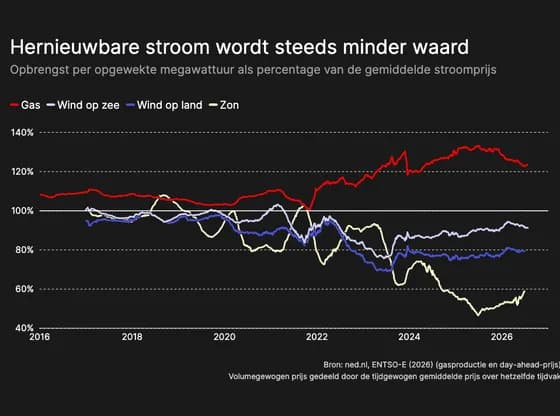 Line, bar and pie chartsHernieuwbare stroom wordt steeds minder waard
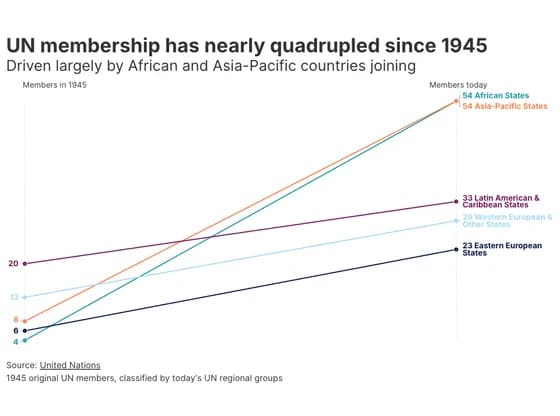 Slope chartUN membership has nearly quadrupled since 1945
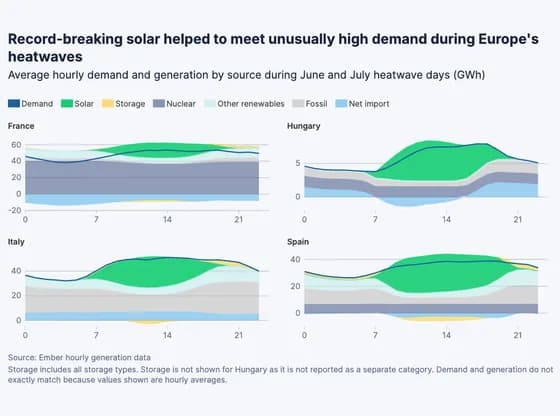 Line, bar and pie chartsRecord-breaking solar helped to meet unusually high demand during Europe's heatwaves
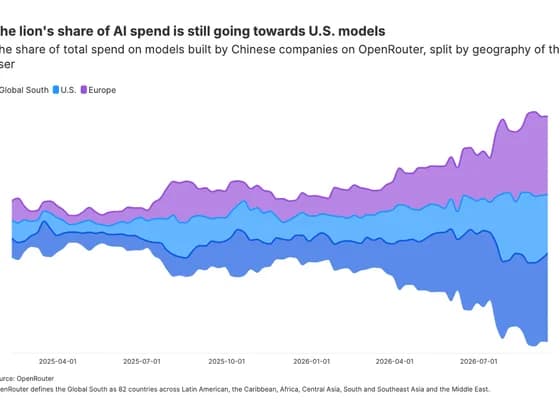 Line, bar and pie chartsThe lion's share of AI spend is still going towards U.S. models
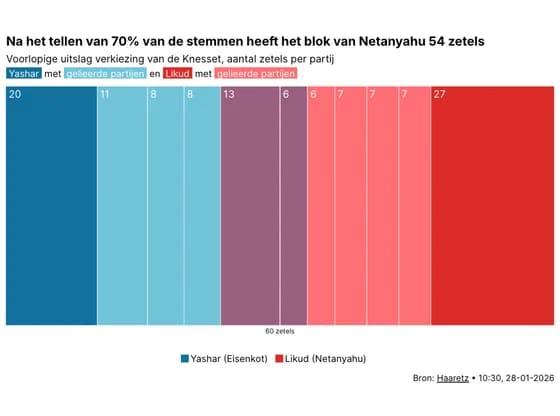 Elections and parliamentsNa het tellen van 70% van de stemmen heeft het blok van Netanyahu 54 zetels
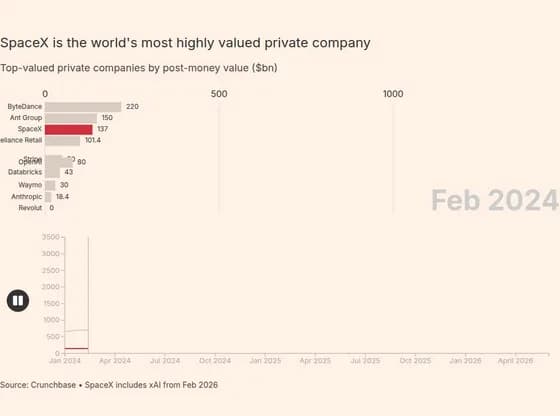 Animated chartsSpaceX is the world's most highly valued private company
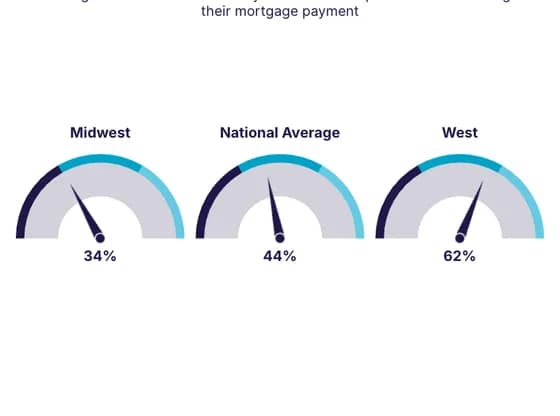 Counters and gaugesWhen Insurance Rivals the Mortgage
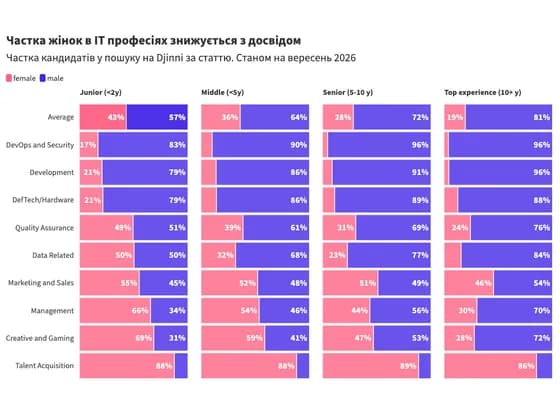 Line, bar and pie chartsЧастка жінок в IT професіях знижується з досвідом