
Every chart here started as a spreadsheet.
Maps, bar chart races, treemaps, pictograms and more. Open one and remake it with your own data.
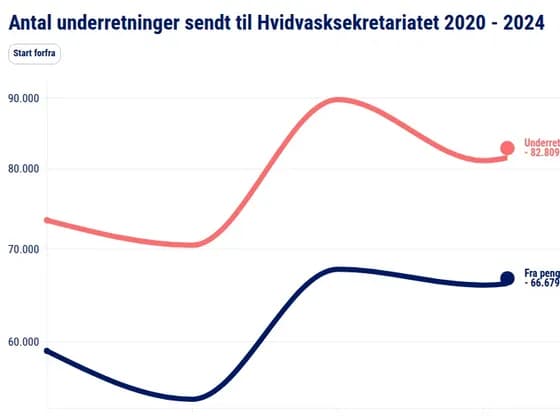 Animated chartsAntal underretninger sendt til Hvidvasksekretariatet 2020 - 2024
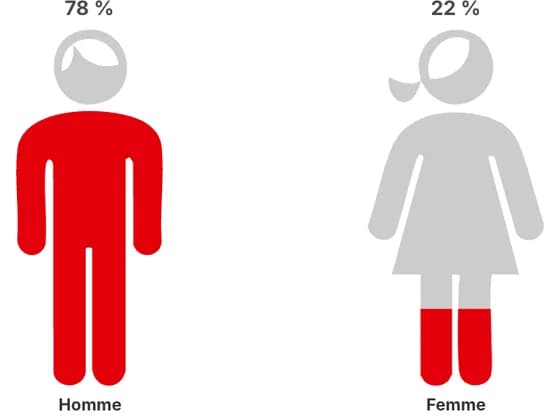 PictogramPrès de 4 tués sur 5 sont des hommes
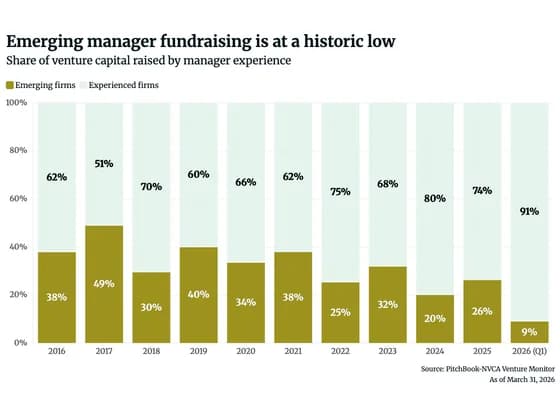 Line, bar and pie chartsEmerging manager fundraising is at a historic low
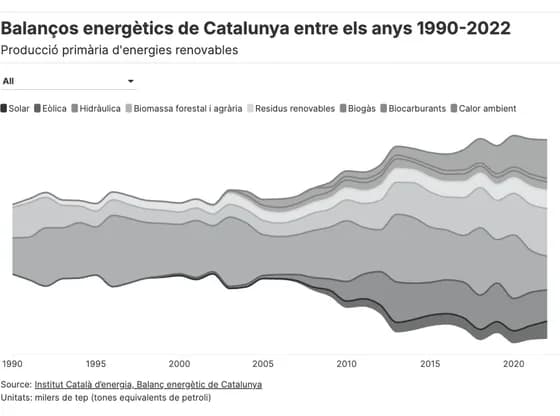 Line, bar and pie chartsBalanços energètics de Catalunya entre els anys 1990-2022
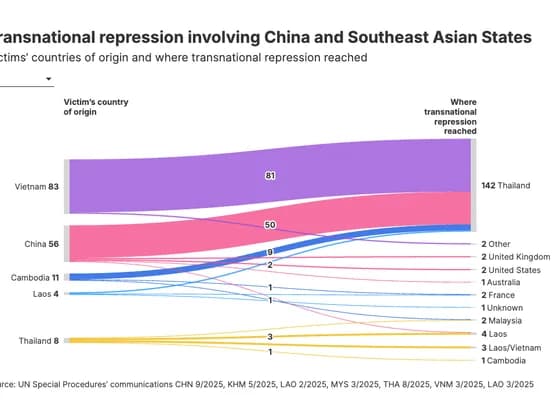 Sankey diagramTransnational repression involving China and Southeast Asian States
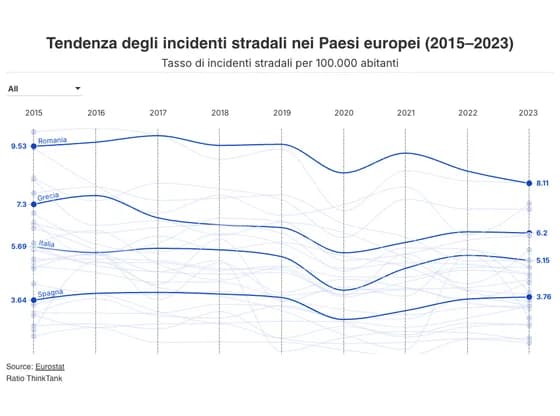 Slope chartTendenza degli incidenti stradali nei Paesi europei (2015–2023)
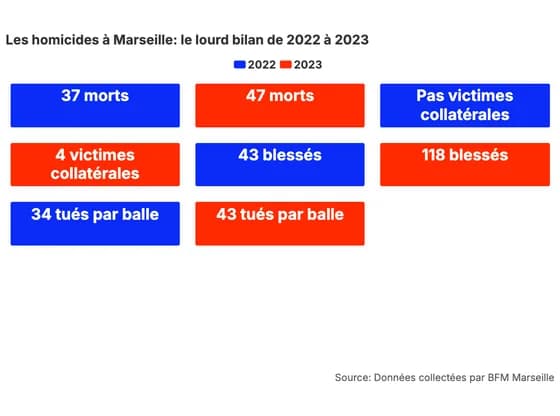 CardsLes homicides à Marseille: le lourd bilan de 2022 à 2023
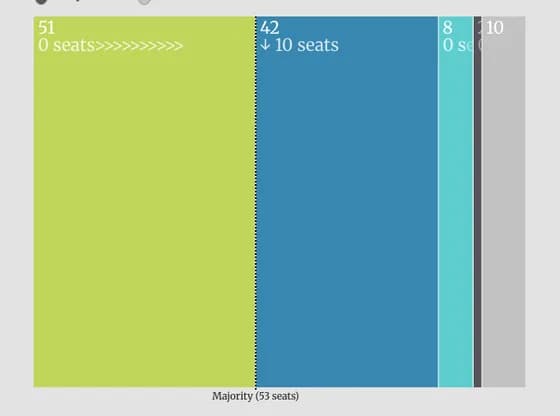 Elections and parliamentsLegislative Yuan seats by party(after July 26, 2025)
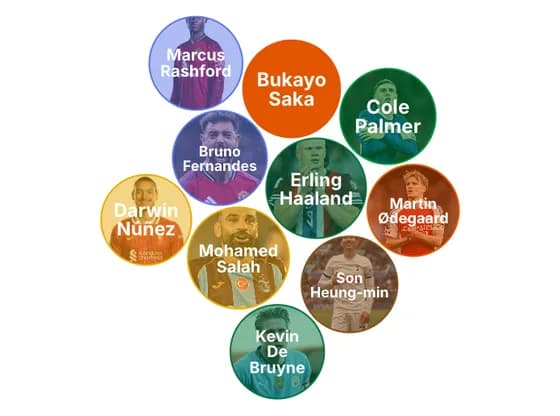 Distribution chartsRank the most popular players in the Premier League 2025
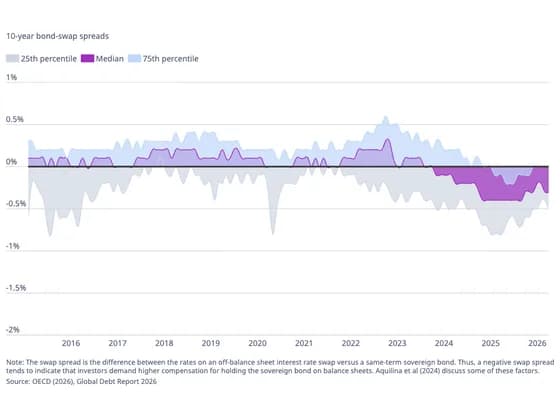 Line, bar and pie charts10-year bond-swap spreads
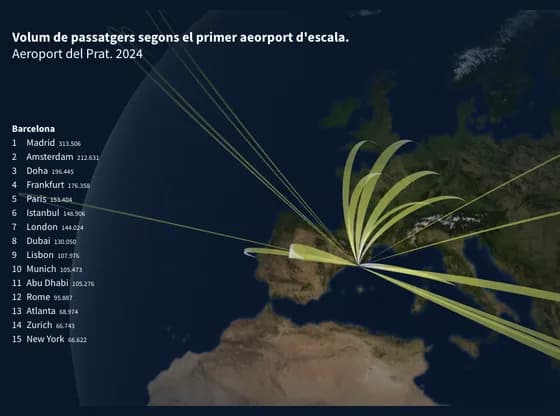 Connections and flow mapsVolum de passatgers segons el primer aeorport d'escala.
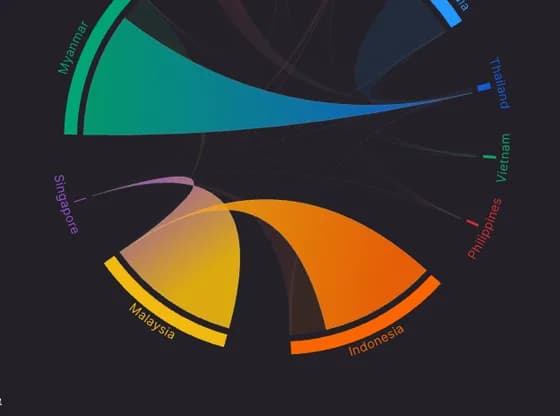 Network graphMigration flows across Southeast Asia, 2005
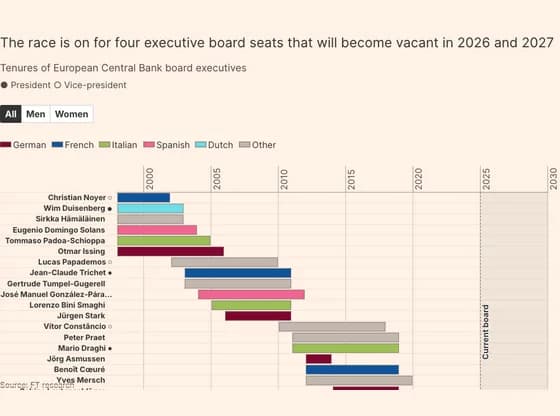 Gantt chartThe race is on for four executive board seats that will become vacant in 2026 and 2027
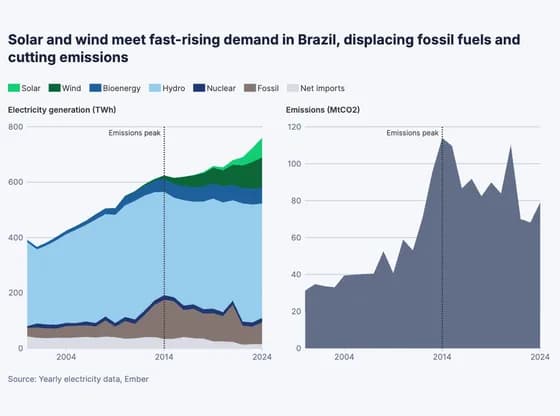 Line, bar and pie chartsSolar and wind meet fast-rising demand in Brazil, displacing fossil fuels and cutting emissions
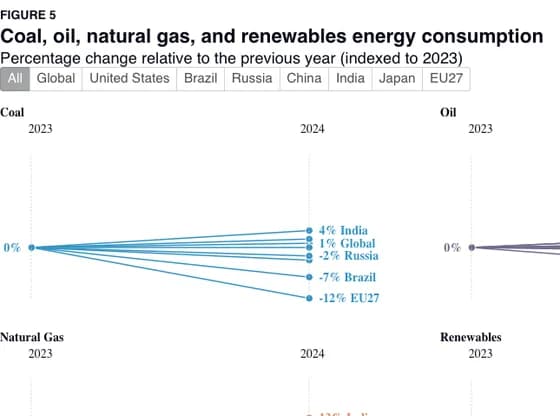 Slope chartFIGURE 5 Coal, oil, natural gas, and renewables energy consumption
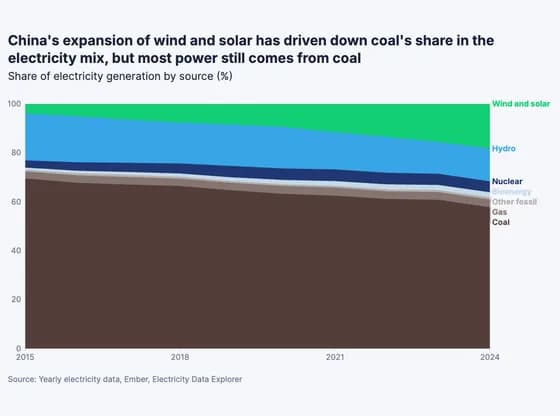 Line, bar and pie chartsChina's expansion of wind and solar has driven down coal's share in the electricity mix, but…
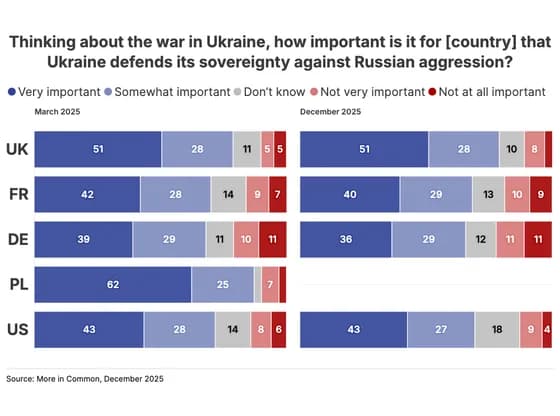 Line, bar and pie charts#337 TRACKER important_forcountry
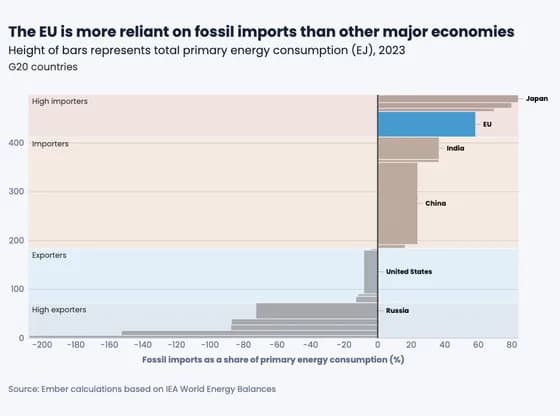 MarimekkoThe EU is more reliant on fossil imports than other major economies
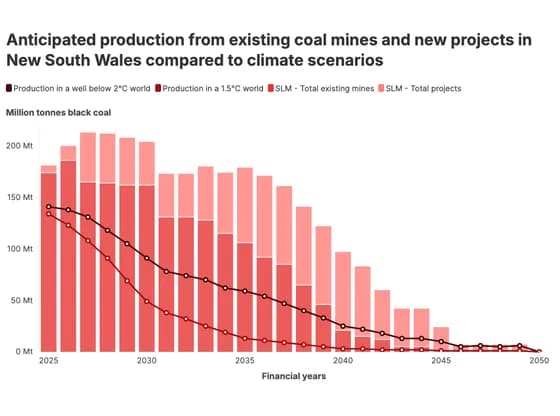 Line, bar and pie chartsAnticipated production from existing coal mines and new projects in New South Wales compared to…
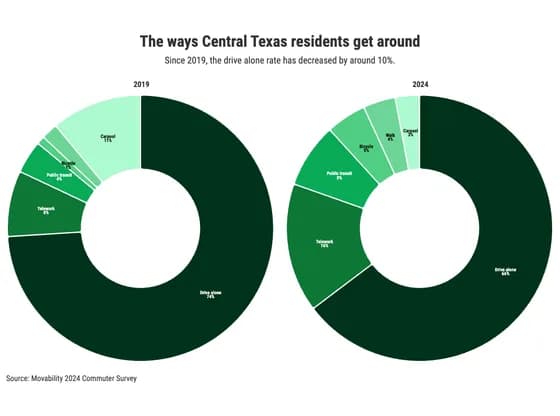 Line, bar and pie chartsThe ways Central Texas residents get around