
Every chart here started as a spreadsheet.
Maps, bar chart races, treemaps, pictograms and more. Open one and remake it with your own data.
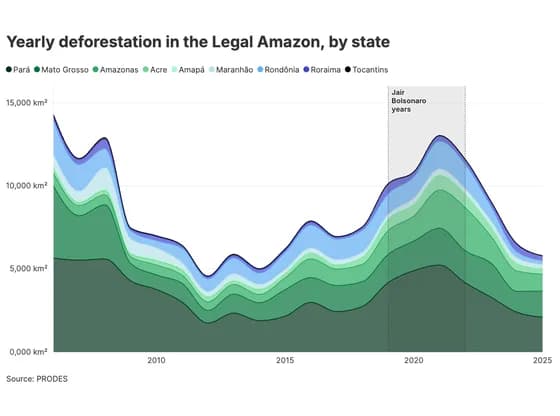 Line, bar and pie chartsYearly deforestation in the Legal Amazon, by state
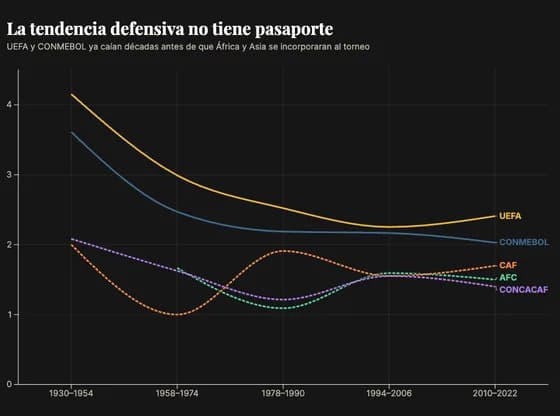 Line, bar and pie chartsLa tendencia defensiva no tiene pasaporte
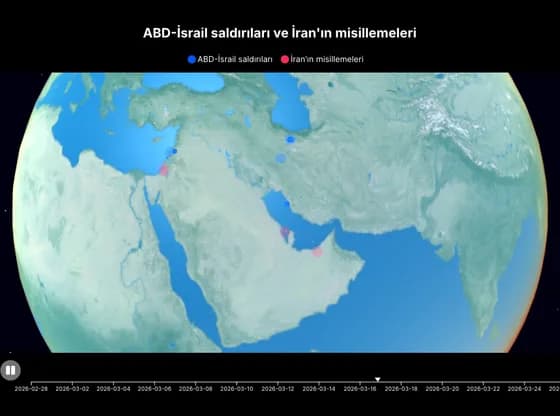 3D globeABD-İsrail saldırıları ve İran'ın misillemeleri
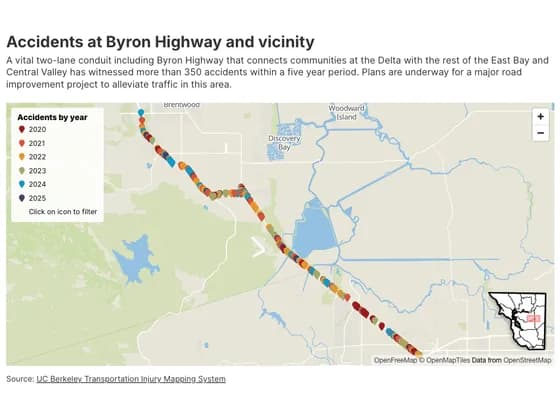 3D mapAccidents at Byron Highway and vicinity
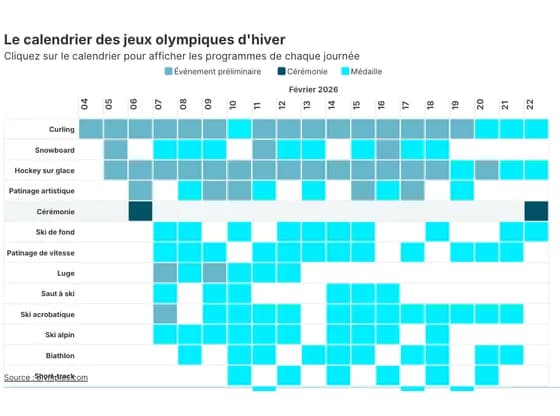 Gantt chartLe calendrier des jeux olympiques d'hiver
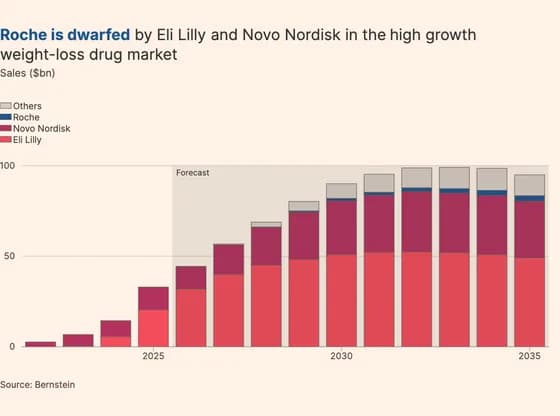 Line, bar and pie chartsRoche is dwarfed by Eli Lilly and Novo Nordisk in the high growth weight-loss drug market
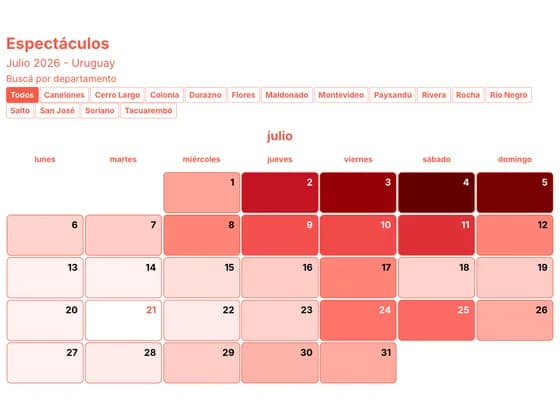 3D plotsEspectáculos
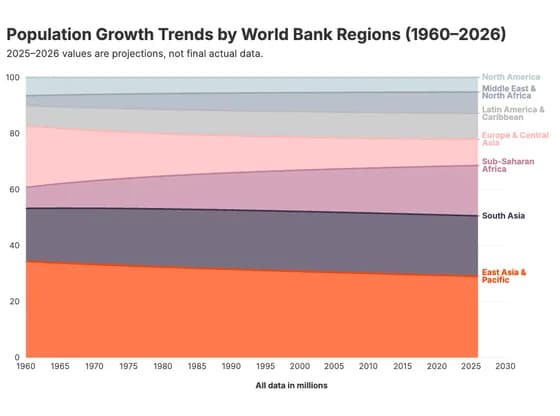 Line, bar and pie chartsPopulation Growth Trends by World Bank Regions (1960–2026)
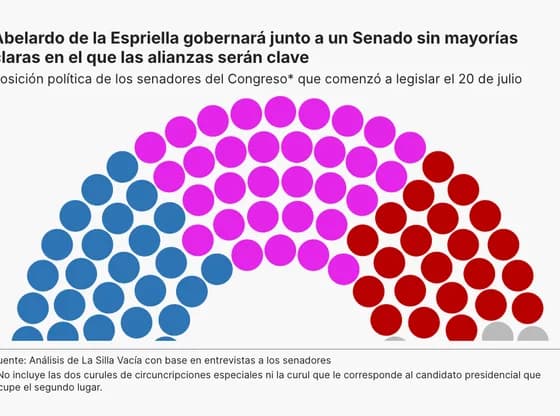 Elections and parliamentsAbelardo de la Espriella gobernará junto a un Senado sin mayorías claras en el que las alianzas…
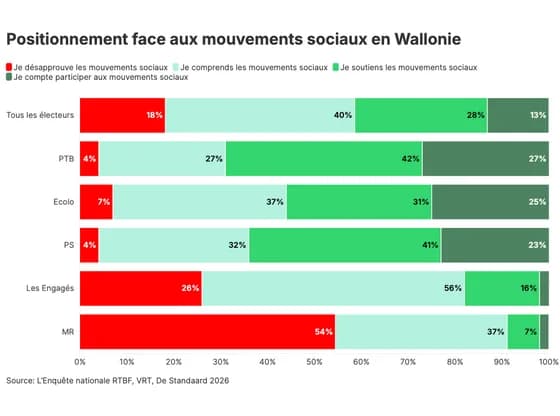 Line, bar and pie chartsPositionnement face aux mouvements sociaux en Wallonie
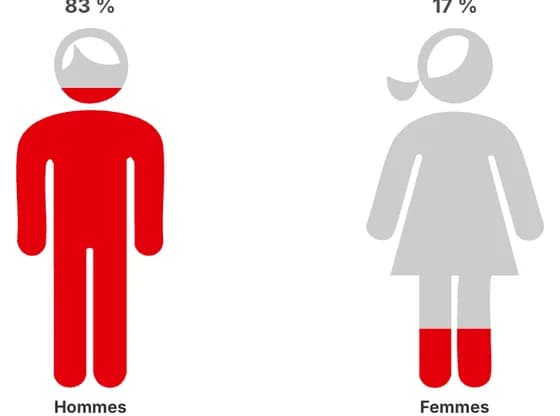 PictogramProportion de maires élus en 2020, selon leur genre
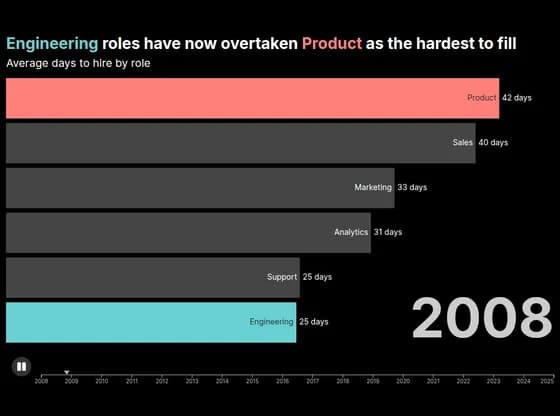 Animated chartsEngineering roles have now overtaken Product as the hardest to fill
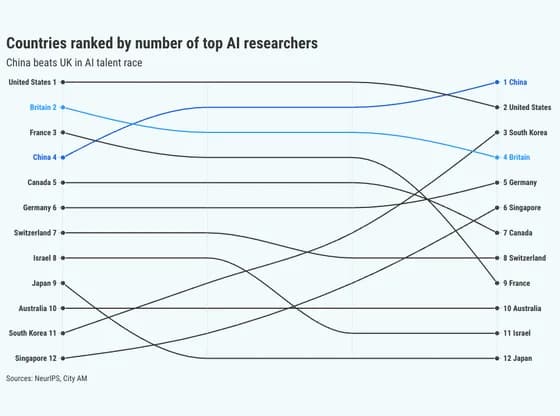 Slope chartCountries ranked by number of top AI researchers
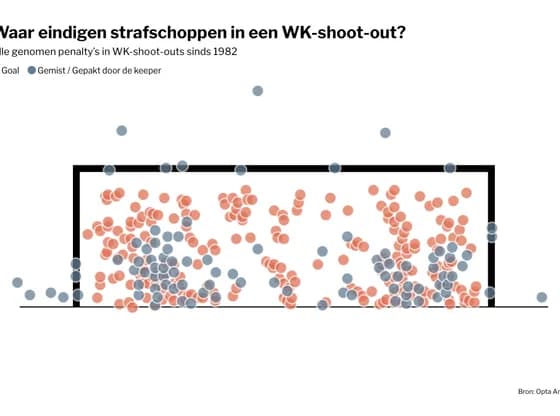 SportsWaar eindigen strafschoppen in een WK-shoot-out?
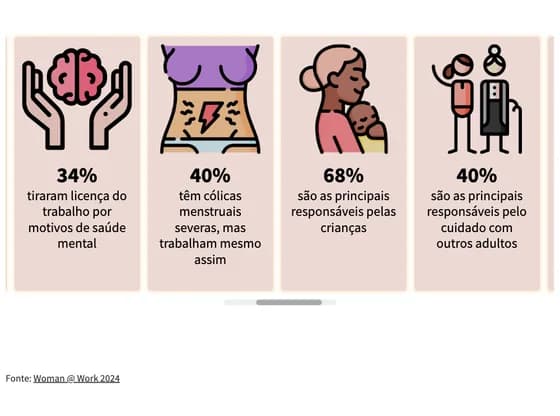 CardsMulheres e mercado de trabalho
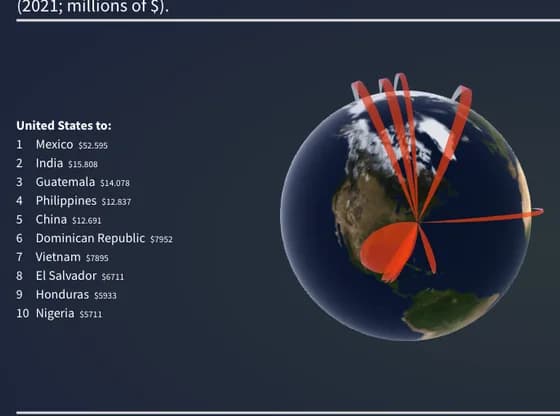 Connections and flow mapsWhere U.S. remittances are headed
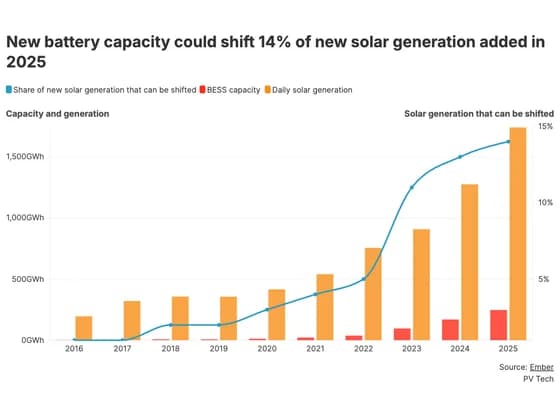 Line, bar and pie chartsNew battery capacity could shift 14% of new solar generation added in 2025
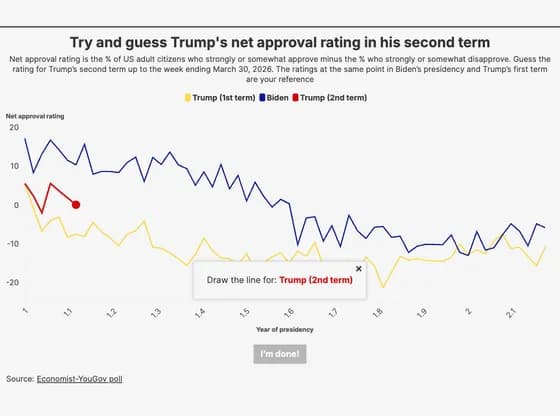 Interactive toolsTry and guess Trump's net approval rating in his second term
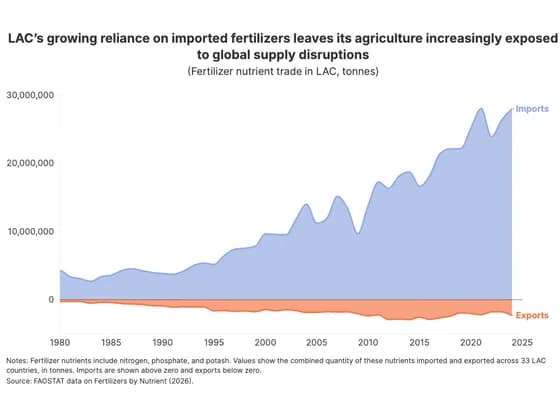 Line, bar and pie chartsLAC’s growing reliance on imported fertilizers leaves its agriculture increasingly exposed to…
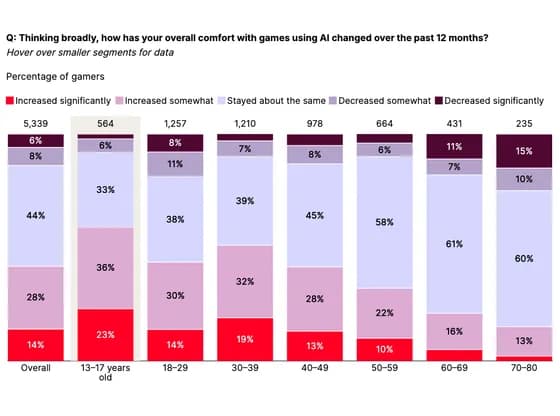 Line, bar and pie chartsQ: Thinking broadly, how has your overall comfort with games using AI changed over the past 12…