
Every chart here started as a spreadsheet.
Maps, bar chart races, treemaps, pictograms and more. Open one and remake it with your own data.
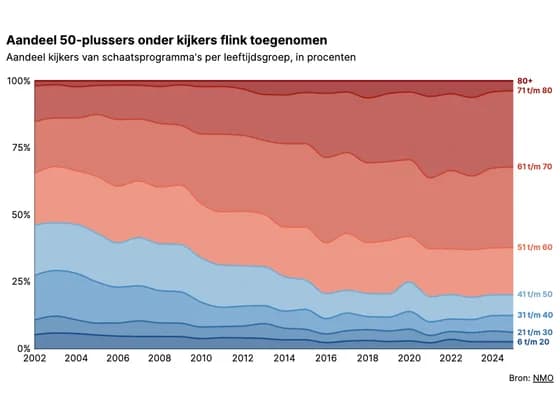 Line, bar and pie chartsAandeel 50-plussers onder kijkers flink toegenomen
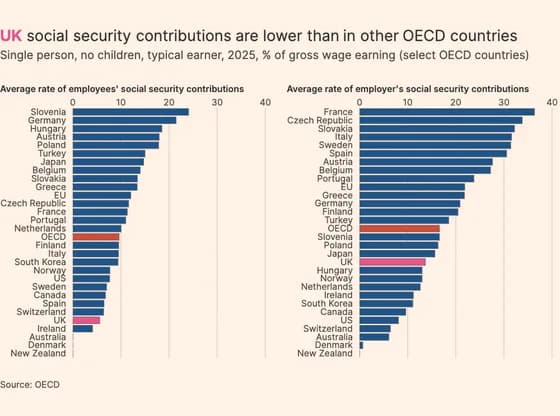 Line, bar and pie chartsUK social security contributions are lower than in other OECD countries
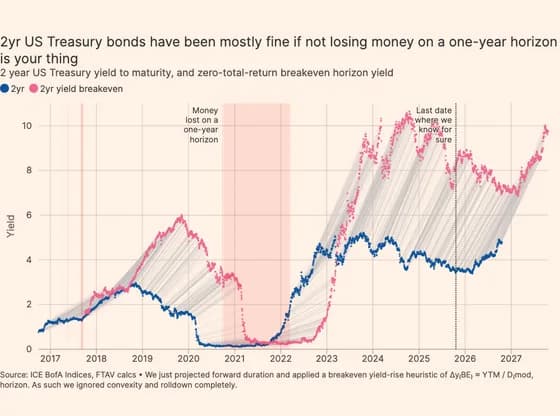 Scatter2yr US Treasury bonds have been mostly fine if not losing money on a one-year horizon is your thing
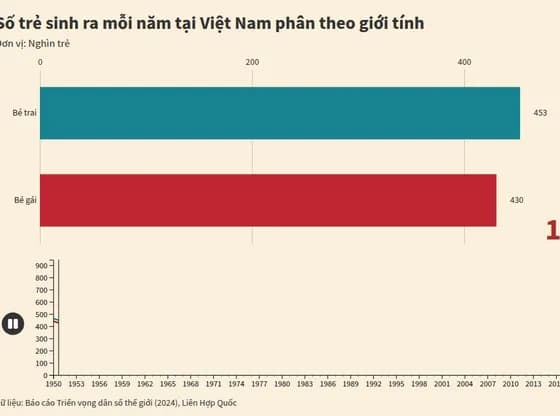 Animated chartsSố trẻ sinh ra mỗi năm tại Việt Nam phân theo giới tính
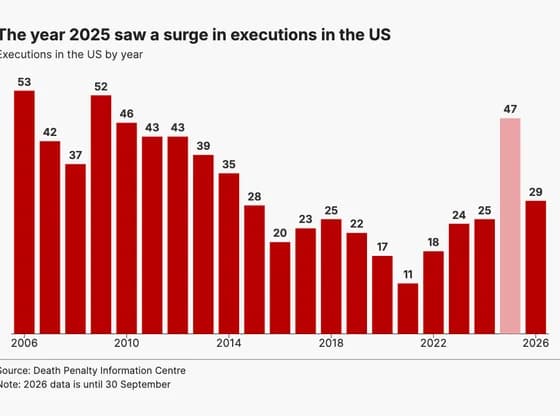 Line, bar and pie chartsThe year 2025 saw a surge in executions in the US
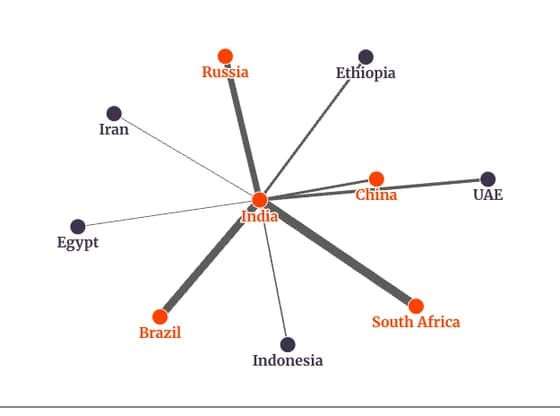 Network graphIndia's Pharmaceuticals trade flow: 2025
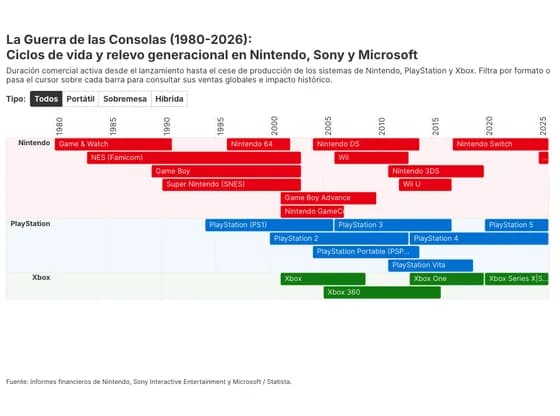 Gantt chartLa Guerra de las Consolas (1980-2026): Ciclos de vida y relevo generacional en Nintendo, Sony y…
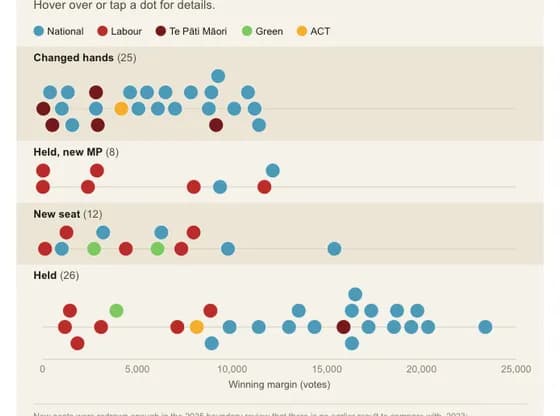 Interactive SVGMargins_candidates
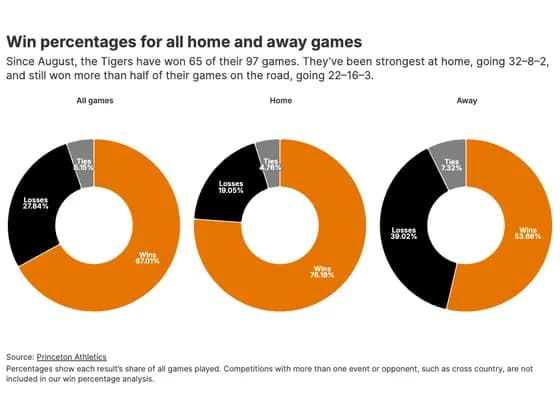 Line, bar and pie chartsWin percentages for all home and away games
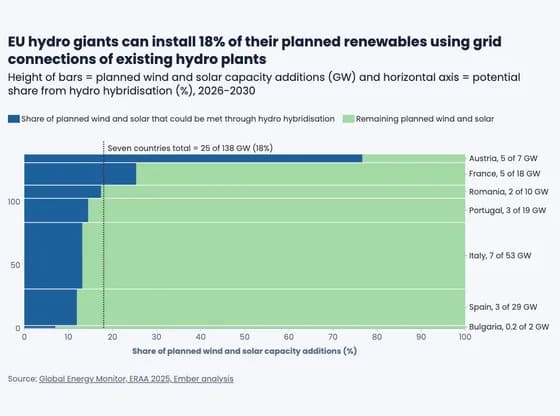 MarimekkoEU hydro giants can install 18% of their planned renewables using grid connections of existing…
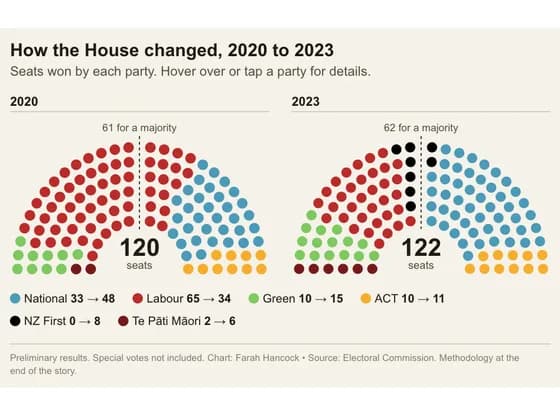 Interactive SVGThen_now_seats
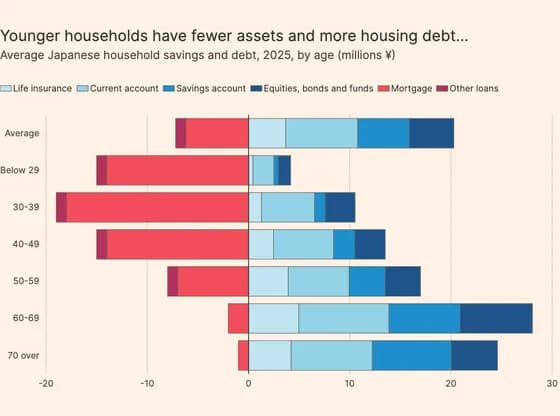 Line, bar and pie chartsYounger households have fewer assets and more housing debt...
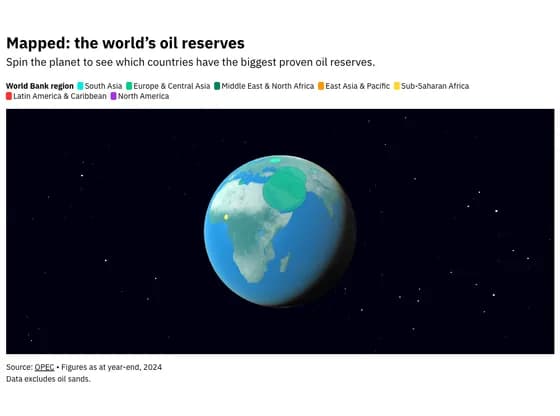 3D globeMapped: the world’s oil reserves
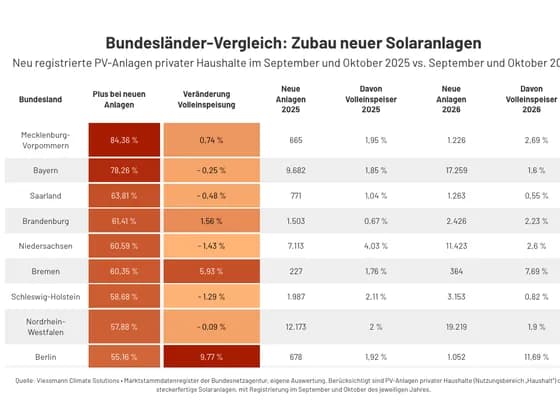 TableBundesländer-Vergleich: Zubau neuer Solaranlagen
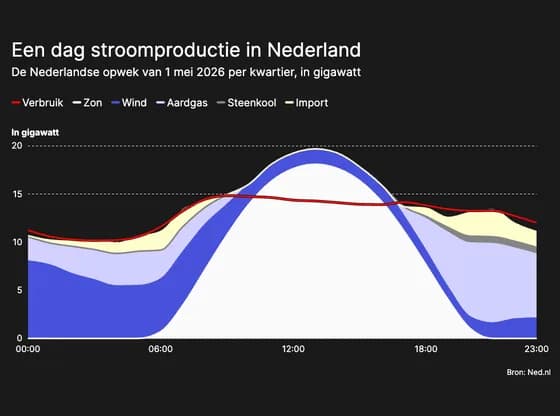 Line, bar and pie chartsEen dag stroomproductie in Nederland
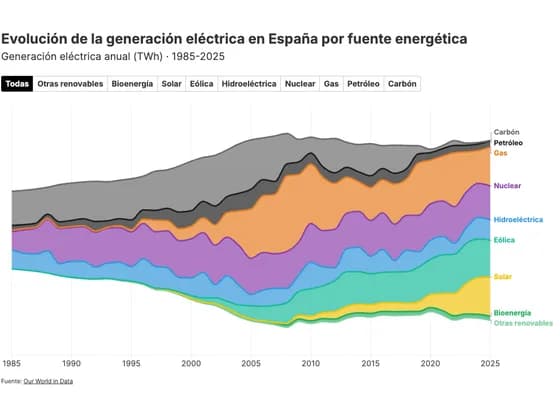 Line, bar and pie chartsEvolución de la generación eléctrica en España por fuente energética
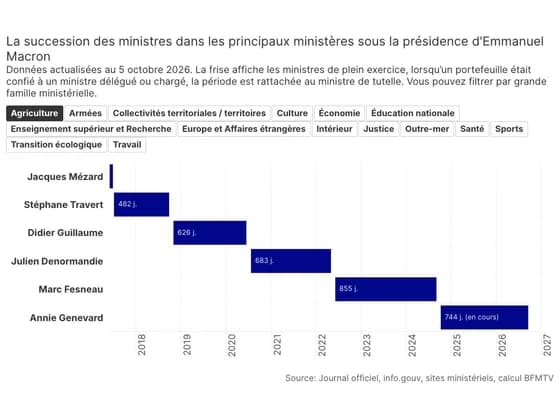 Gantt chartLa succession des ministres dans les principaux ministères sous la présidence d'Emmanuel Macron
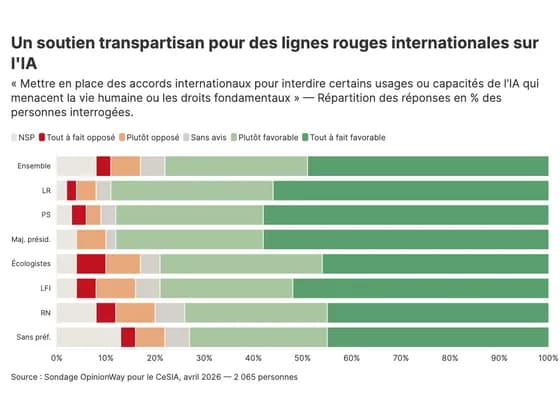 Line, bar and pie chartsUn soutien transpartisan pour des lignes rouges internationales sur l'IA
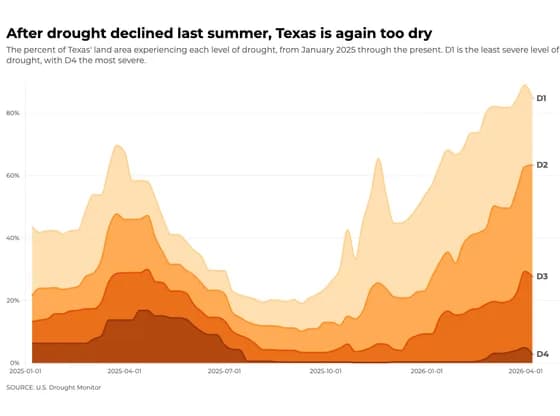 Line, bar and pie chartsAfter drought declined last summer, Texas is again too dry
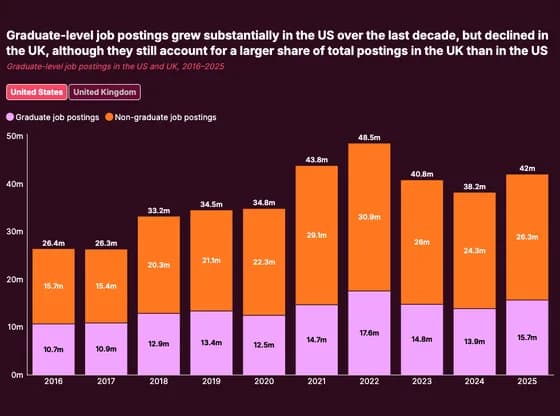 Line, bar and pie chartsGraduate-level job postings grew substantially in the US over the last decade, but declined in…