
Every chart here started as a spreadsheet.
Maps, bar chart races, treemaps, pictograms and more. Open one and remake it with your own data.
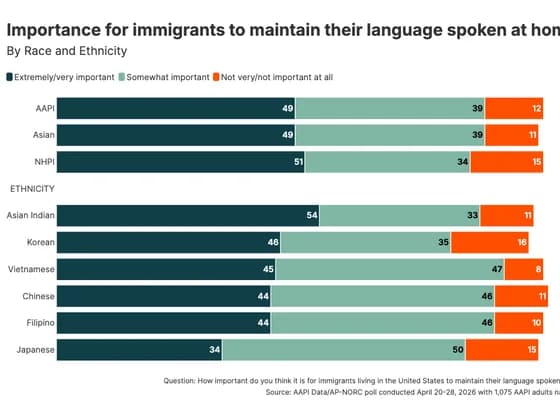 Line, bar and pie chartsImportance for immigrants to maintain their language spoken at home
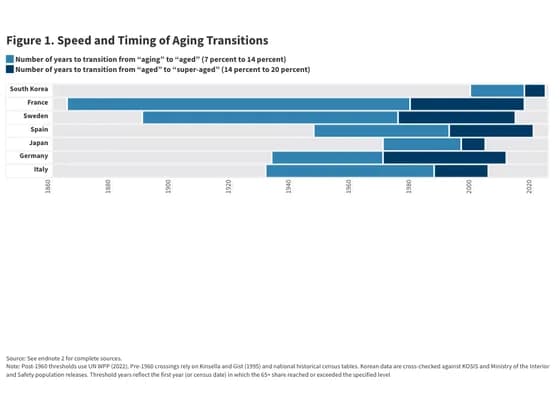 Gantt chartFigure 1. Speed and Timing of Aging Transitions
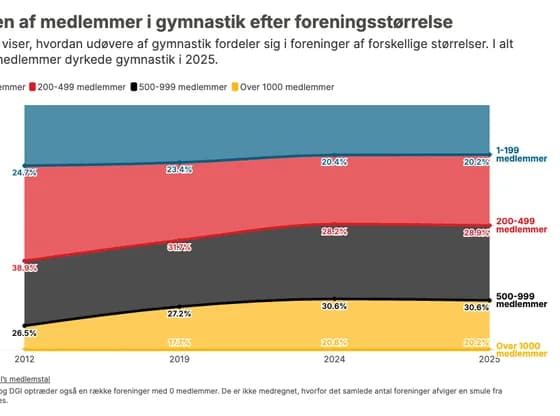 Line, bar and pie chartsAndelen af medlemmer i gymnastik efter foreningsstørrelse
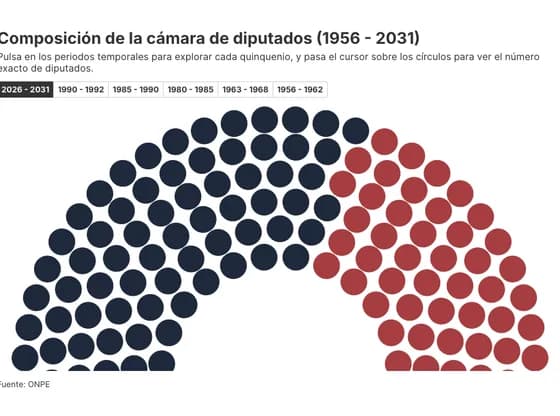 Elections and parliamentsComposición de la cámara de diputados (1956 - 2031)
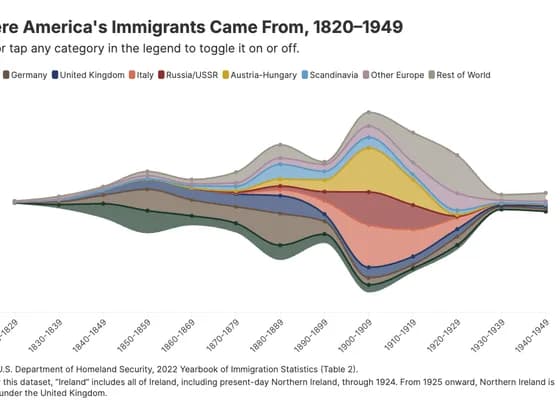 Line, bar and pie chartsWhere America's Immigrants Came From, 1820–1949
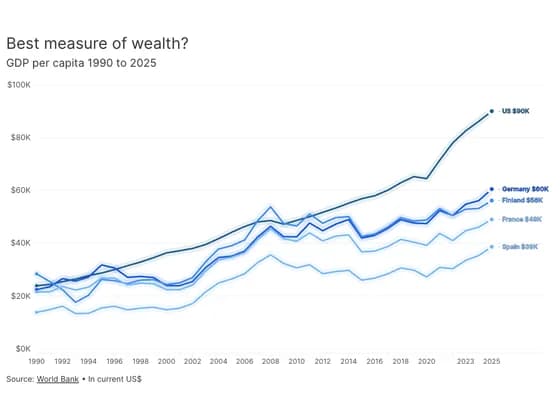 Animated chartsBest measure of wealth?
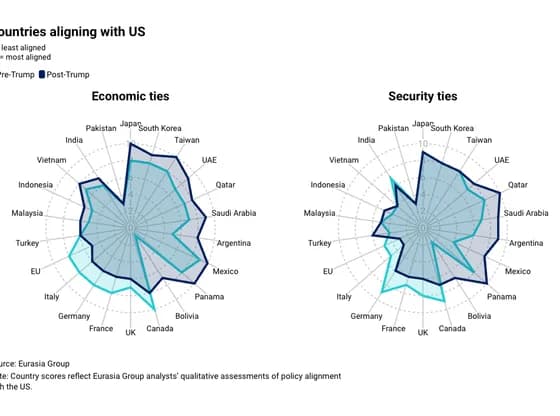 Radar chartCountries aligning with US
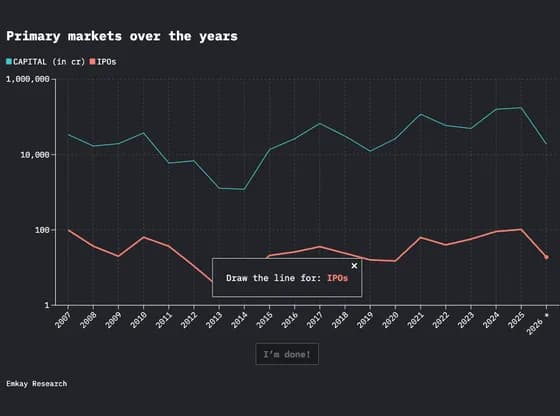 Interactive toolsPrimary markets over the years
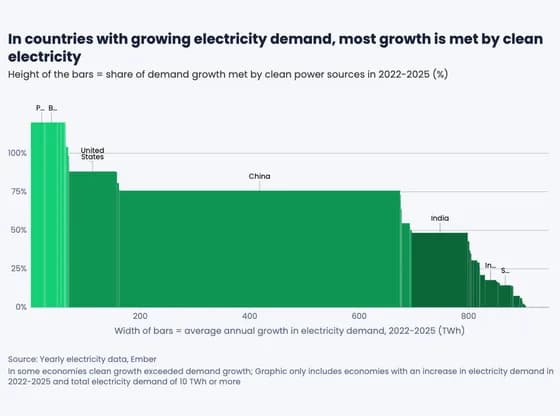 MarimekkoIn countries with growing electricity demand, most growth is met by clean electricity
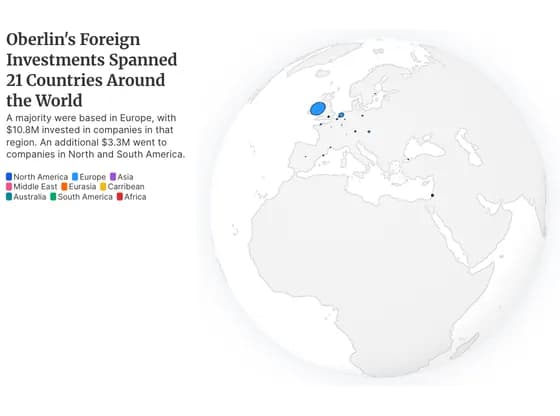 3D globeOberlin's Foreign Investments Spanned 21 Countries Around the World
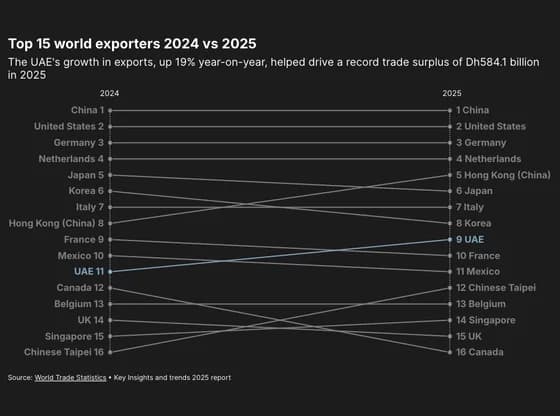 Slope chartTop 15 world exporters 2024 vs 2025
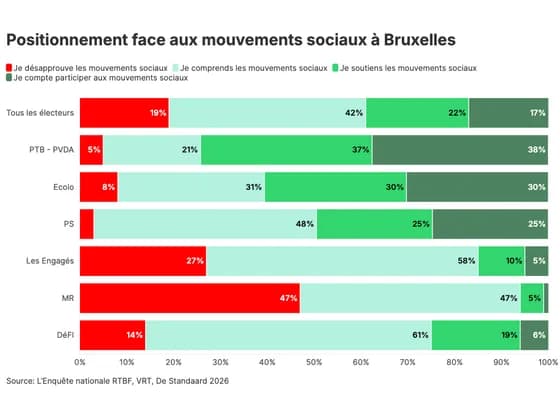 Line, bar and pie chartsPositionnement face aux mouvements sociaux à Bruxelles
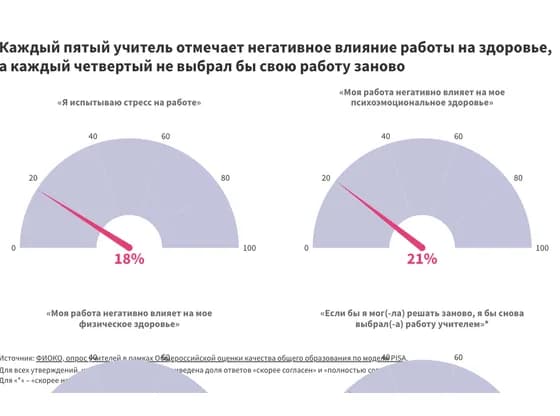 Counters and gaugesКаждый пятый учитель отмечает негативное влияние работы на здоровье, а каждый четвертый не…
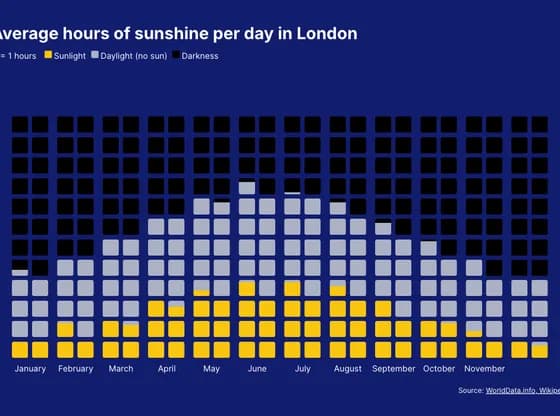 PictogramAverage hours of sunshine per day in London
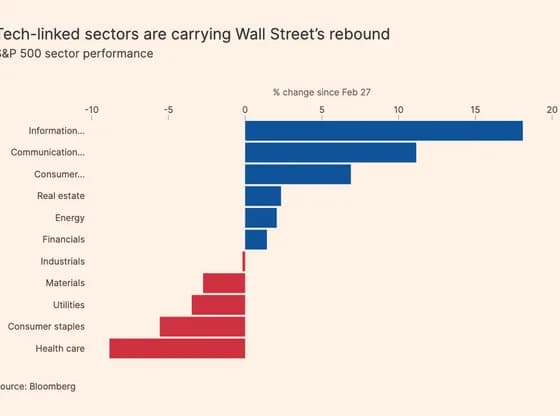 Line, bar and pie chartsTech-linked sectors are carrying Wall Street’s rebound
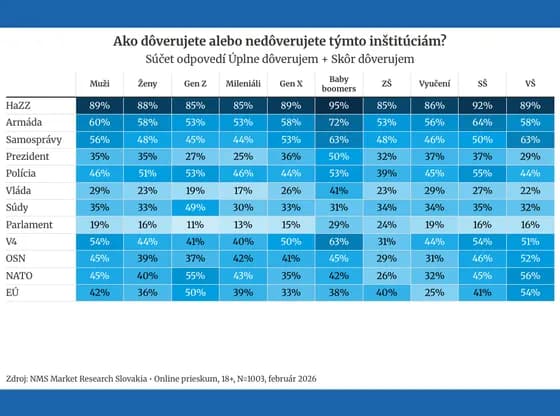 TableAko dôverujete alebo nedôverujete týmto inštitúciám?
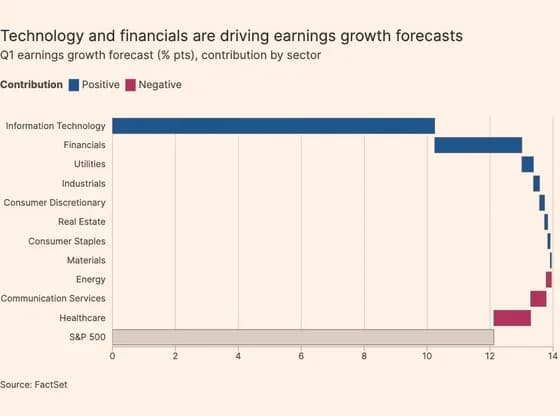 Line, bar and pie chartsTechnology and financials are driving earnings growth forecasts
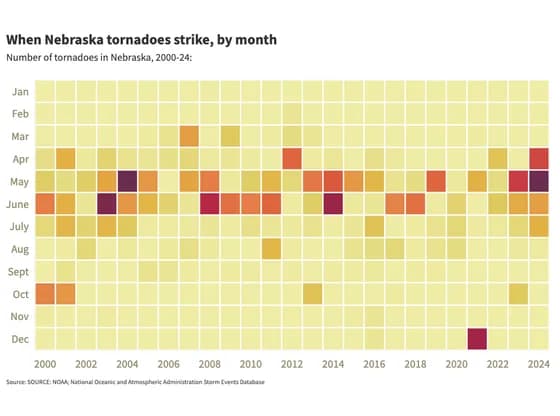 HeatmapWhen Nebraska tornadoes strike, by month
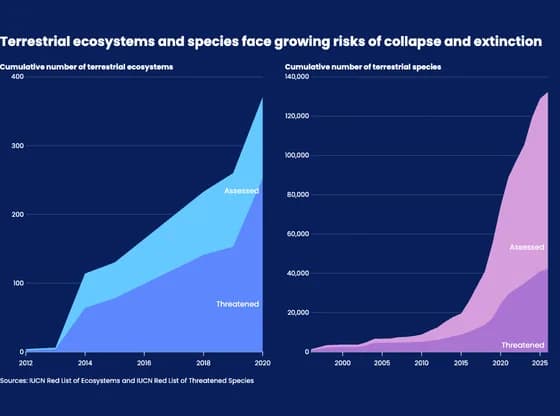 Line, bar and pie chartsTerrestrial ecosystems and species face growing risks of collapse and extinction
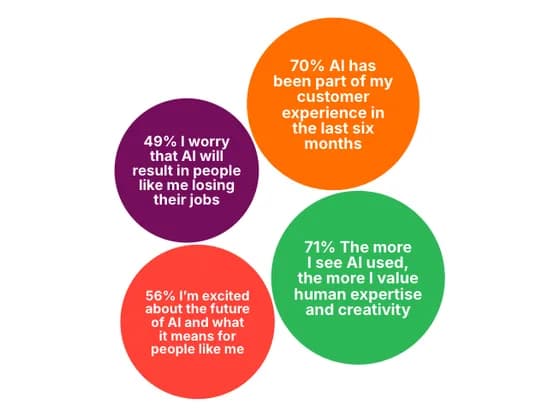 Distribution chartsThe role of AI and humans in customers lives