
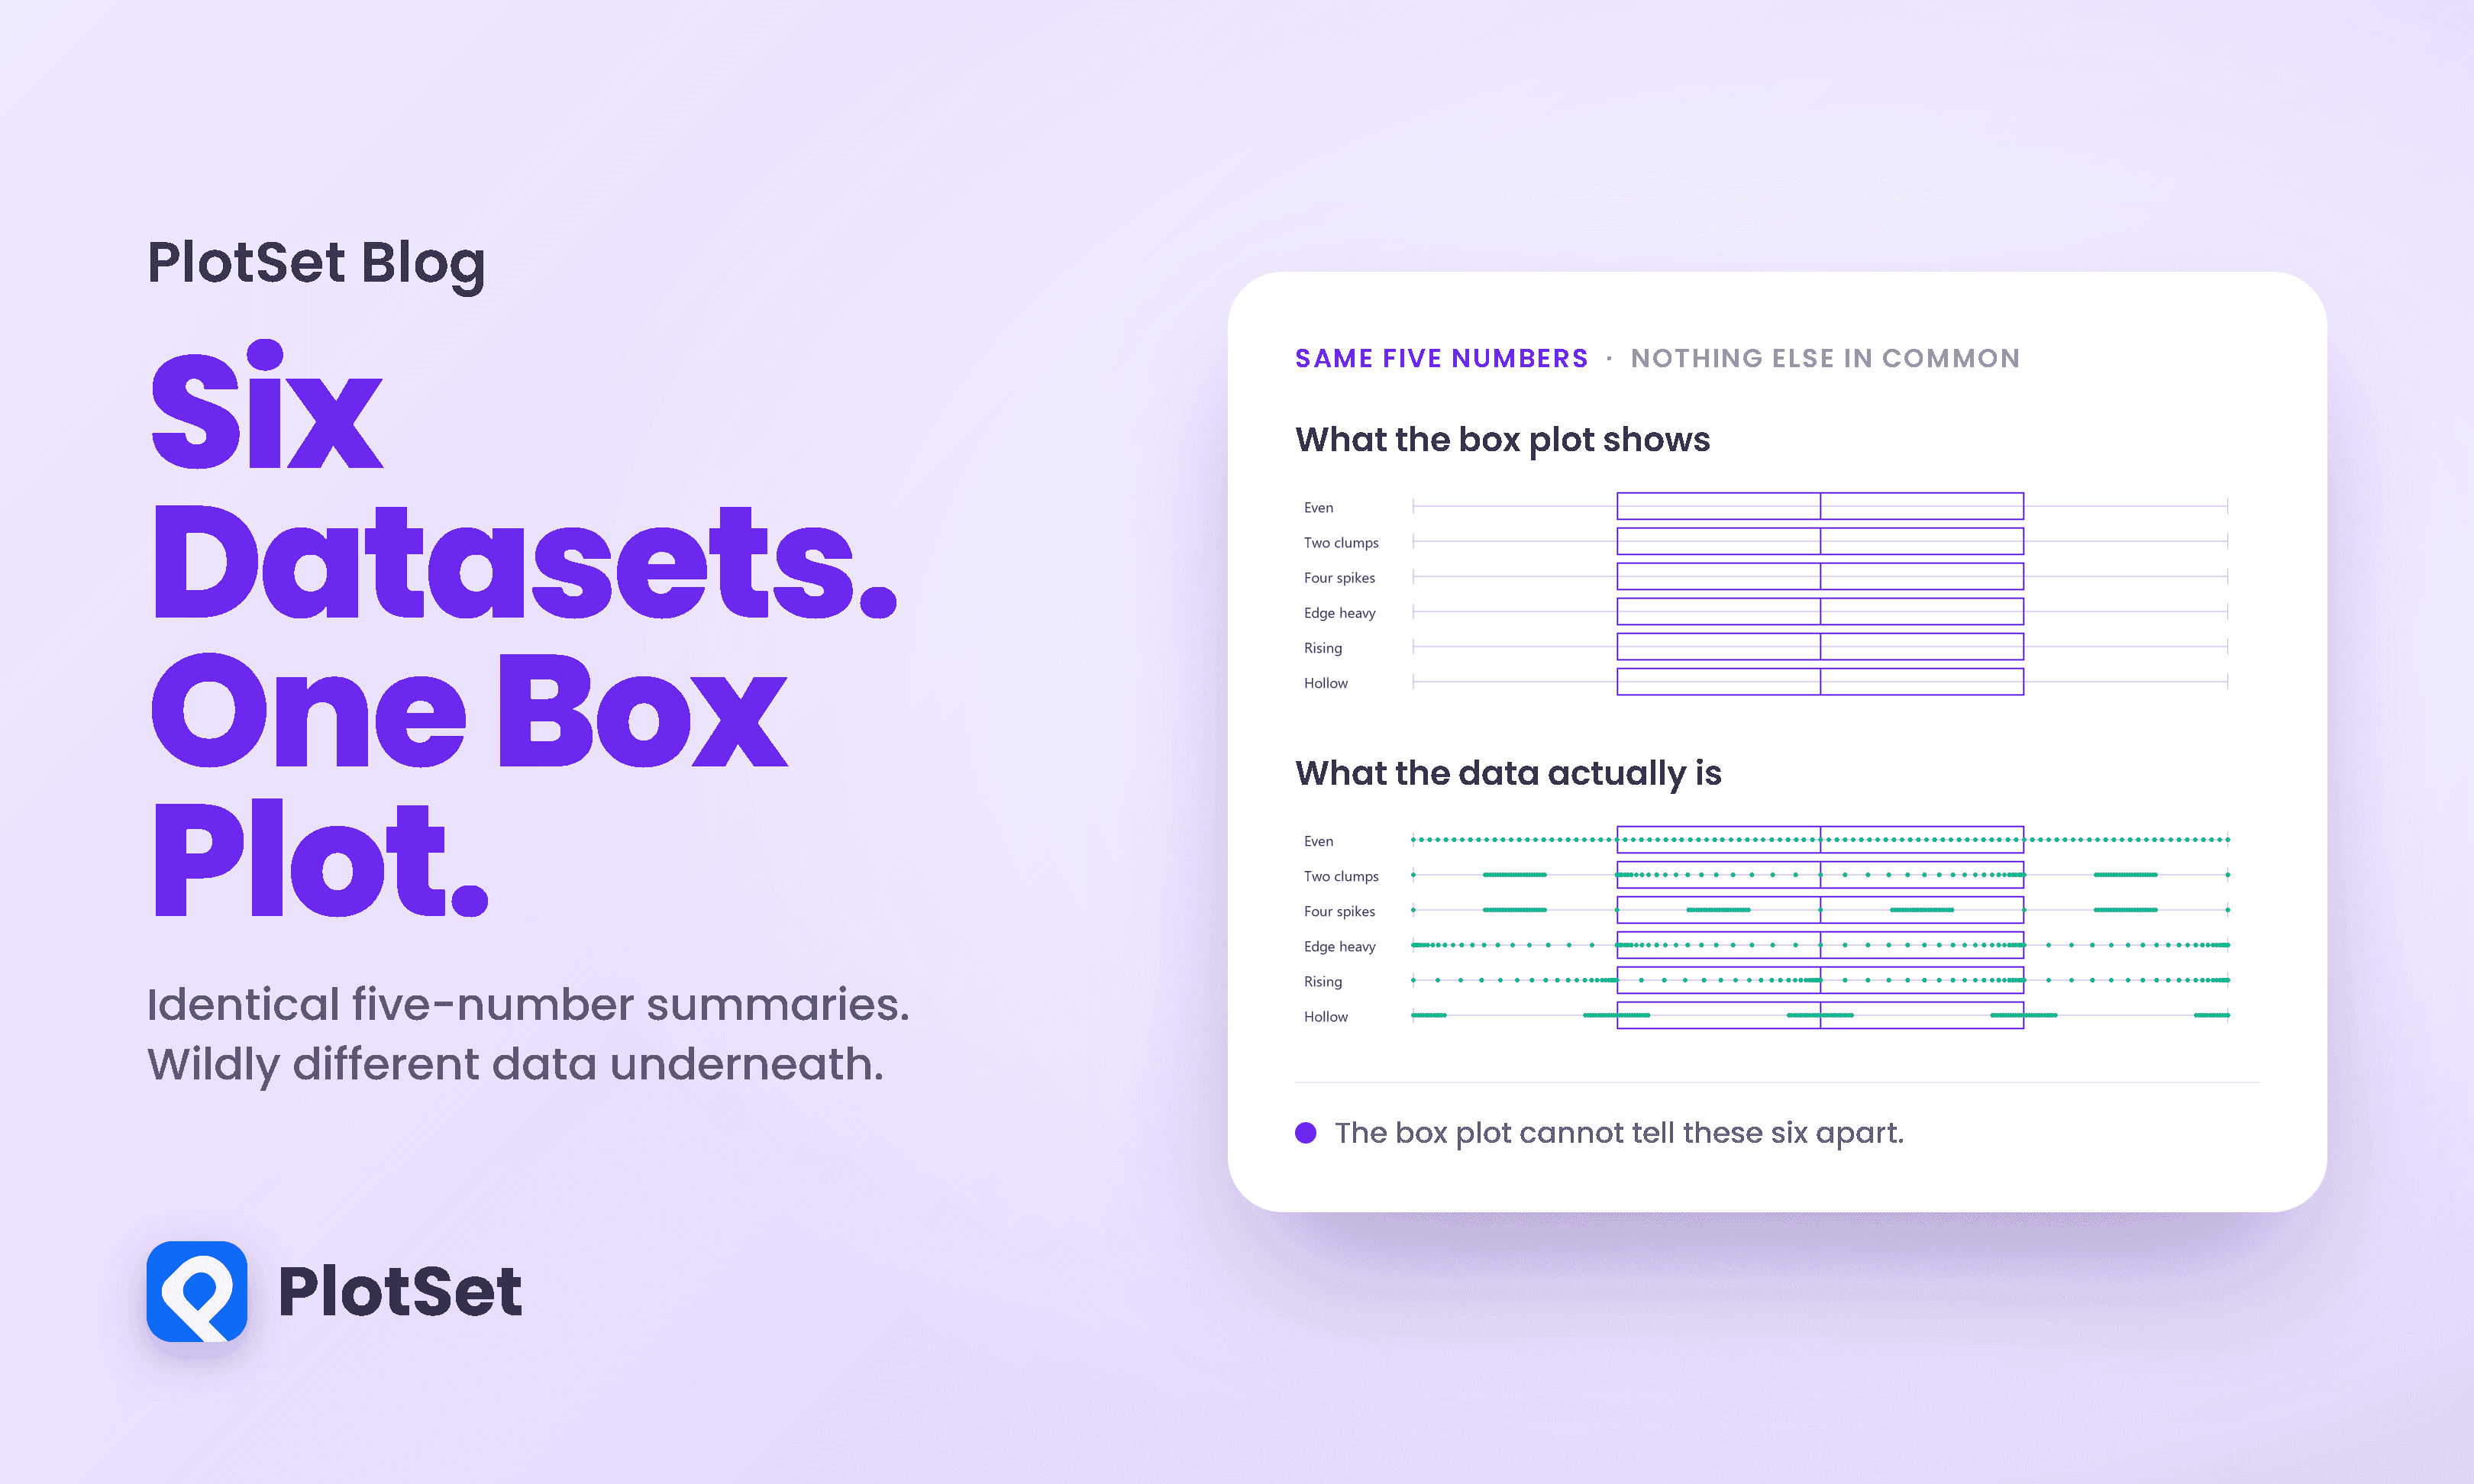
Datasaurus Dozen: Same Statistics, Different Graphs
The Datasaurus Dozen shows 13 datasets with the same statistics and different graphs. See why box plots hide the same problem and what to chart instead.
10 min de lectura
The Datasaurus Dozen shows 13 datasets with the same statistics and different graphs. See why box plots hide the same problem and what to chart instead.
10 min de lectura
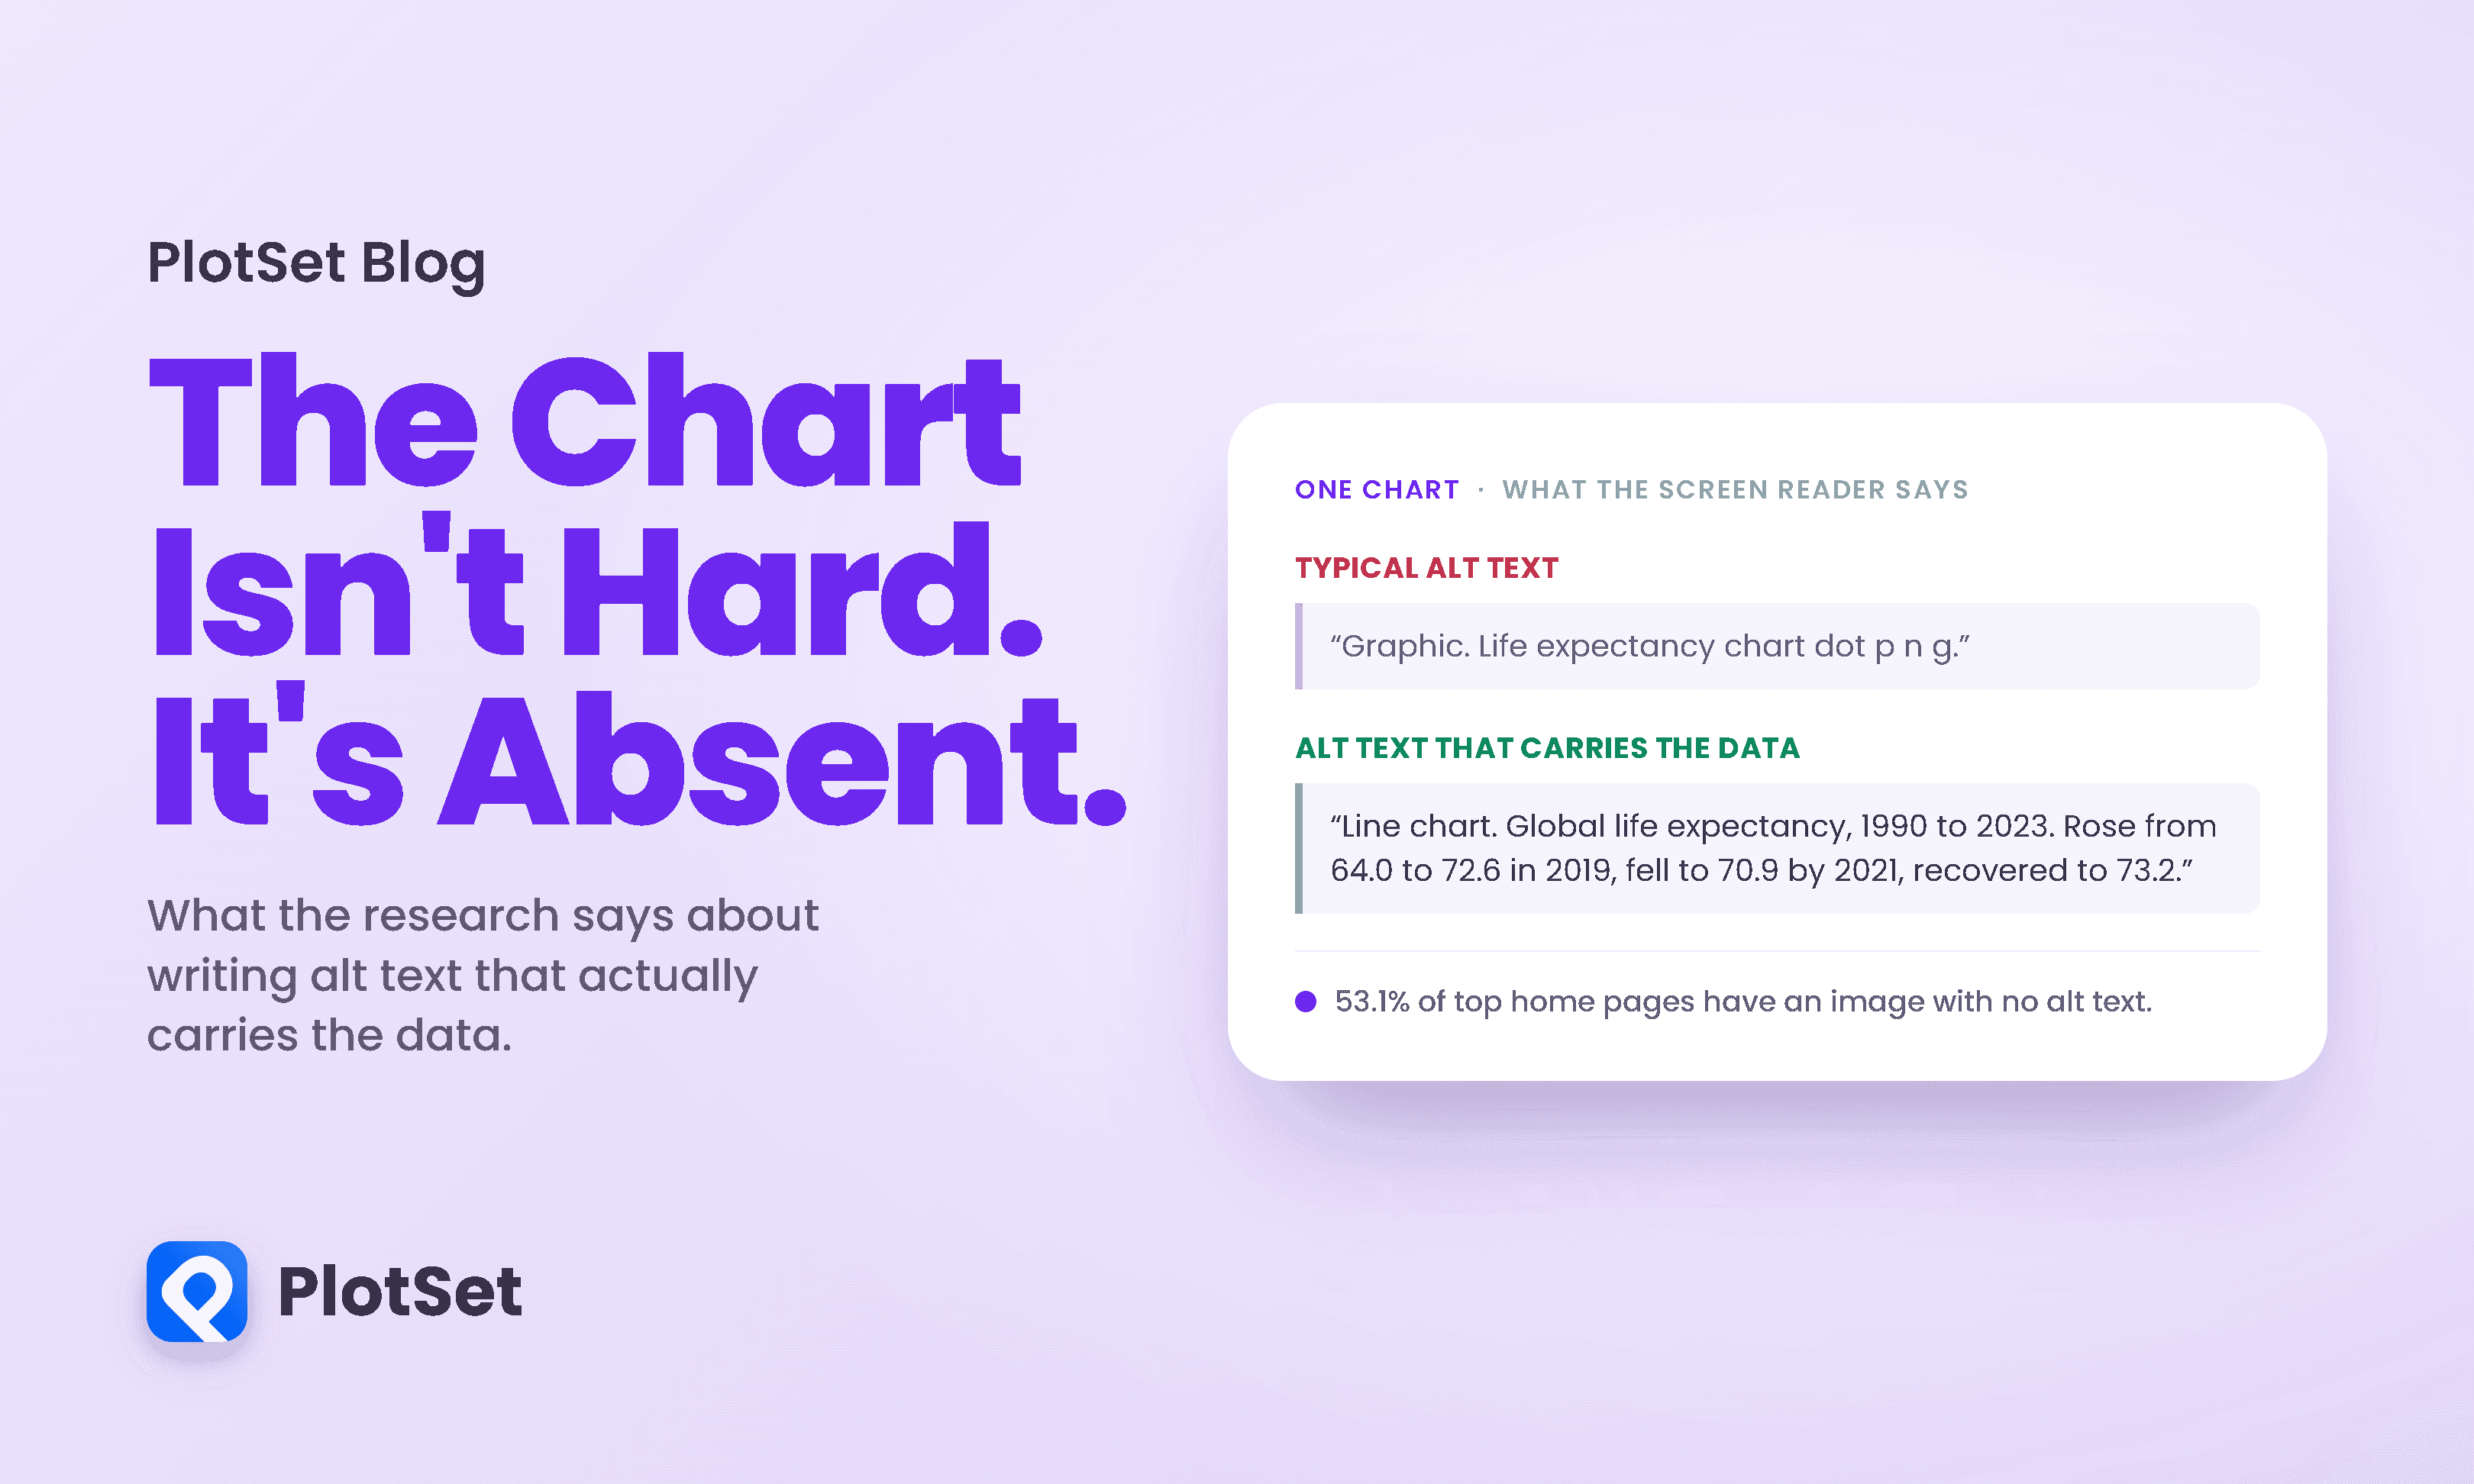
Most advice about charts assumes a reader who can see the chart. Contrast, layout, colour, labelling: all of it is about making a visible thing easier to interpret.
12 min de lectura
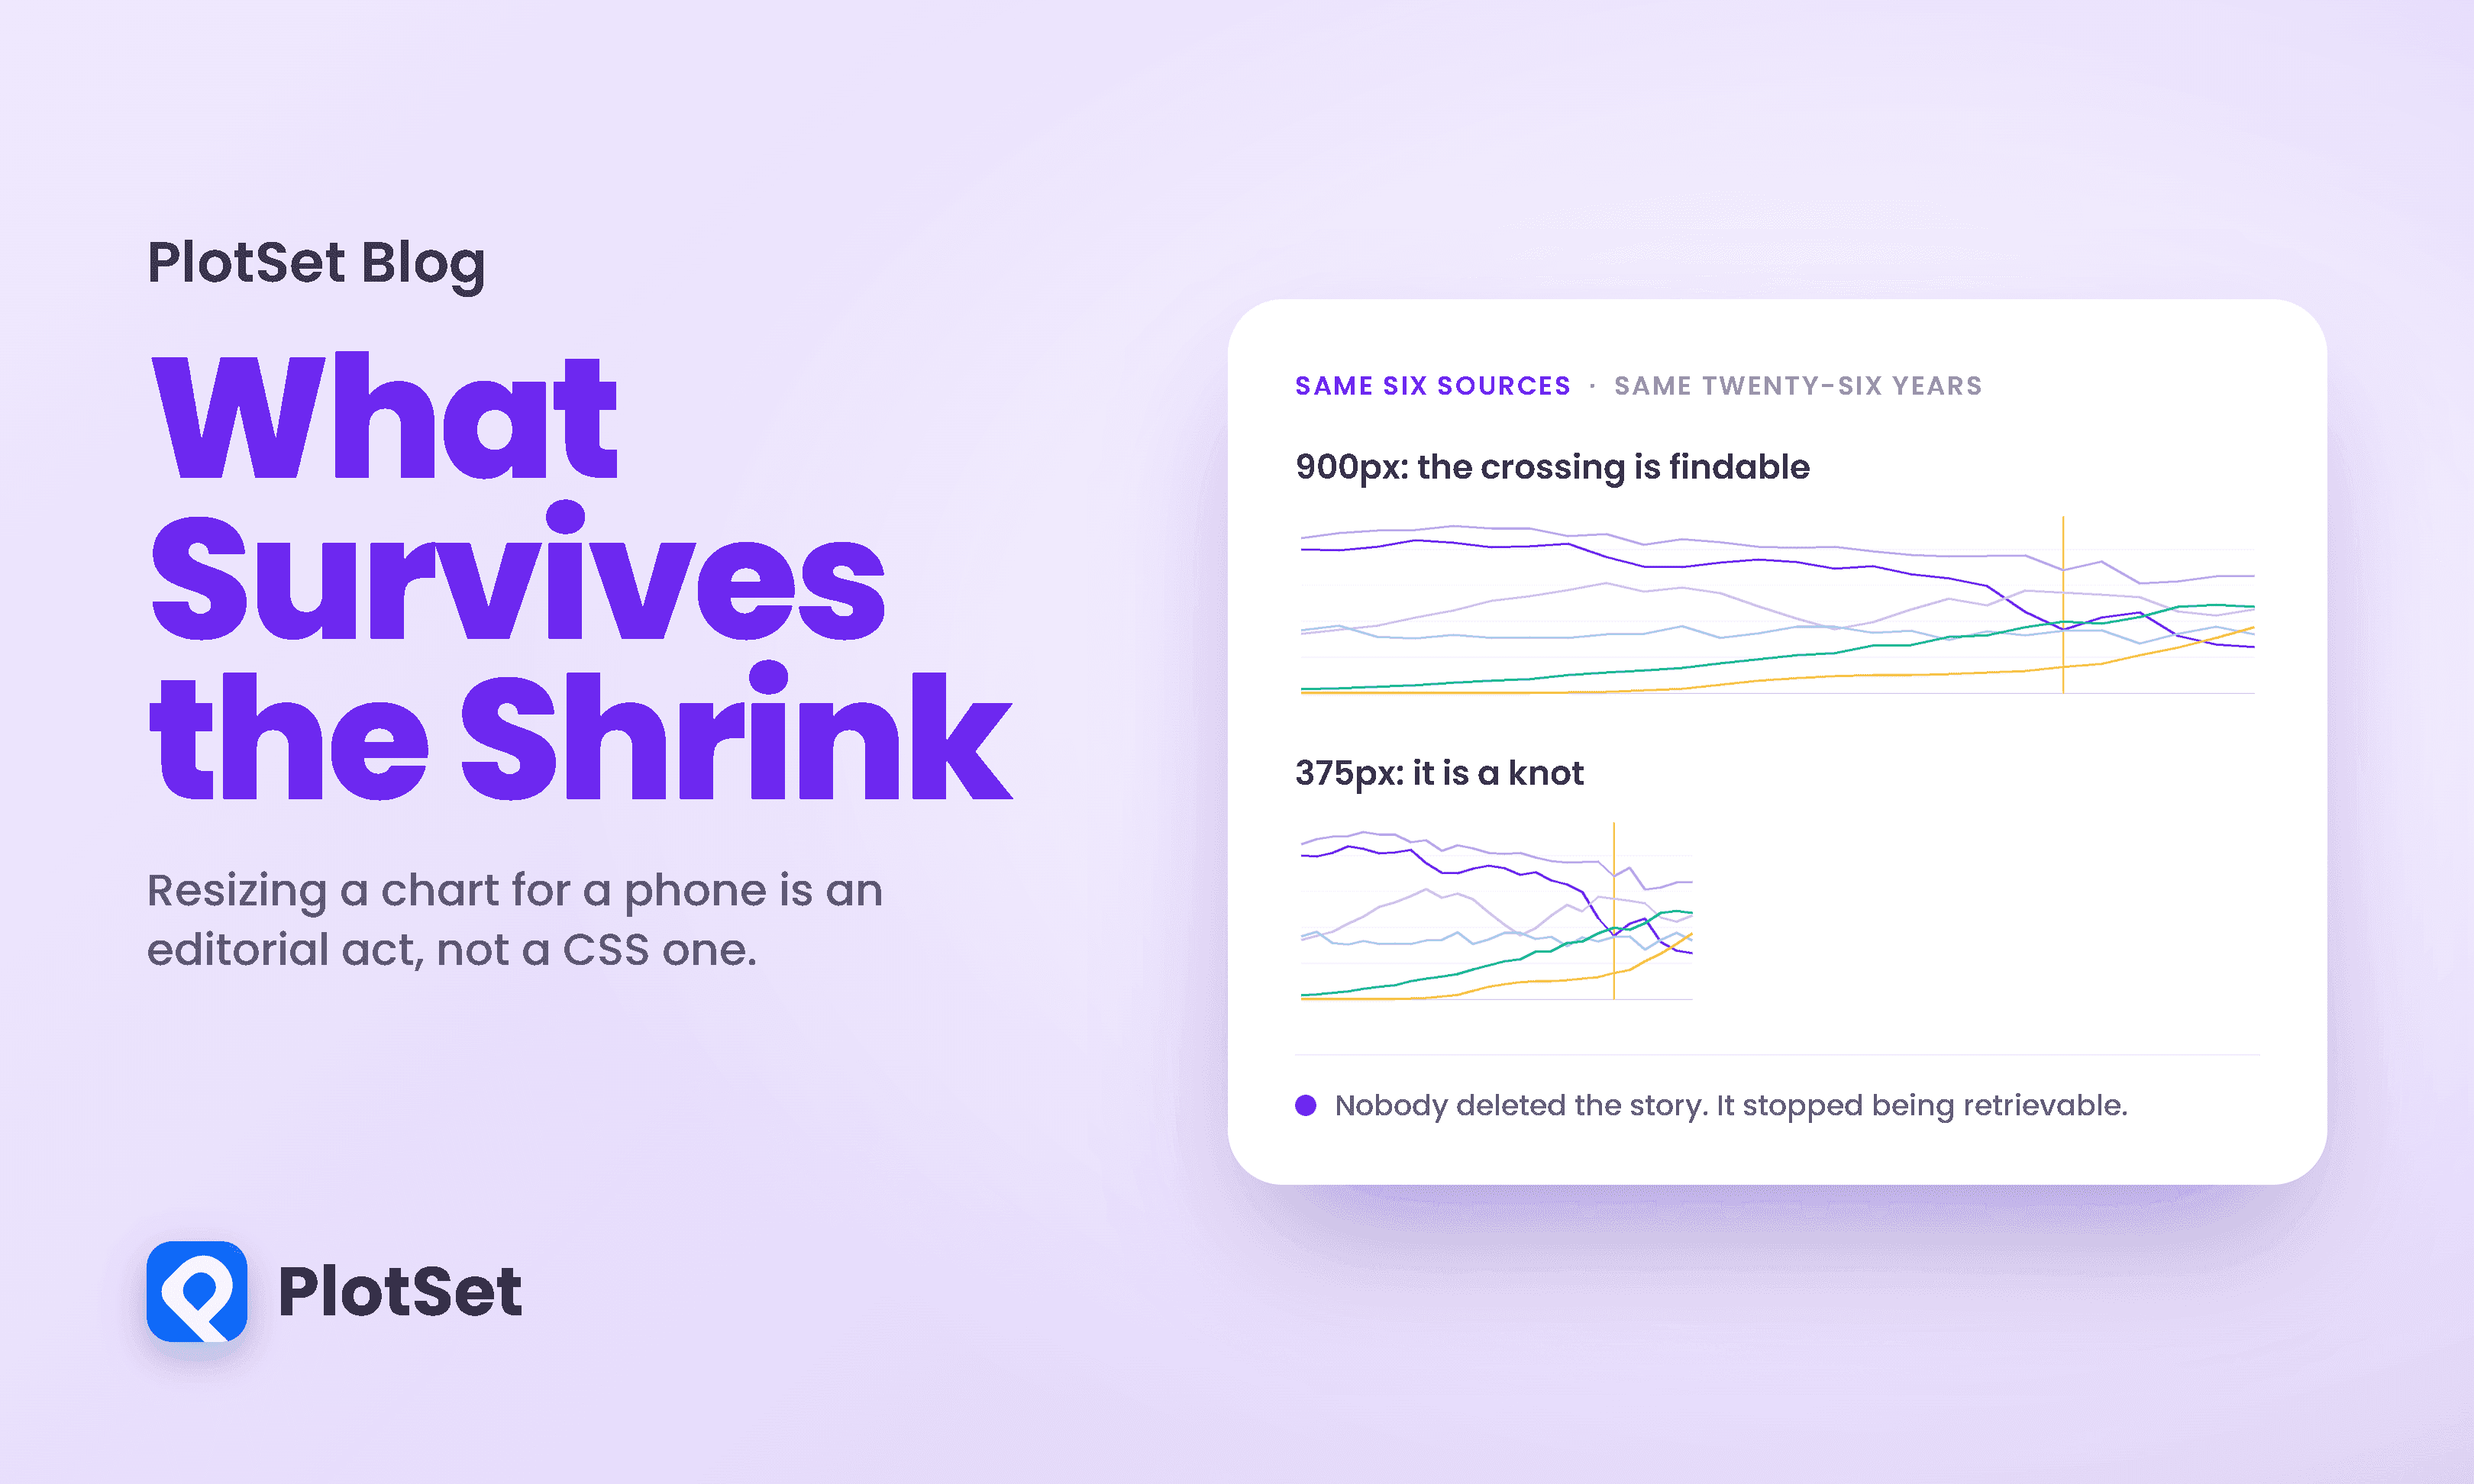
Responsive design arrived in data visualization as a layout problem. Squeeze the axes, rotate the labels, drop a legend, ship it.
9 min de lectura

There are two confident positions on animated charts and both are wrong. One says animation is decoration, a gimmick for people who cannot make a point with a static image.
10 min de lectura
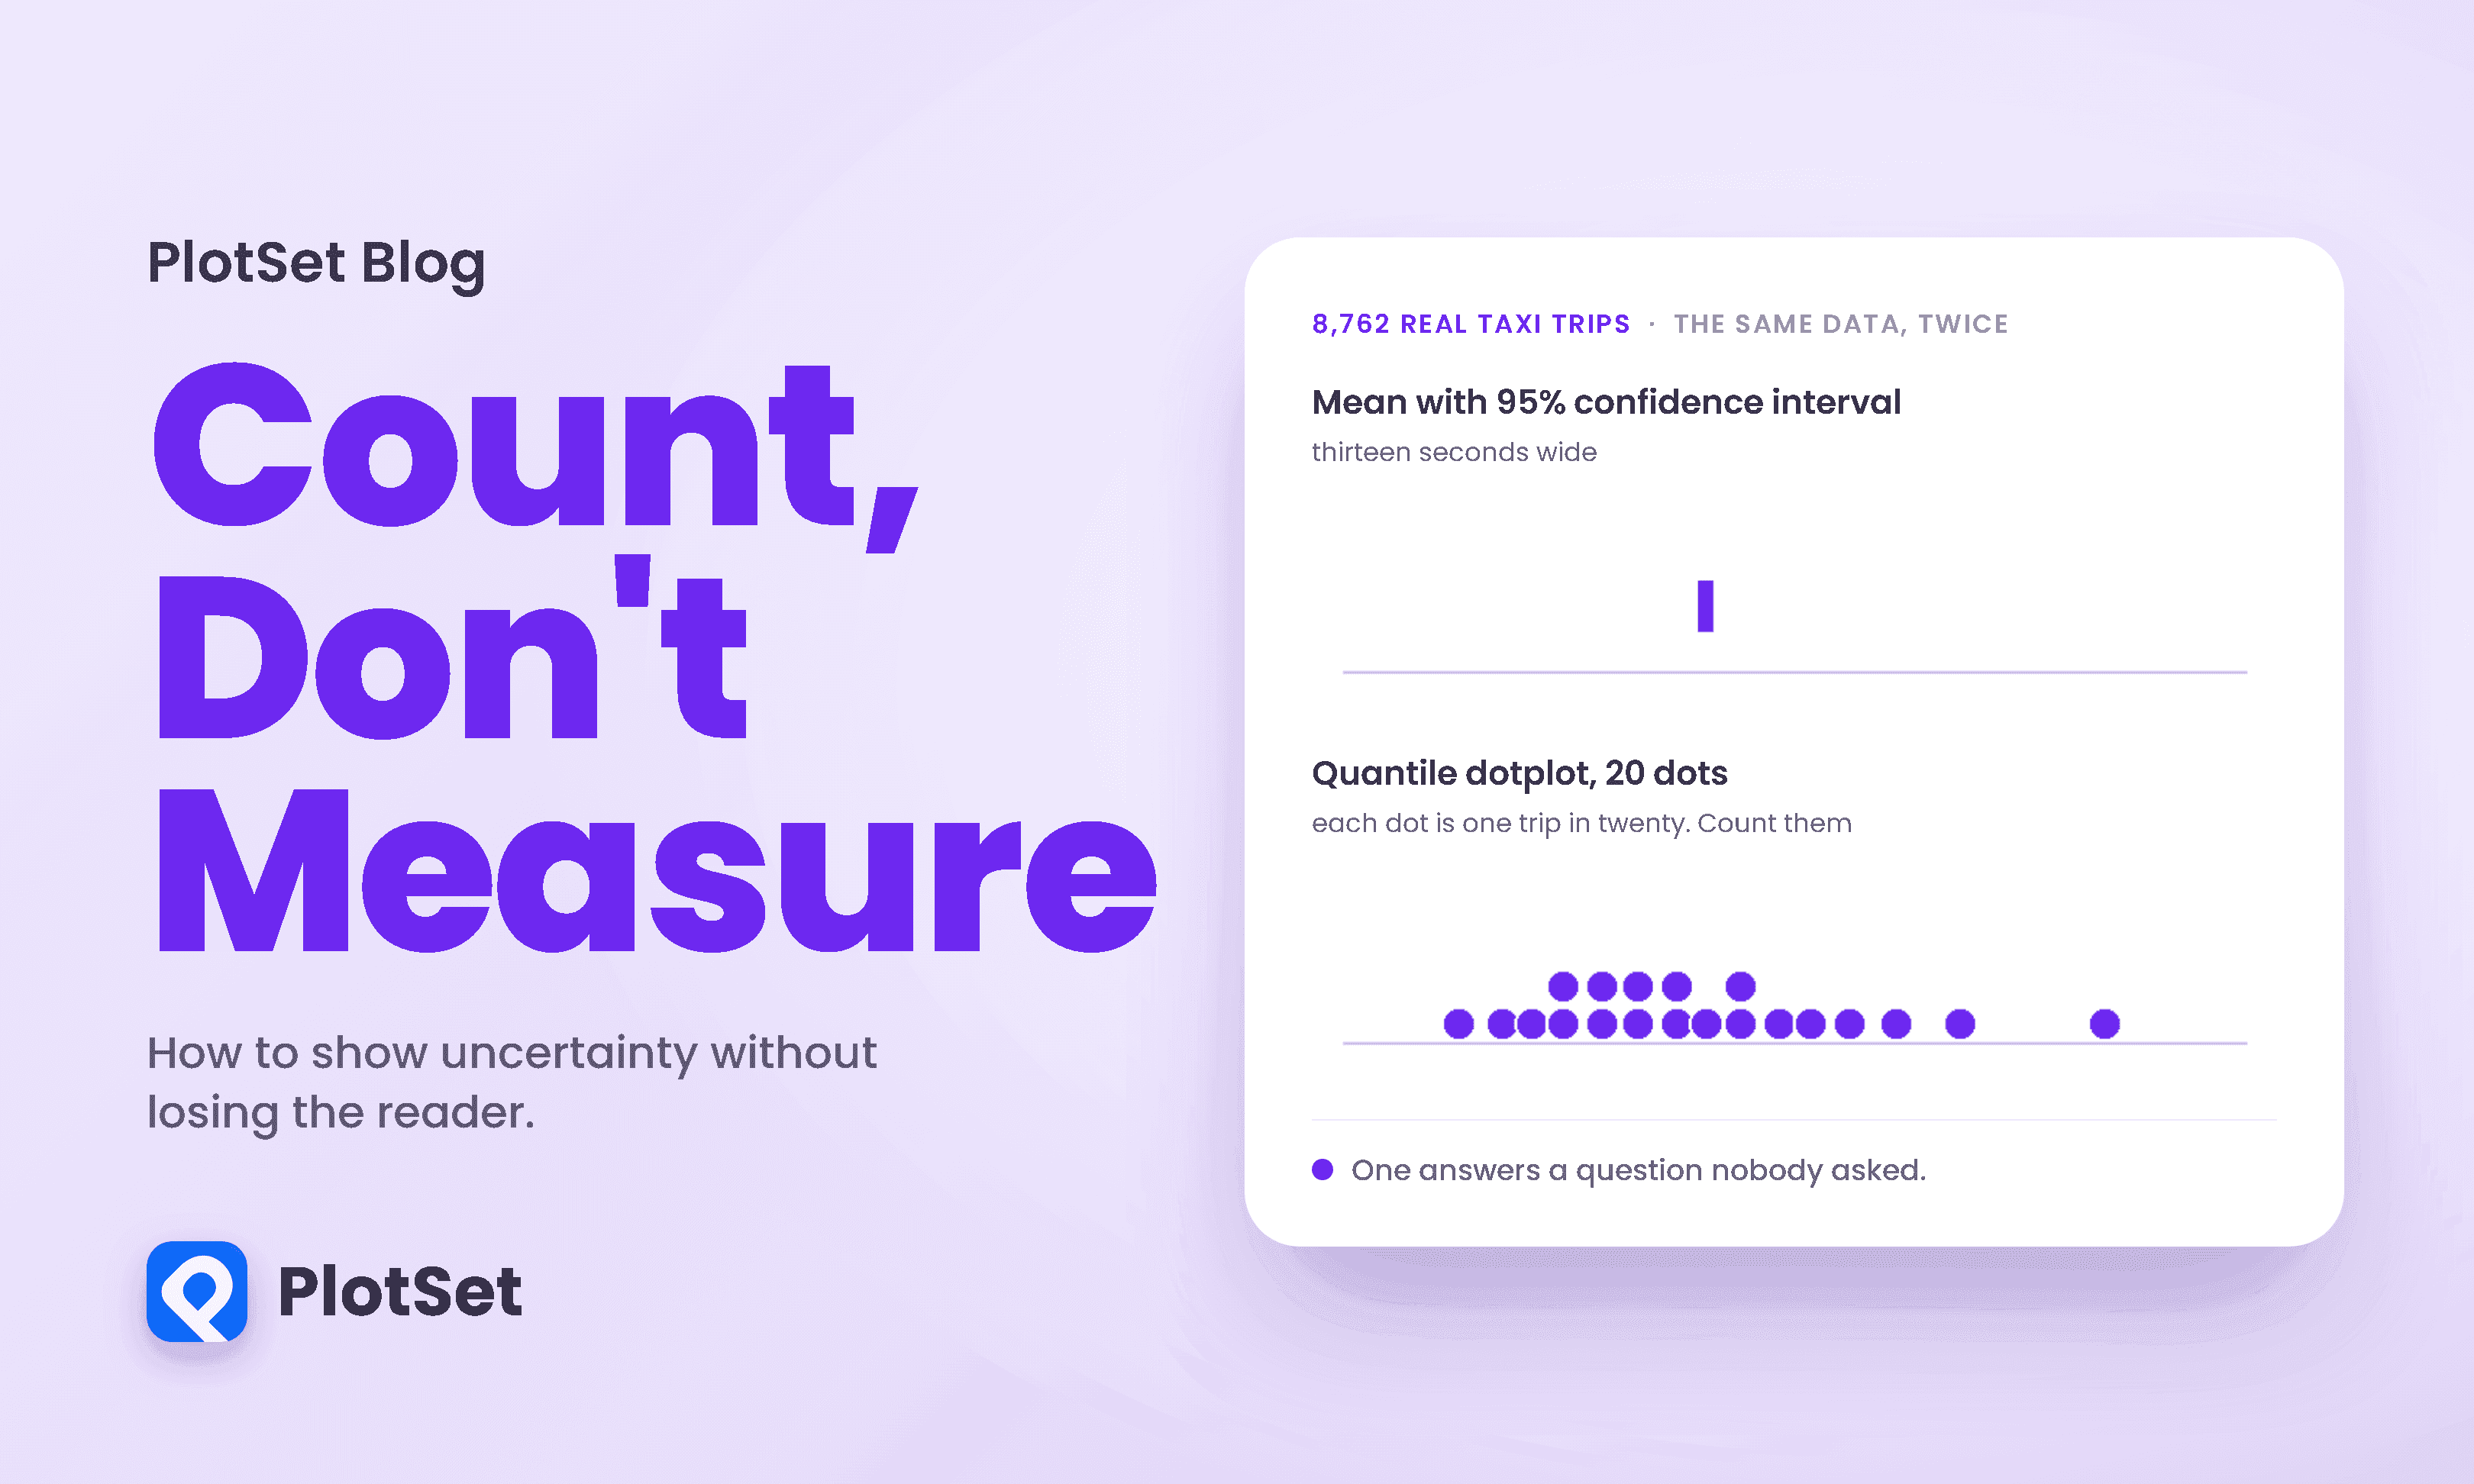
Here is a question with a number attached. You are in Midtown Manhattan and you need to be on the Upper East Side. How long does the taxi take?
10 min de lectura

Most advice about data storytelling is atmospheric. Find the narrative. Take the reader on a journey. Make it flow.
10 min de lectura

Below is a scatterplot of New York City yellow taxi trips from January 2024, fare against distance. It is real data, straight from the city's own records.
10 min de lectura
This is the most common way a real chart fails, and it has nothing to do with the famous sins of deception. Nobody truncated an axis or inverted a scale here. The data is honest.
10 min de lectura

Most people who share a news story never open it. When researchers matched 2.8 million shared links against the clicks they actually generated, 59 percent of the links were never clicked at all.
10 min de lectura

On 21 July the United States announced a 50 percent tariff on Canada, and the coverage split into two familiar camps almost instantly: this is a bold stand against an unfair trading partner, or this is a reckless tax on American consumers.
10 min de lectura
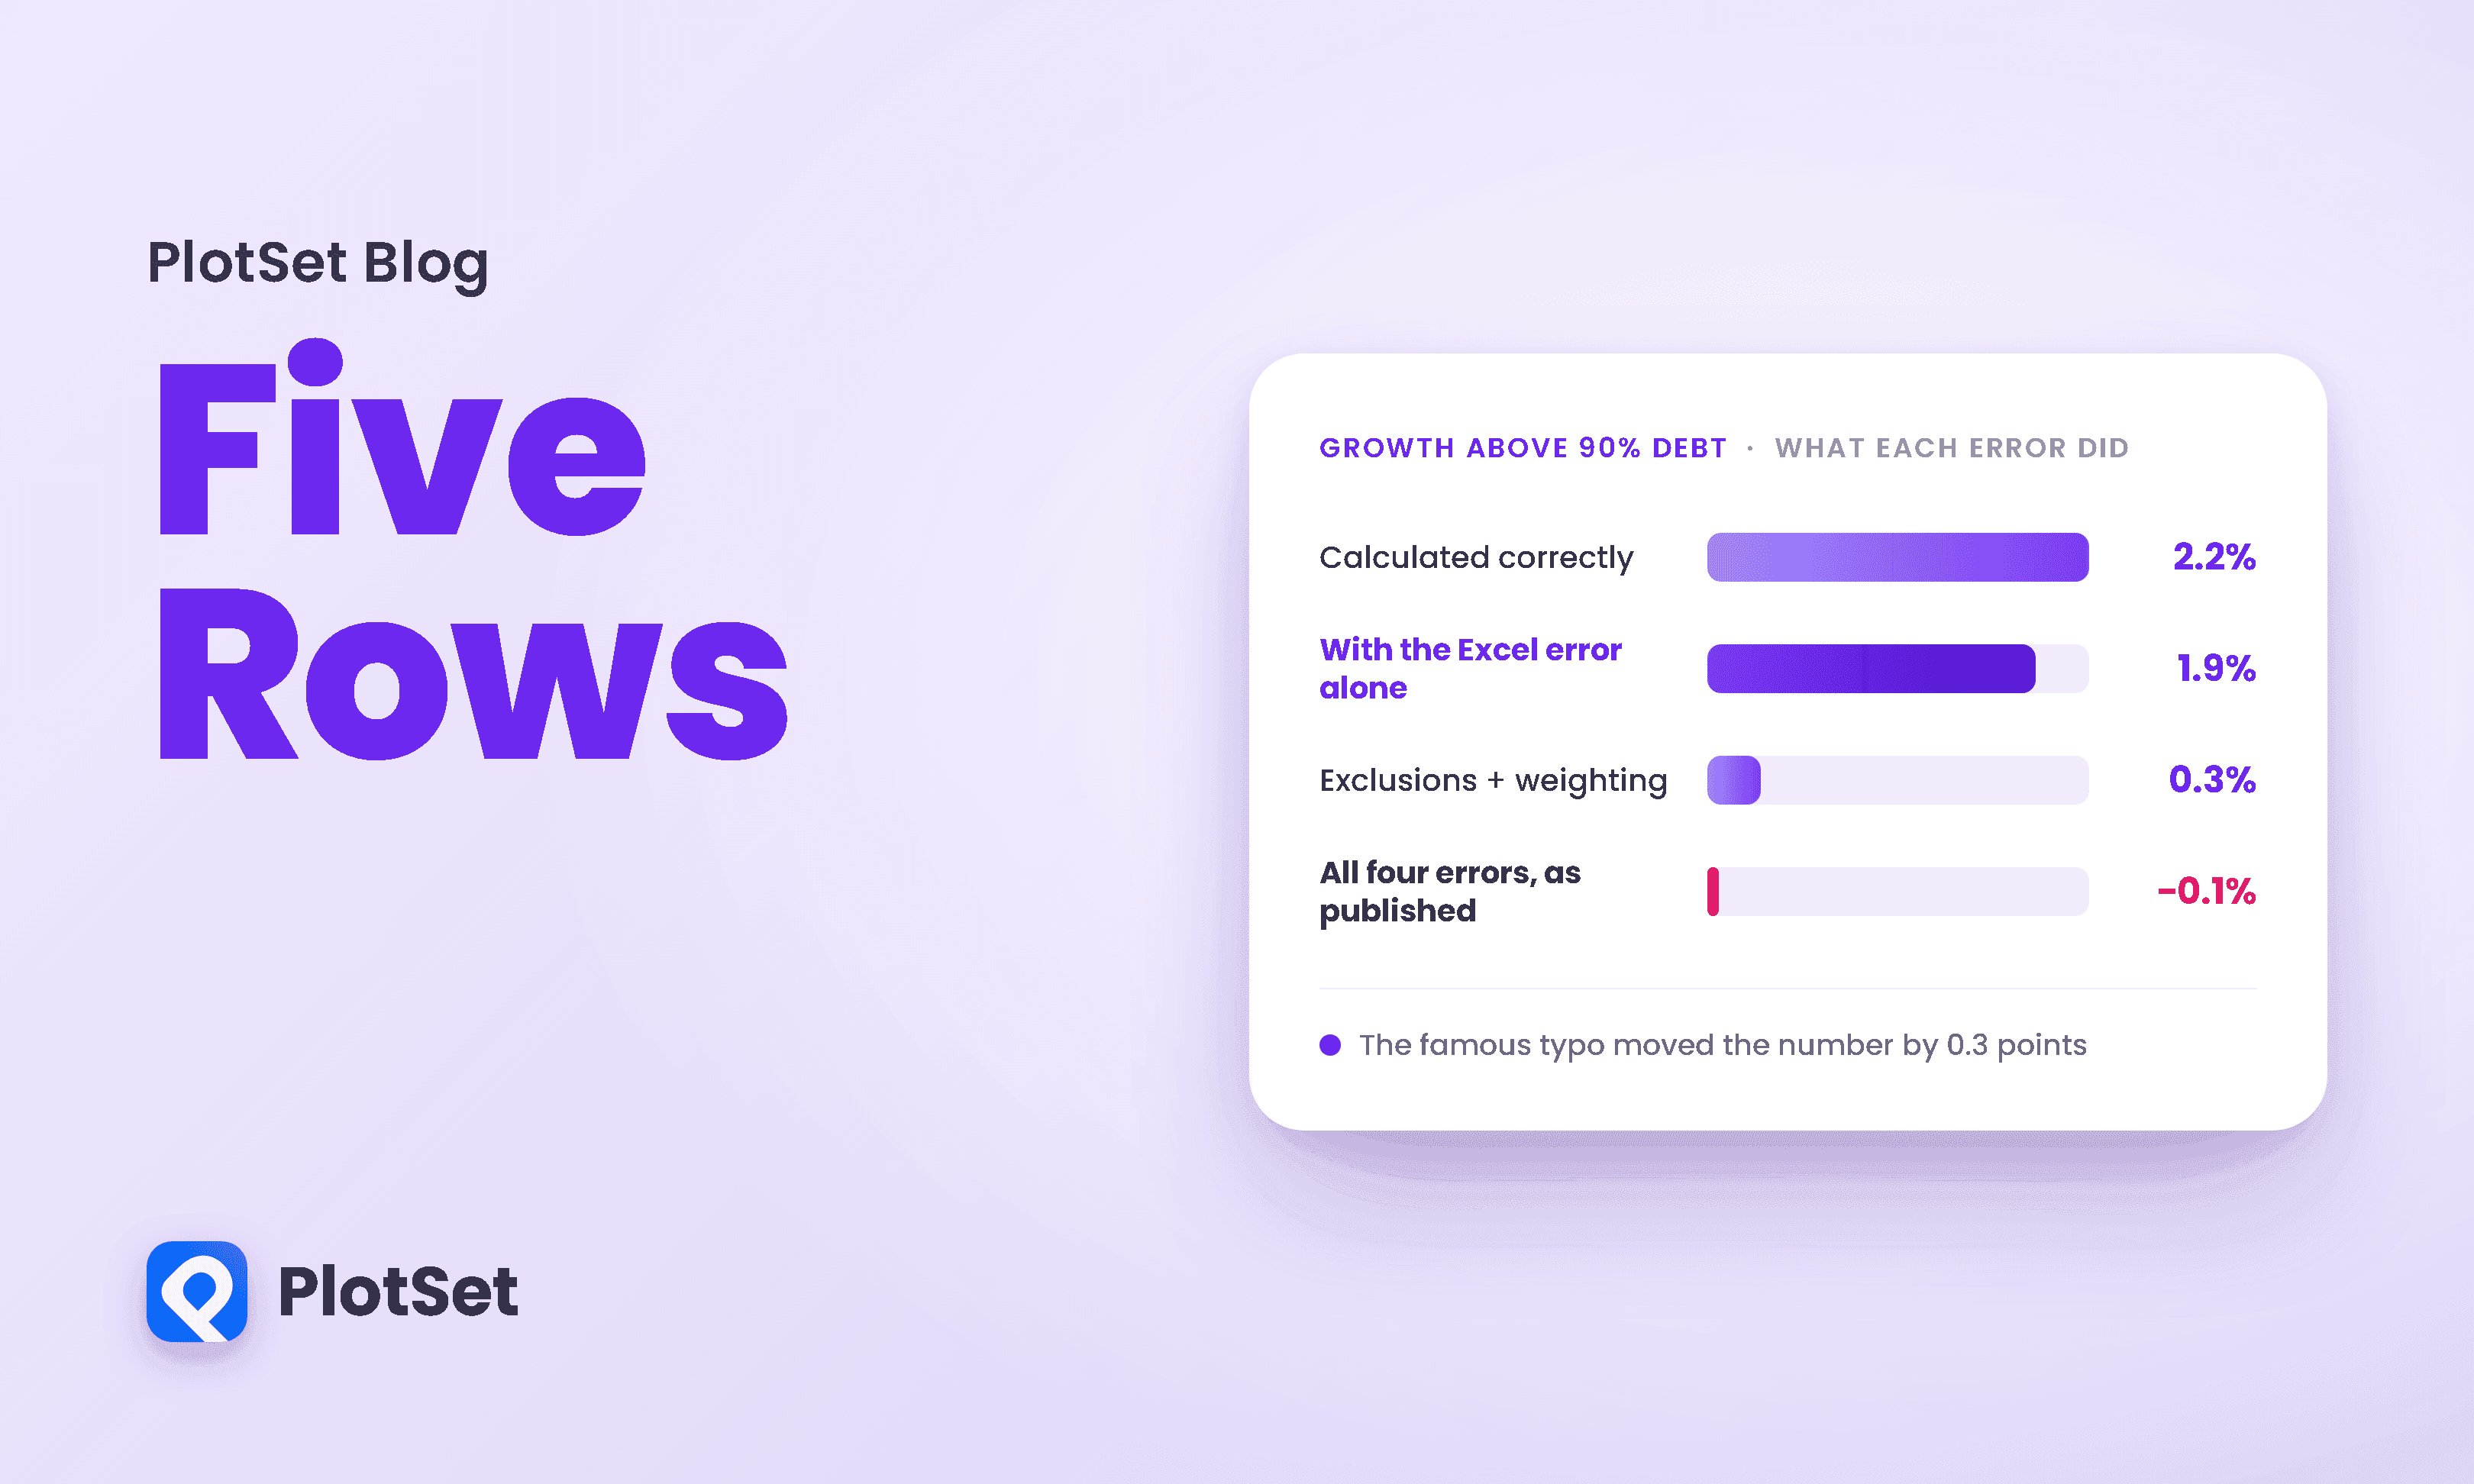
In early 2013 a third-year economics PhD student at the University of Massachusetts Amherst was given a routine assignment: take a famous empirical paper and try to reproduce it.
10 min de lectura
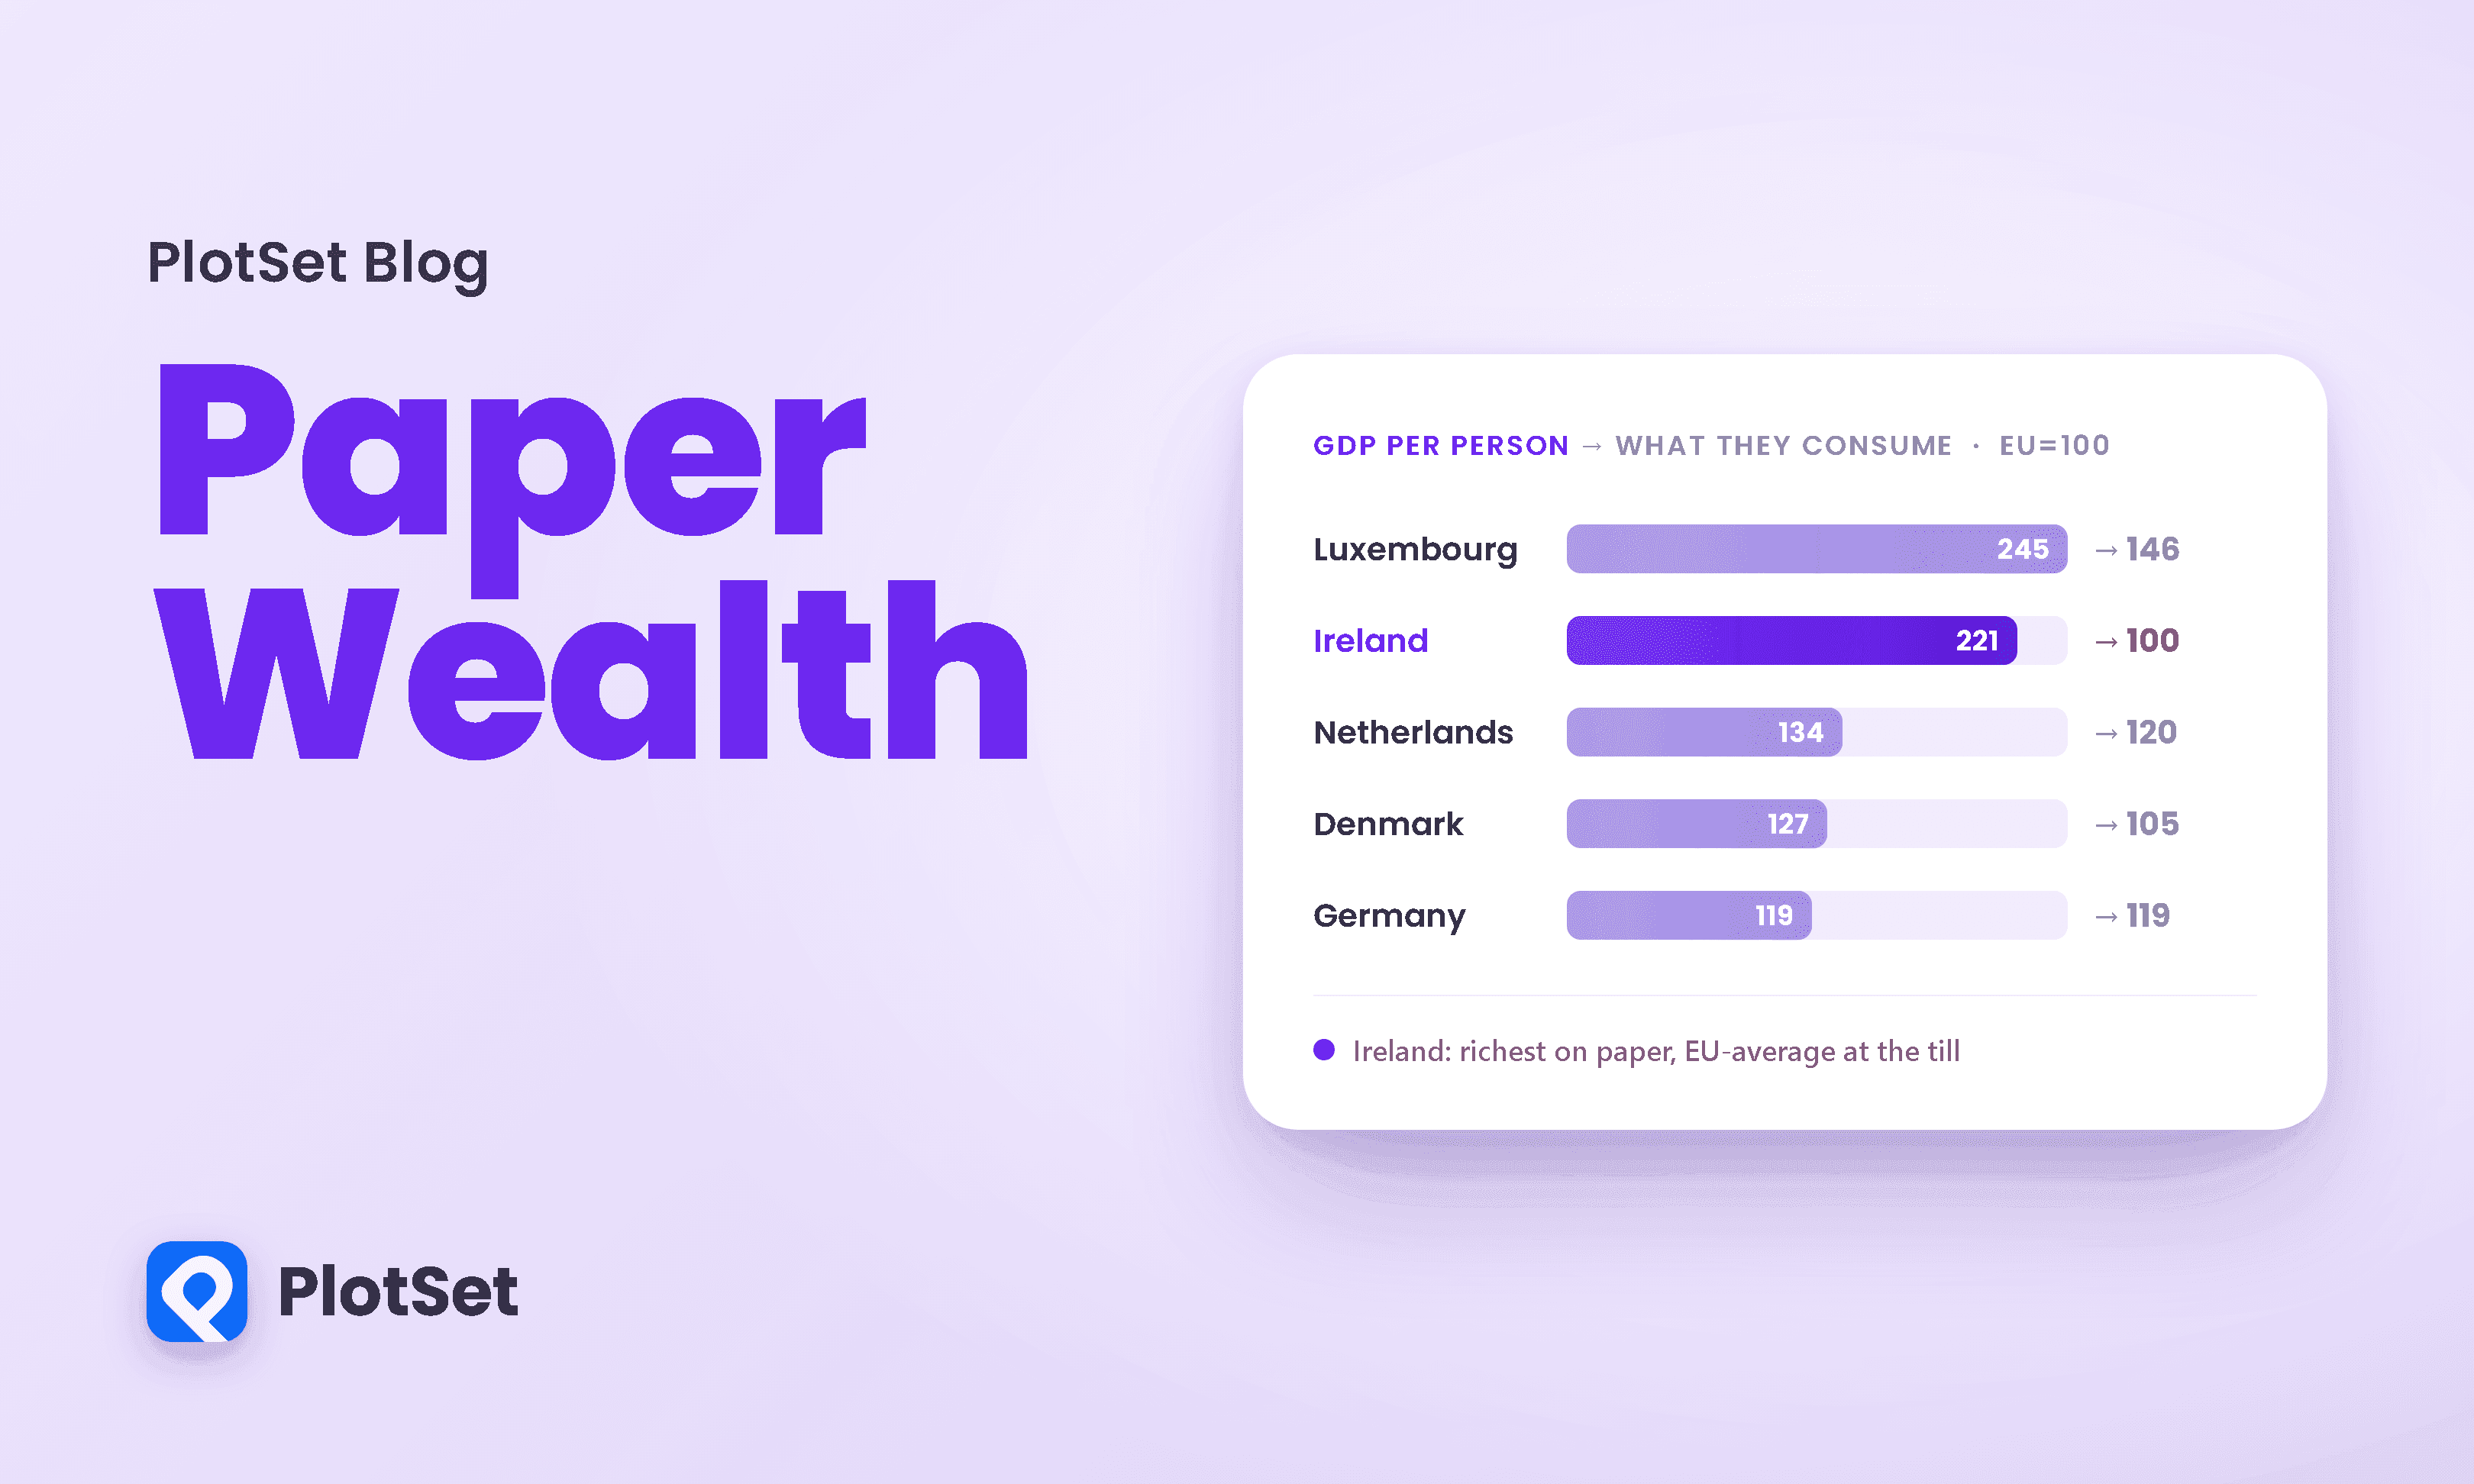
Pull up almost any ranking of the world's richest countries and Ireland is sitting at or near the top, a small island out-earning Switzerland, Norway, and the United States per head.
10 min de lectura