

Pull up almost any ranking of the world's richest countries and Ireland is sitting at or near the top, a small island out-earning Switzerland, Norway, and the United States per head. It is the kind of stat that goes viral: little Ireland, richest in Europe. There is only one problem. Ireland's own statisticians do not believe it. They disbelieve it so completely that in 2017 they built an entirely separate measure of the economy, because the headline number had stopped describing the country and started describing a spreadsheet.
The headline number is gross domestic product, and in 2024 Ireland's came to 562.8 billion euro. The Central Statistics Office's own adjusted measure, built to strip out the distortion, put the real domestic economy at 321.1 billion. The gap dwarfs any rounding error. On paper, Ireland's economy is about three-quarters larger than the one its people actually live in.
Rich on paper, average at the till
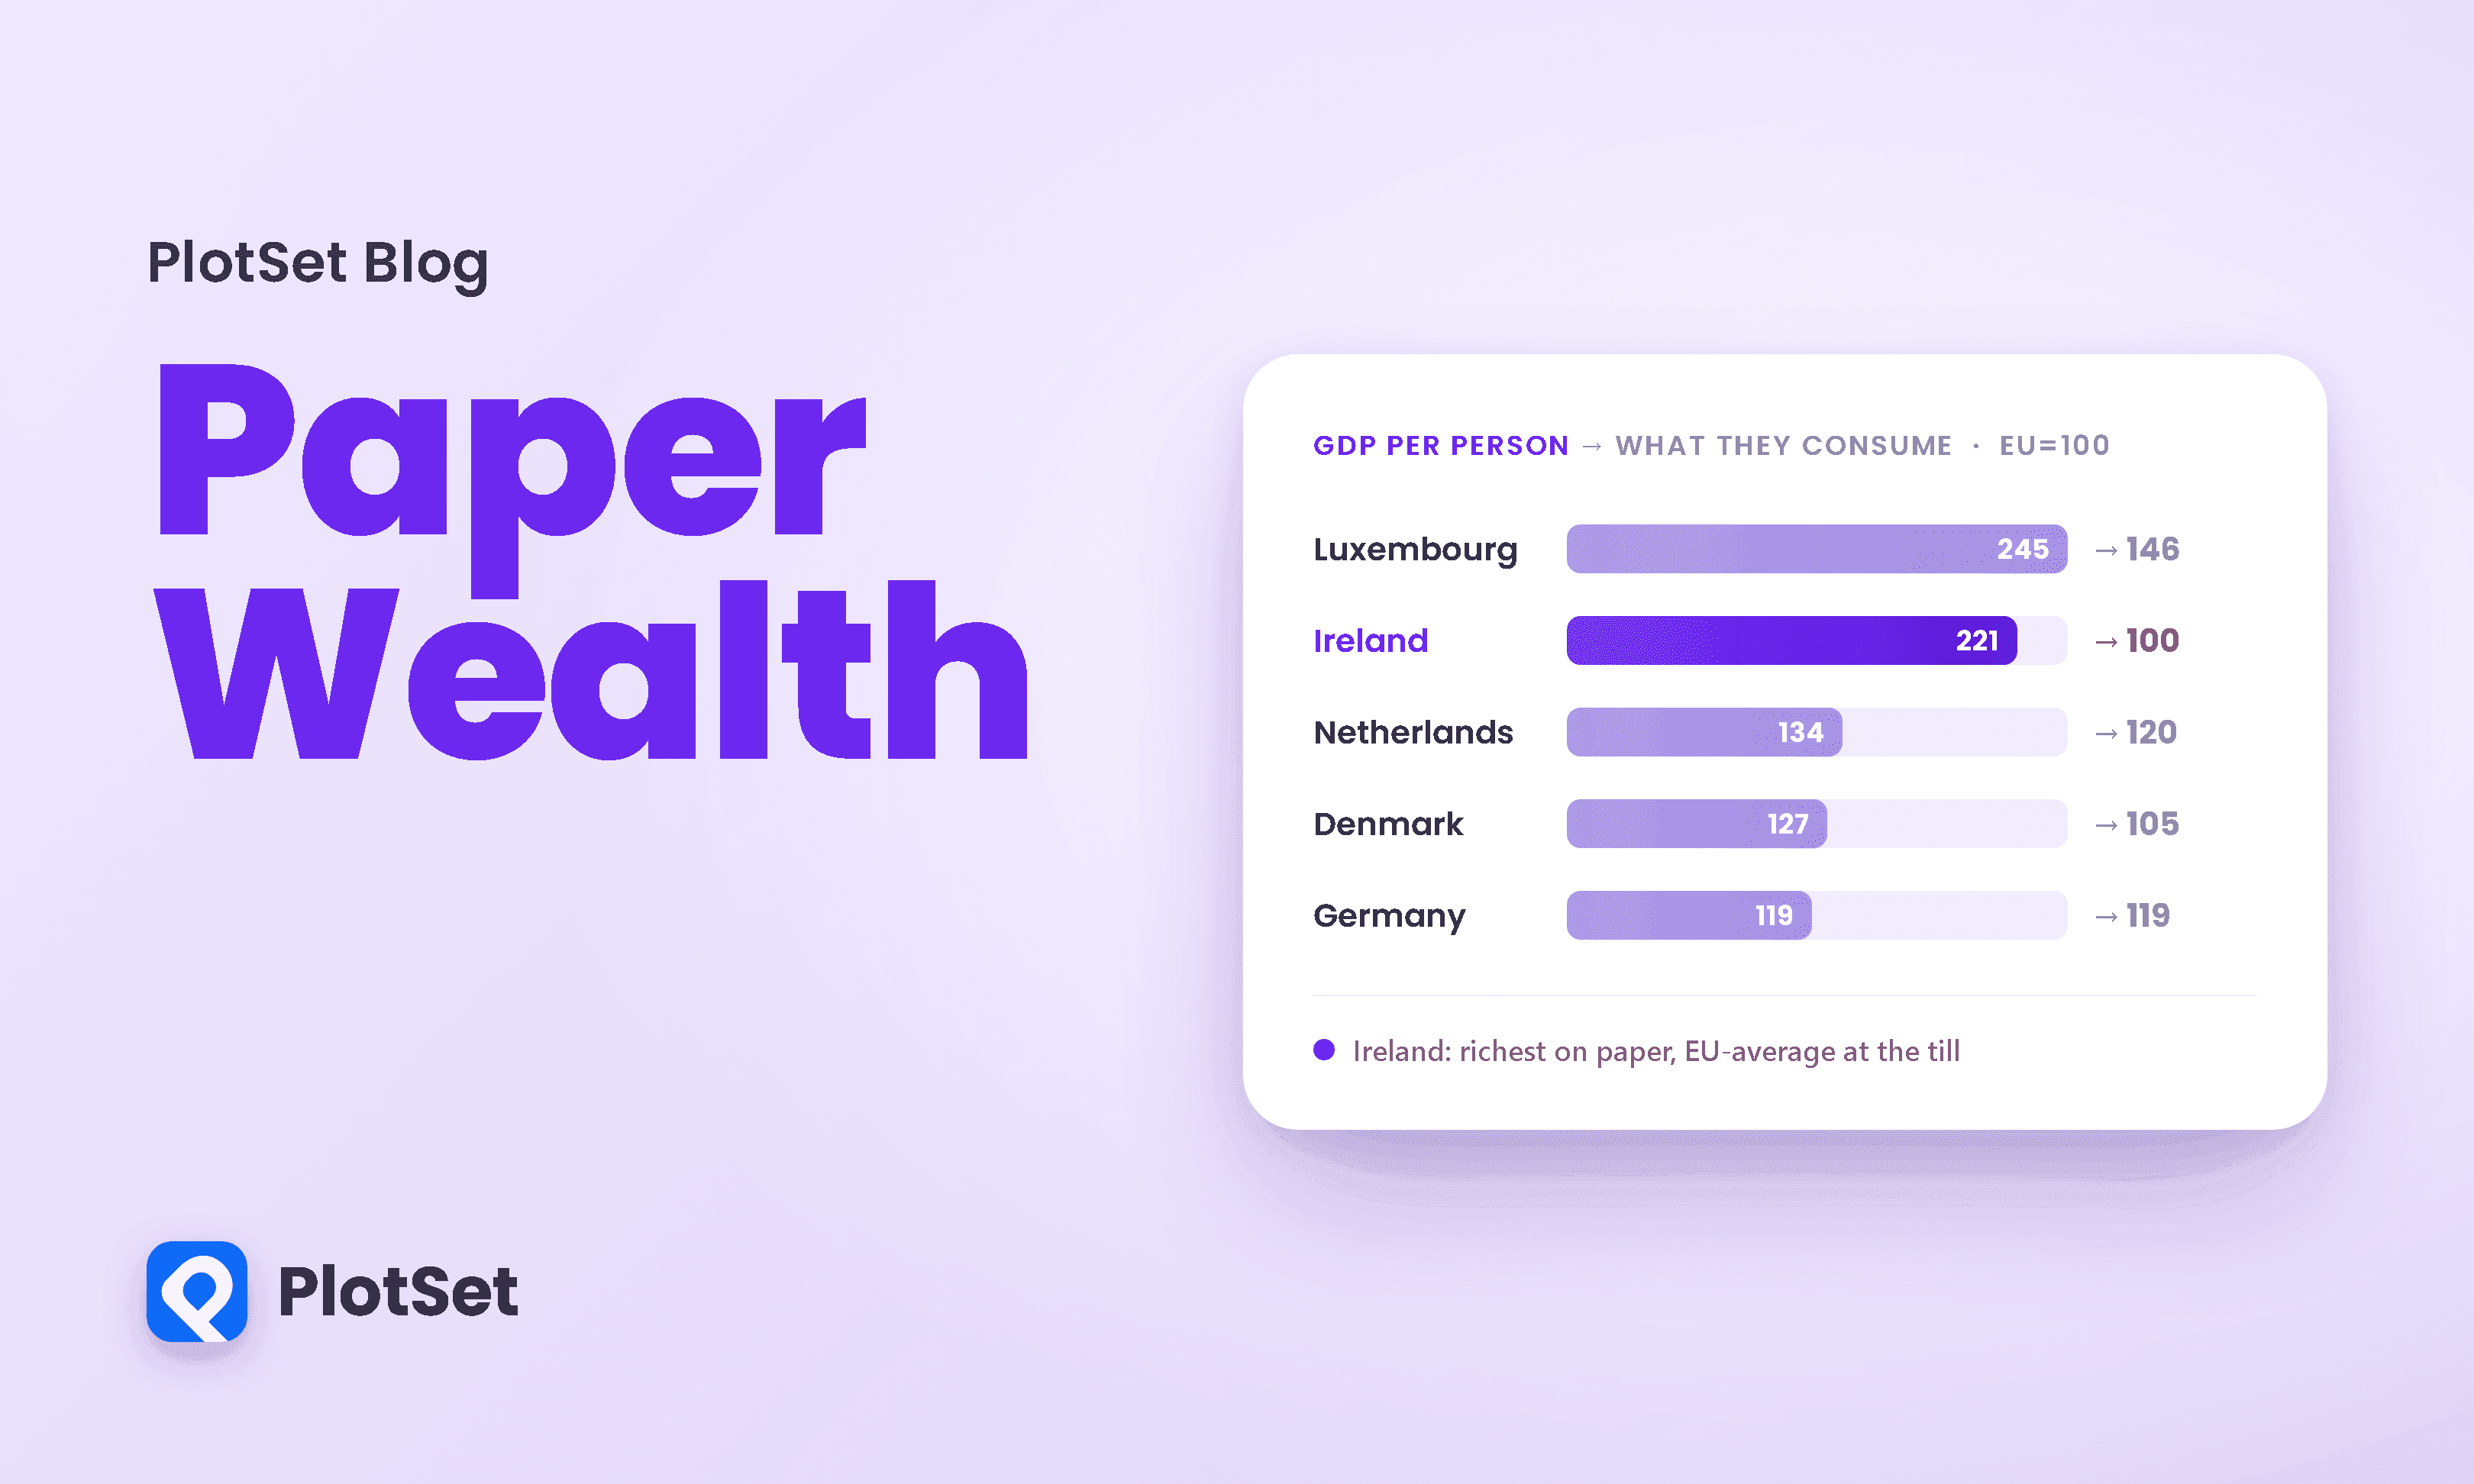
Start with the ranking that started it all, but measured honestly. Economists have a cleaner gauge of how well-off people actually are: actual individual consumption, the goods and services households actually consume, including the public services provided to them in kind, which quietly sidesteps the multinational bookkeeping that inflates output. Line Ireland's GDP per head against its consumption per head, both indexed so the EU average is 100, and the country splits in two.
Every other country in the chart above sits as a tight pair, its output and its consumption within a few points of each other, because in a normal economy the two track together. Ireland is the glaring exception, and its line is the longest in the European Union. Its GDP per capita reads 221, more than double the EU average and second only to Luxembourg. Its consumption per capita reads exactly 100, the EU average to the decimal. Ireland produces like the richest country on the continent and consumes like a perfectly ordinary one.
One caveat, before the easy mockery: Ireland is genuinely prosperous. Wages are high, employment is strong, and on the adjusted measure its income per head still runs about twenty-two percent above the EU average. This is not a story about a poor country pretending to be rich. It is a story about a rich country whose headline statistic has detached from reality, and about every chart that plots the headline number as if it were the real one.
The year the economy grew a quarter
The detachment has a birthday. In July 2016 the CSO reported that the Irish economy had grown by 26.3 percent in a single year, 2015. Not 2.6 percent. Twenty-six. Paul Krugman coined the phrase that stuck: leprechaun economics. The figure was later revised the wrong way, up, to 34.4 percent.
Nothing real grew by a quarter that year. The 2015 bar records a measurement event. The chart plots the internationally comparable growth series, which lands near 25 percent, close to the CSO's original 26.3 percent estimate that was later pushed to 34.4. No factory boom or hiring wave explains any of it, because none happened. What happened was accounting: a handful of multinationals, Apple chief among them, restructured their operations and moved intellectual property assets worth roughly 300 billion dollars onto Irish books. Those patents and licences instantly counted as Irish capital, their global profits as Irish output, and the country's GDP leapt by more than a fifth in twelve months without a single extra worker clocking in. Faced with a number that useless, the CSO did something remarkable for a statistics agency. It built a companion measure, in effect a public admission that its own headline number no longer described the country.
Two economies, one country
The new metric is called modified gross national income, or GNI*, and its whole job is to subtract the multinational mirage: the profits that flow straight back out to foreign parents, the depreciation on those relocated patents, the balance sheets of aircraft-leasing firms and corporate shells that book vast sums through Dublin without employing many people to do it. Plot the official GDP against GNI* and the chart below lets you watch the two Irelands separate.
The two lines march together until 2015, then tear apart and never reconcile. That widening band between them is the part of Irish "output" that no Irish household will ever see. And it is not shrinking. In 2024 GDP was 562.8 billion euro against a modified income of 321.1 billion, a gap of nearly a quarter of a trillion euro that exists only in the ledgers of foreign firms.
Where the phantom money goes
It helps to see exactly what gets stripped out. Take the 2023 accounts, on the vintage published that year and before a later revision nudged the GDP figure up, and the chart below walks from the headline down to the real economy, where four items do almost all of the work.
Some 122 billion euro of profit flows straight out to foreign owners, and another 78 billion is depreciation on foreign-owned intellectual property, patents that live in Ireland for tax purposes and nowhere else. Add the leased aircraft and the redomiciled holding companies and 510 billion of GDP collapses to 291 billion of actual Irish income. The International Monetary Fund put a number on the wider phenomenon in 2019: nearly two-thirds of the foreign direct investment sitting in Ireland was "phantom," money routed through empty corporate shells with no real operations behind it.
None of this means the multinationals are hollow. They are real, and they matter enormously to Ireland. It is just that they matter in a very particular, lopsided way, which the chart below lays bare.
In 2022, foreign multinationals generated around 71 percent of the value added in the business economy and paid roughly 80 percent of all corporation tax, yet they employed only about a quarter of workers and made up barely three percent of firms. That is the whole distortion in one picture. A small number of enormously profitable foreign companies book output far out of proportion to the people they employ, and GDP, which counts the output and ignores who ends up with it, dutifully records a country far richer than the one where people go to work.
No other country looks like this
You might reasonably ask whether every advanced economy has some version of this. They do not. Express Irish GDP as a percentage of its own real income measure and compare it to the roughly one-to-one ratio that holds across the rest of the EU, and, as the chart below shows, Ireland is simply off the scale.
For essentially every European economy, GDP and real domestic income sit within a few percent of each other, the flat line at 100. Ireland's climbed past 160 percent in the leprechaun year of 2015, peaked near 195 percent in 2022, and stood at 175 percent in 2024. There is no second country on that upper line. It is Ireland alone, which is precisely why the CSO had to invent a bespoke measure that no one else needed.
And yet the distorted number is the one that travels. It is the one that feeds the league tables, and on those, Ireland's GDP per capita keeps it perched near the very top, as the chart below shows.
By the IMF's 2026 numbers, Ireland ranks second among the economies the fund fully tracks, around 140,000 dollars a head, behind only Luxembourg and ahead of Switzerland, Singapore, and the United States (a couple of tiny tax microstates aside). Every one of those social-media wealth rankings is plotting this bar. Every one of them is charting a number Ireland's own government statisticians will tell you not to use.
The distortion has a price tag
The fiction is not free, which is the detail that turns this from a statistical curiosity into something with teeth. Several rich-country contributions to shared budgets are scaled to the size of the economy, and an economy inflated by a quarter of a trillion euro looks like it can afford more. When Ireland's GDP ballooned, its bill to the European Union rose with it, by an estimated 380 million euro a year, a levy the country pays on wealth that largely is not there. Dublin has argued the figure down over time, but the principle is unchanged: a measurement artifact became a real transfer.
The timing makes this more than a history lesson. 2026 marks a decade since Krugman's coinage, and the Irish figures are swinging again. Multinationals front-loaded exports to beat looming tariffs, sending Irish GDP up around 13 percent year-on-year in early 2025 on a surge of pharmaceutical shipments, another leap that says more about corporate tax planning than about anyone's standard of living. The gap between the headline and the reality is not closing. It is being redrawn every quarter.
The honest chart
The lesson here is not that Ireland is a fraud or that GDP is worthless. Ireland is a genuinely wealthy, successful economy, and GDP remains a reasonable measure for most countries most of the time. The lesson is narrower and sharper. A statistic can be technically correct and still describe a fiction, and the country's own statisticians can say so in public while the rest of the world keeps plotting the number anyway. Ireland built GNI* precisely so there would be an honest line to draw. The next time a chart crowns the richest country in Europe, the only real question is which of its two economies you are looking at.
References
- Central Statistics Office, Ireland. Annual National Accounts 2024 (Key Findings). The official 2024 GDP of EUR 562.8 billion and Modified GNI (GNI*) of EUR 321.1 billion, 57.1 percent of GDP.
- Eurostat (European Commission). Household material welfare varies widely in the EU (December 2025). Ireland's GDP per capita index of 221 against actual consumption per capita of 100, the EU's widest gap.
- Central Statistics Office, Ireland. GNI* and De-Globalised Results, Annual National Accounts 2023. The decomposition of the GDP-to-GNI* wedge, including EUR 121.9 billion in outbound profits and EUR 78.3 billion in foreign-IP depreciation.
- International Monetary Fund (Damgaard, Elkjaer & Johannesen). The Rise of Phantom Investments (Finance & Development, 2019). The finding that nearly two-thirds of Ireland's inward FDI is phantom investment through empty corporate shells.
- International Monetary Fund / Wikipedia. List of countries by GDP (nominal) per capita. Ireland ranked second among mainstream economies on nominal GDP per capita, around USD 140,000 for 2026, behind Luxembourg.
- Central Statistics Office, Ireland. Business in Ireland 2022 — Insights on Multinationals. Foreign multinationals at roughly 71 percent of value added and 80 percent of corporation tax but only about 27 percent of employment.
- Wikipedia (CSO / Krugman / Bloomberg primary sources). Leprechaun economics. The 26.3 percent 2015 growth figure (revised to 34.4 percent), Krugman's 2016 coinage, Apple's roughly USD 300 billion IP move, and the estimated EUR 380 million annual EU levy.
- Wikipedia (CSO / ESRG source data). Modified gross national income. The origin and rationale of GNI*, and the 2017 figure showing Irish GDP at 162 percent of GNI* against roughly 100 percent for the EU.
- Wikipedia (CSO / IFAC / Revenue Commissioners). Economy of the Republic of Ireland. GNI* per capita about 22 percent above the EU average, and the concentration of corporation tax among a handful of foreign firms.
- The Irish Times. Welcome (back) to the era of Leprechaun economics (May 2025). The 2025 GDP surge from multinationals front-loading exports ahead of tariffs.
- World Bank. Ireland GDP growth (annual %). The annual real GDP growth series behind the 2015 outlier and the multinational-driven volatility.
- Central Statistics Office, Ireland. Modified GNI explained. The statistics office's own explanation of why GNI* was created and what it removes from GDP.
- Irish Fiscal Advisory Council. Fiscal and economic analysis. Analysis of Ireland's reliance on a concentrated group of foreign multinationals for output and tax, and the risks that reliance creates.


