
Beispiel-CSV
| Node | Parent | Spend |
|---|---|---|
| Marketing | ||
| Paid Search | Marketing | 42000 |
| Paid Social | Marketing | 31000 |
| Organic Content | Marketing | 18000 |
| Google Ads | Paid Search | 27000 |
| Bing Ads | Paid Search | 15000 |
| Instagram Ads | Paid Social | 19000 |
| Facebook Ads | Paid Social | 12000 |
A step by step walkthrough for turning a spreadsheet of parent, child and value rows into a published sunburst chart in PlotSet, from shaping the sheet to exporting the finished rings.
Etwa 9 MinutenRings sized by value and coloured by branch, published as a live embed or exported as a static image: this guide is how to create a sunburst chart in PlotSet from your own spreadsheet. The columns below are the exact node, parent and value columns the PlotSet sunburst template expects, not a simplified stand-in for them.
Nine minutes gets you there when your rows are already three clean columns: node, parent, value. A source report that only lists department totals adds another five, since you'll need to add the missing middle level of the hierarchy yourself before anything renders correctly.
One row per node, three columns: the node's own name, the name of its parent (blank for the top level), and its value. Every parent name must match another row's node name exactly.
| Node | Parent | Spend |
|---|---|---|
| Marketing | ||
| Paid Search | Marketing | 42000 |
| Paid Social | Marketing | 31000 |
| Organic Content | Marketing | 18000 |
| Google Ads | Paid Search | 27000 |
| Bing Ads | Paid Search | 15000 |
| Instagram Ads | Paid Social | 19000 |
| Facebook Ads | Paid Social | 12000 |
Leave the parent column blank only for the root node or nodes. Every other row needs a parent value that matches another row's node name exactly, including case.
Leave the value blank on any node whose number should be computed from its children. PlotSet sums descendants automatically, and typing your own figure there is how rings end up not matching their children.
Node names must be unique across the whole sheet, not just within one branch. If two branches each have a leaf called "Other," rename them ("Search Other," "Social Other") or PlotSet will merge them into one segment.
Keep the value column numeric with no currency symbols or thousands separators. A stray comma or dollar sign turns the whole column to text and every arc collapses to zero.
Der genaue Klickpfad in PlotSet, von einer leeren Vorlage bis zum fertigen Diagramm.
From the PlotSet dashboard, start a new project and choose the Sunburst Chart template. It loads with a small sample hierarchy already bound, so you can see exactly how a node, parent and value row turns into a ring before you touch your own file.

Give every row a node name, the name of the node it sits under, and a number. Top level nodes get a blank parent. If your source is a pivot table with only totals, add the missing middle rows yourself: PlotSet cannot infer a level you never wrote down.
Use the data panel to import a CSV or .xlsx file, paste rows directly from a spreadsheet, or connect a Google Sheet if you want the rings to update later without a re-upload. PlotSet reads the first row as headers automatically.

Confirm which column PlotSet is reading as the node, which as the parent, and which as the value. This usually maps itself correctly when your headers say what they mean, but check it by hand if your sheet carries extra columns PlotSet had to guess between.

Before you style anything, scan each branch and confirm its children add up to the number you expect for the parent, or that the parent's value cell is simply blank. A mismatch here is the single most common reason a sunburst chart looks broken once it renders.
Assign one hue per top level branch and let PlotSet shade its descendants lighter going outward, rather than colouring by depth or leaving the palette random. Turn labels on for rings with room to show them and off for the thin outer ring, where hover tooltips do the job instead.
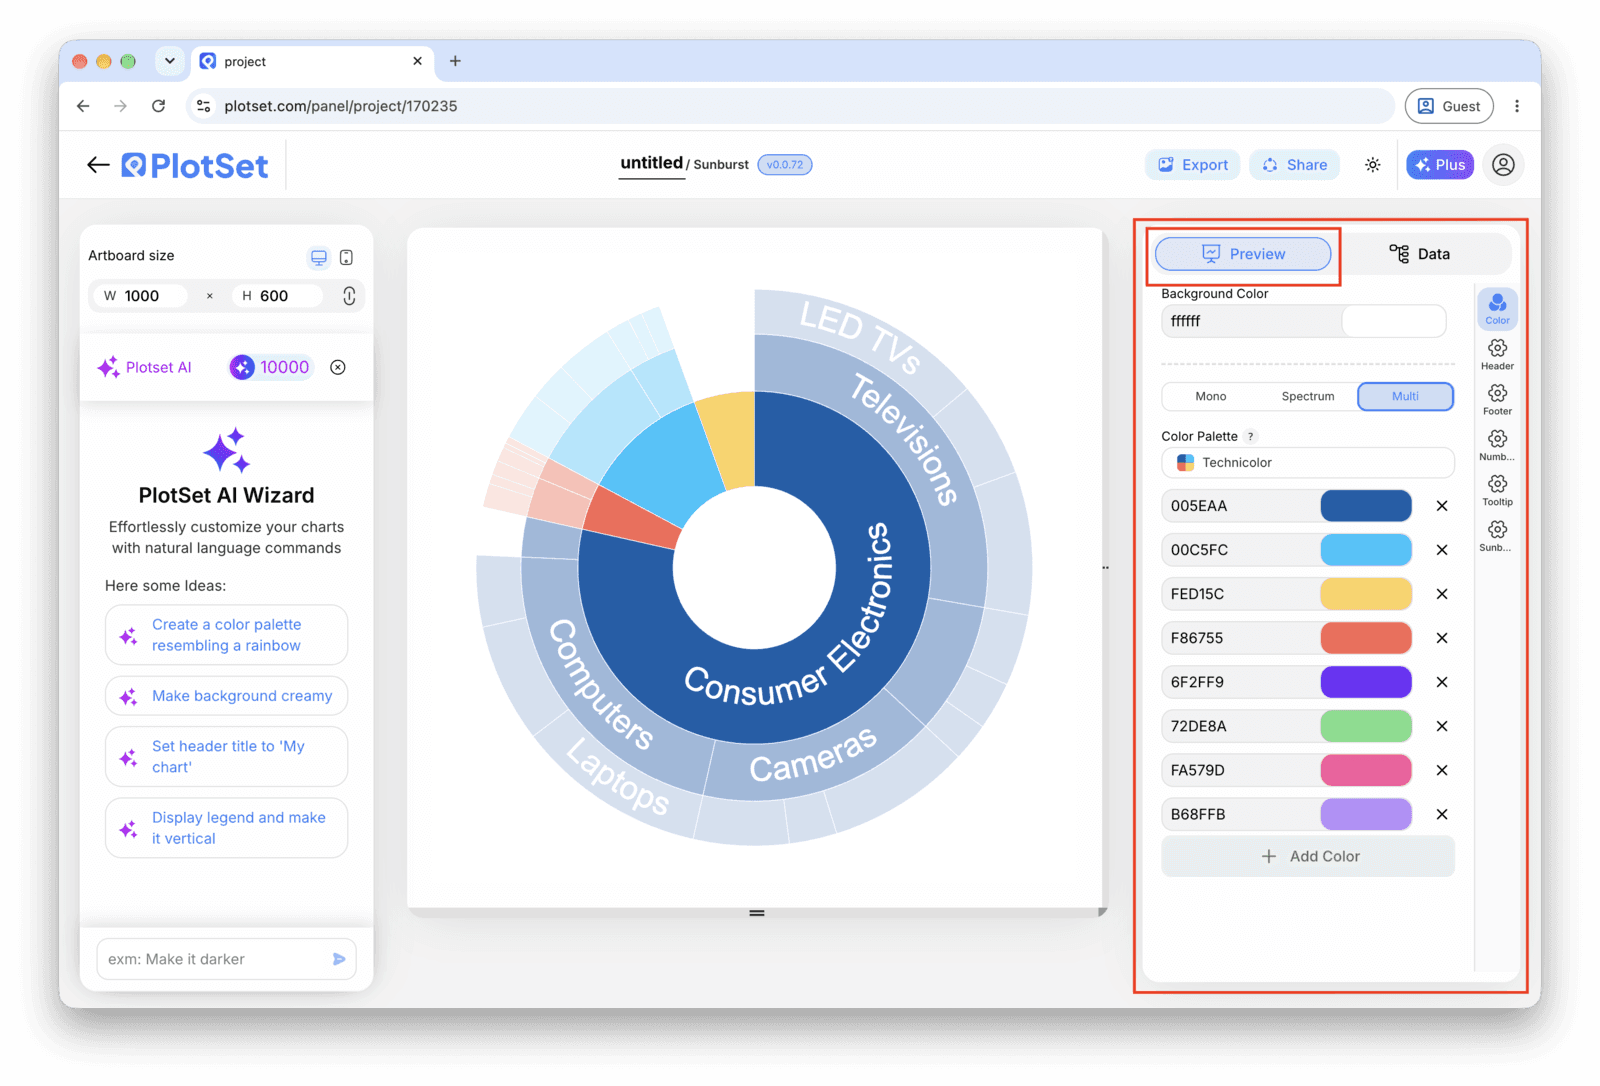
If your hierarchy runs three or four levels deep, enable click-to-zoom so a reader can click a segment and make it the new centre. Past two levels a static sunburst is hard to read on its own; drill-down is what makes the extra depth usable.
Publish for a live, interactive chart with hover tooltips, drill-down and a shareable link, grab the embed code to drop it into a page, or export a PNG, SVG or PDF if you need a static image for a deck or a report.
Starten Sie mit der Sunburst Chart-Vorlage samt bereits geladenen Beispieldaten und ersetzen Sie diese durch Ihre eigenen.
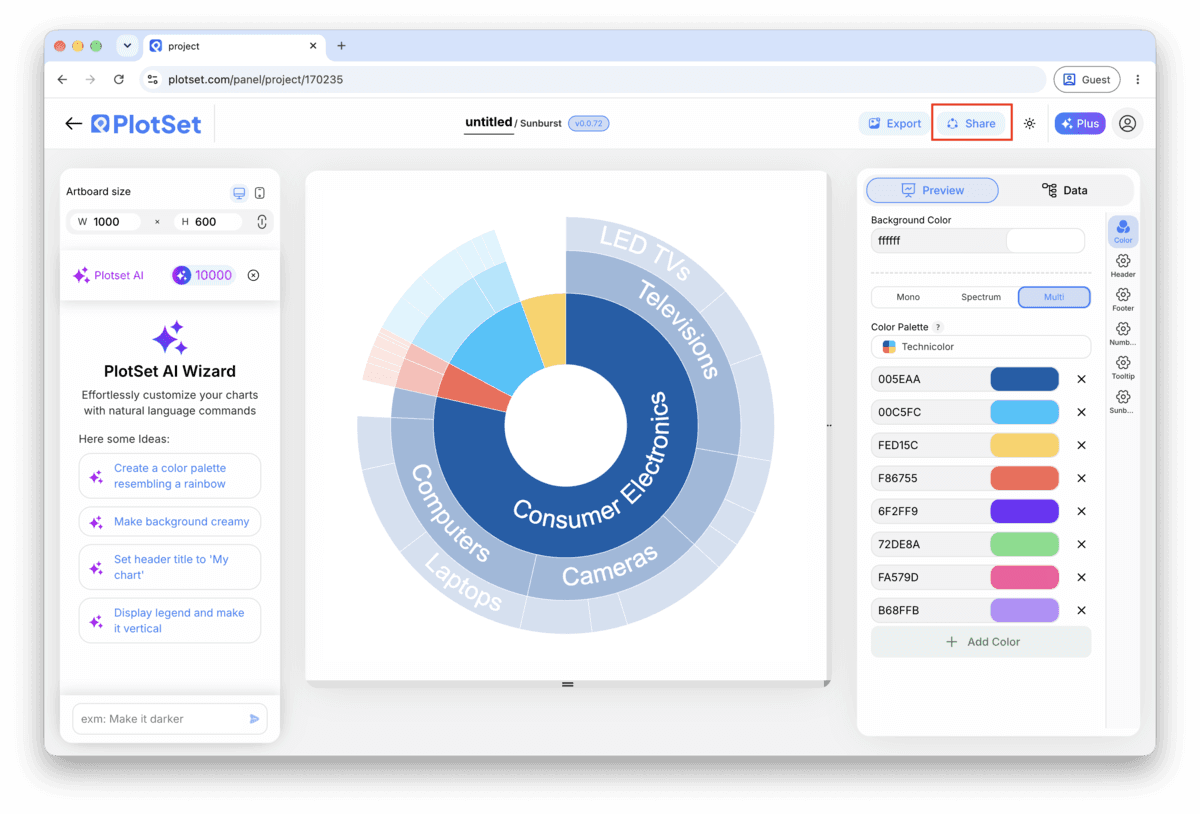
Vorlage öffnenDer letzte Abschnitt ist bei jedem Diagrammtyp gleich: "Share" macht aus dem Diagramm einen öffentlichen Live-Link und einen Einbettungscode, "Export" schreibt es als statische Datei heraus.
Aktivieren Sie den Einbettungscode und den öffentlichen Link, um das Diagramm zu veröffentlichen. Den Link können Sie bedenkenlos an alle weitergeben, und der Einbettungscode fügt sich als iframe in jede Seite ein. Die Tooltips beim Überfahren mit der Maus und die volle Interaktivität bleiben erhalten. Wenn Sie das Diagramm später bearbeiten, überträgt "Recreate" die Änderungen auf Link und Einbettung.

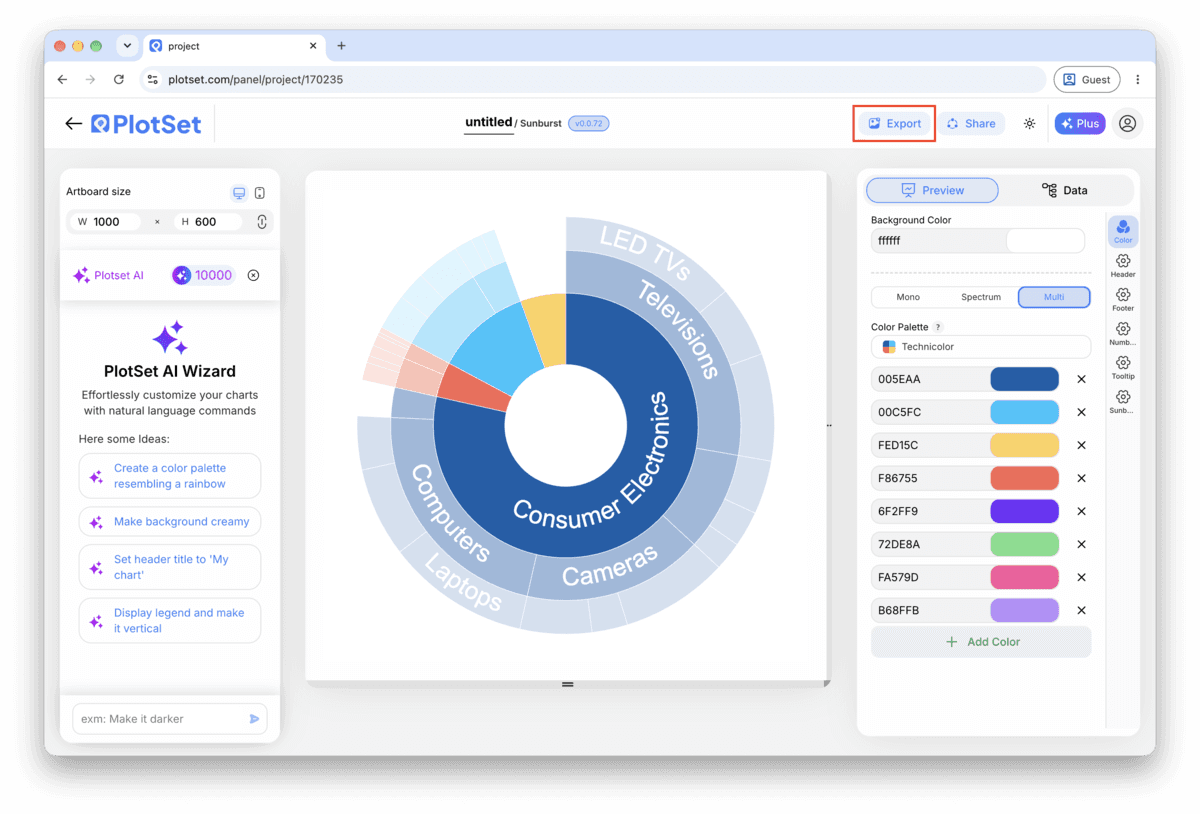
"Export" schreibt eine statische Kopie in der Größe heraus, die Sie brauchen. SVG bleibt in jeder Skalierung scharf und lässt sich weiterhin in einem Design-Tool bearbeiten; PNG und JPG sind die sichere Wahl für Folien und Dokumente. Der Skalierungsfaktor sorgt dafür, dass das Bild auf einem Retina-Display gestochen scharf wirkt.

Two or three levels is where a sunburst chart is easiest to read. A fourth level is workable with drill-down turned on; a fourth level on a static export is usually just noise.
Within a single parent, order the children largest to smallest before uploading. It gives every ring the same reading direction and makes the size comparison between siblings obvious without labels.
Pick a base hue per top level node and let PlotSet's depth shading handle the rest. Mixing unrelated colours within one branch defeats the one thing colour does for this chart: letting the eye follow a branch outward.
If a branch has a dozen tiny children and three large ones, roll the tiny ones into a single "Other" node with its own row. It keeps the outer ring legible instead of scattering slivers nobody can click.
This means a parent's arcs do not add up to that parent's own value, whether it was typed by hand or the children are missing a row. Sum the children yourself against the parent's number, fix the mismatched row, and leave the parent's value cell blank going forward so PlotSet computes it.
Both come from the colour mode being set to depth or to a default palette instead of branch. Open the colour settings and switch to colour by branch, which is what keeps a parent and its descendants visually connected as you read outward.
This is almost always too many leaf categories on one branch, sometimes combined with a level that did not need to exist. Roll the smallest leaves into an "Other" node in your source sheet, or turn on drill-down so the reader can zoom into one branch at a time instead of seeing all of them at once.
Nicht sicher, ob Sunburst Chart die richtige Wahl ist? Erfahren Sie, was es ist, wann Sie es verwenden sollten und wann nicht.
Three columns: a node name, its parent's name, and a value. Top level nodes leave the parent blank, and every other row's parent must match another row's node name exactly. CSV and .xlsx both work, and a pasted range from any spreadsheet tool is fine too.
Kostenlos starten mit über 300 Vorlagen. Keine Kreditkarte erforderlich.