
Jedes Diagramm hier war zuerst eine Tabelle.
Karten, Bar-Chart-Races, Treemaps, Piktogramme und mehr. Eines öffnen und mit eigenen Daten nachbauen.
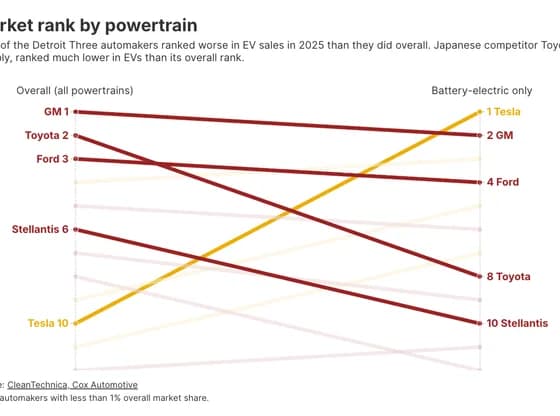 Slope chartMarket rank by powertrain
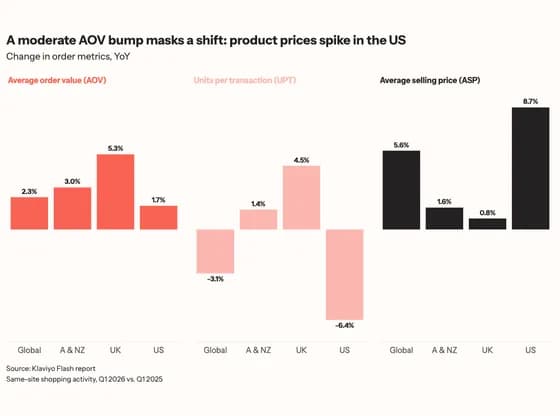 Line, bar and pie chartsA moderate AOV bump masks a shift: product prices spike in the US
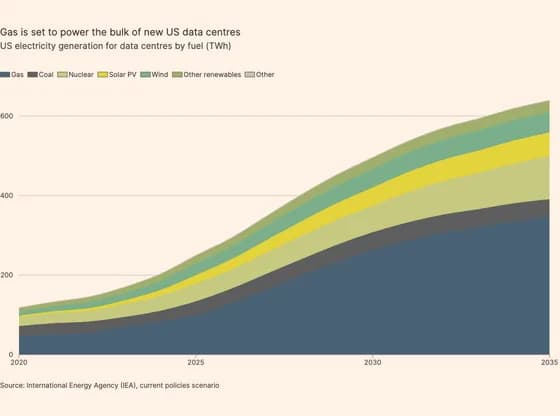 Line, bar and pie chartsGas is set to power the bulk of new US data centres
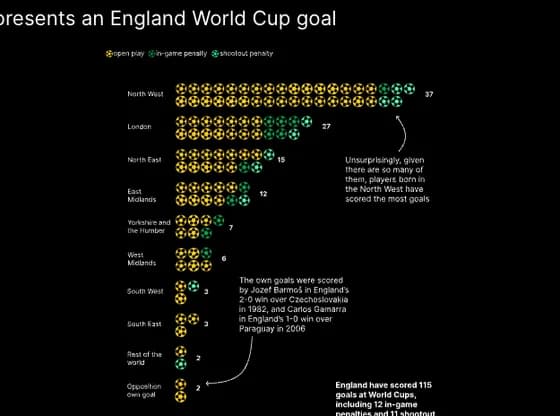 Interactive SVGWhere do the goals come from?
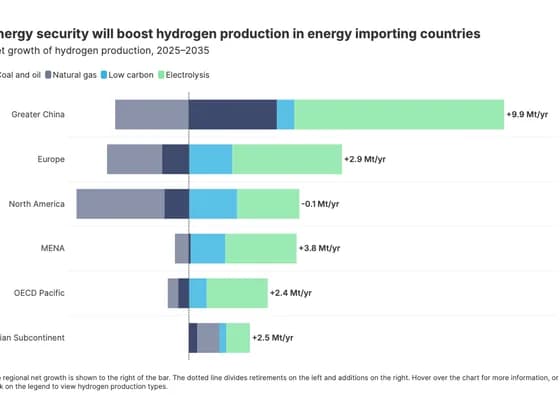 Line, bar and pie chartsEnergy security will boost hydrogen production in energy importing countries
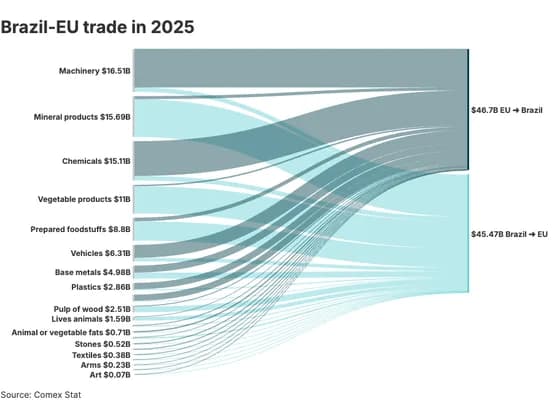 Sankey diagramBrazil-EU trade in 2025
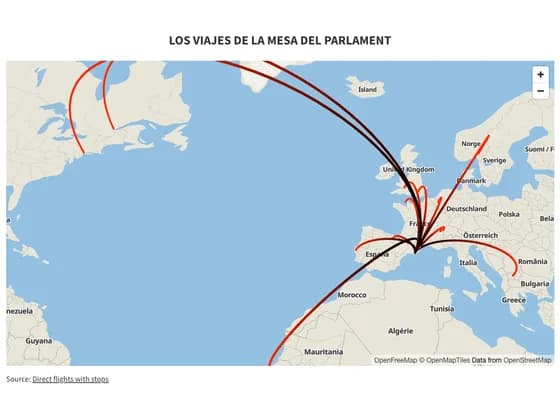 3D mapLOS VIAJES DE LA MESA DEL PARLAMENT
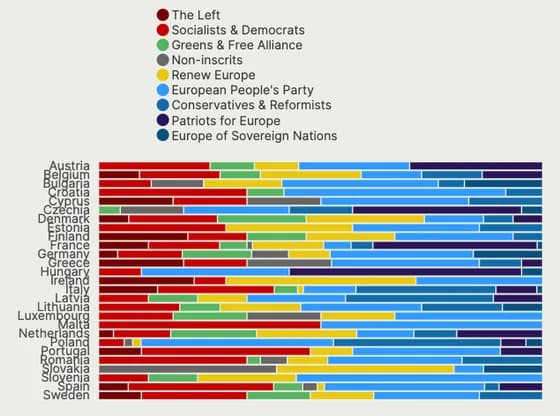 Line, bar and pie chartsPolitical Groups of the European Parliament by State Delegation
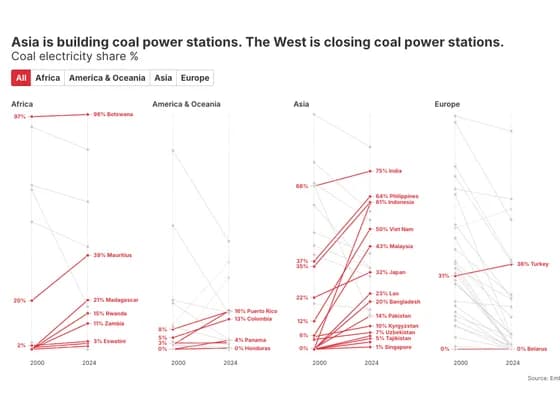 Slope chartAsia is building coal power stations. The West is closing coal power stations.
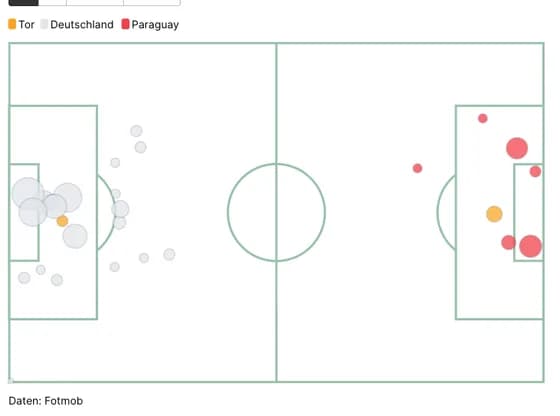 SportsDFB-Team Chancen vs Paraguay
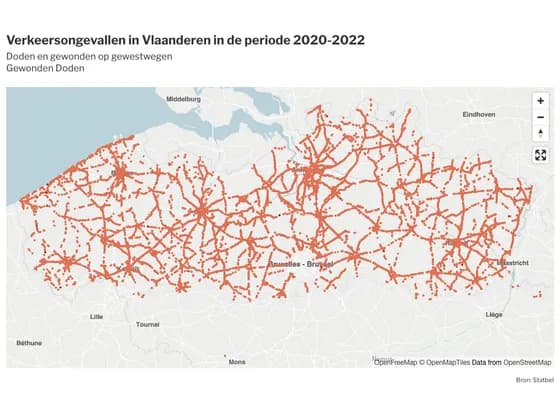 3D mapVerkeersongevallen in Vlaanderen in de periode 2020-2022
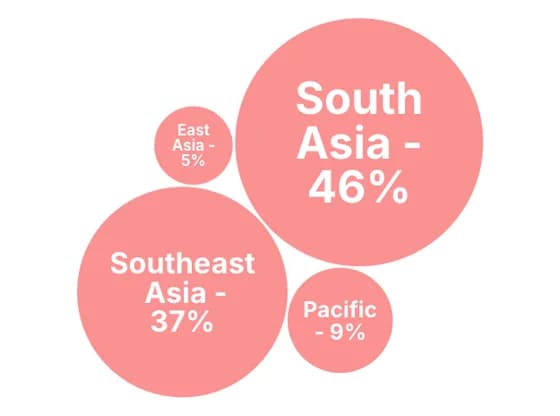 Distribution chartsPercentage of grants disbursed by region, 2025
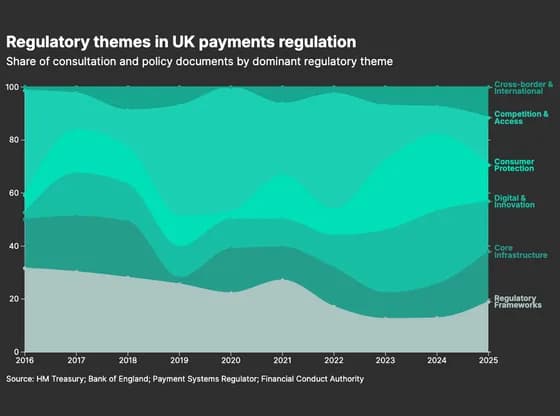 Line, bar and pie chartsRegulatory themes in UK payments regulation
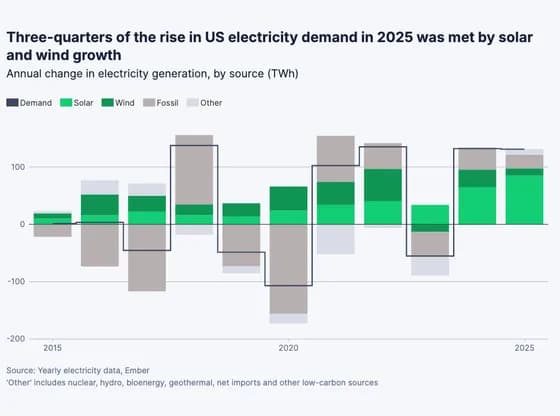 Line, bar and pie chartsThree-quarters of the rise in US electricity demand in 2025 was met by solar and wind growth
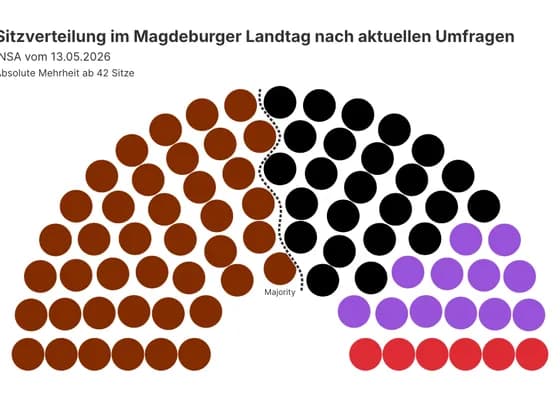 Elections and parliamentsSitzverteilung im Magdeburger Landtag nach aktuellen Umfragen
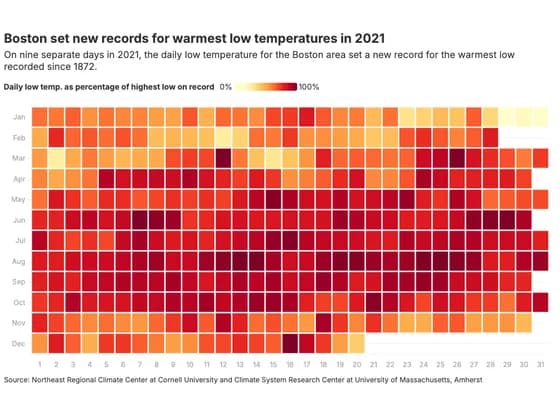 HeatmapBoston set new records for warmest low temperatures in 2021
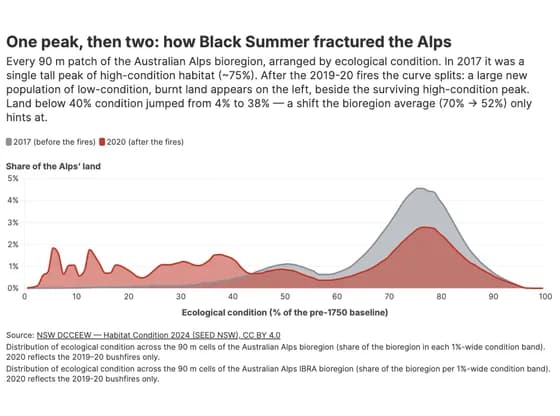 Line, bar and pie chartsOne peak, then two: how Black Summer fractured the Alps
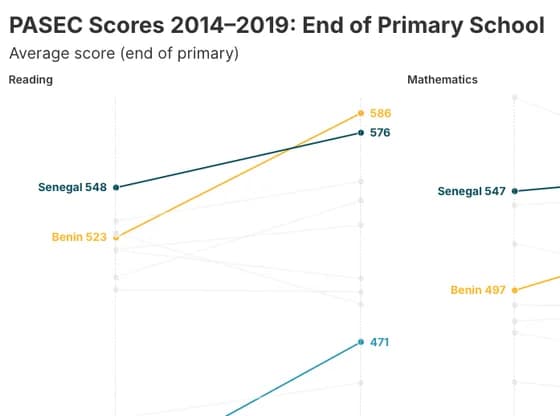 Slope chartPASEC Scores 2014–2019: End of Primary School
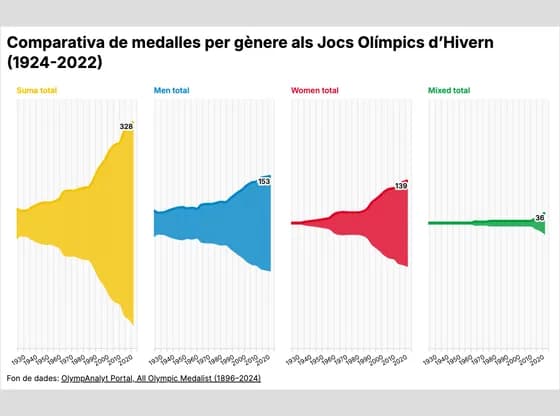 Line, bar and pie chartsComparativa de medalles per gènere als Jocs Olímpics d’Hivern (1924-2022)
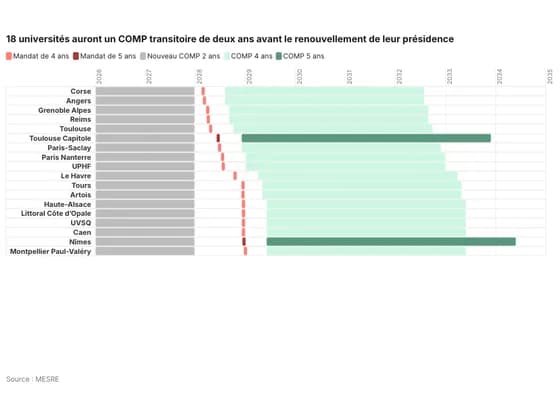 Gantt chart18 universités auront un COMP transitoire de deux ans avant le renouvellement de leur présidence