
Jedes Diagramm hier war zuerst eine Tabelle.
Karten, Bar-Chart-Races, Treemaps, Piktogramme und mehr. Eines öffnen und mit eigenen Daten nachbauen.
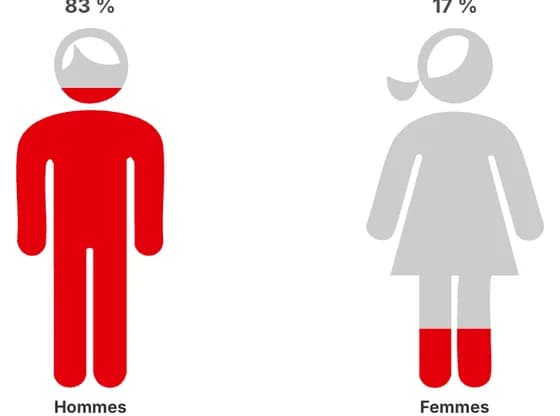 PictogramProportion de maires élus en 2020, selon leur genre
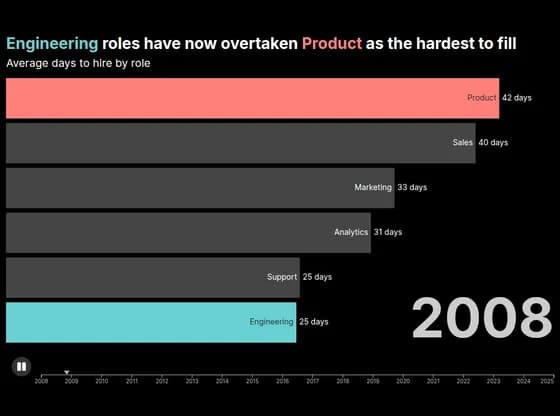 Animated chartsEngineering roles have now overtaken Product as the hardest to fill
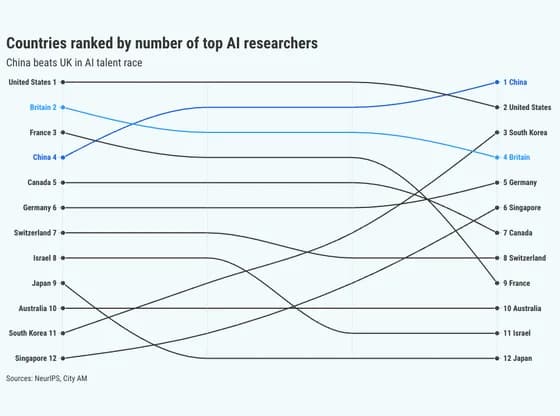 Slope chartCountries ranked by number of top AI researchers
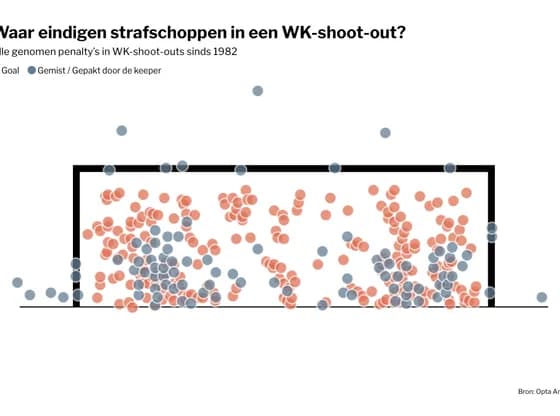 SportsWaar eindigen strafschoppen in een WK-shoot-out?
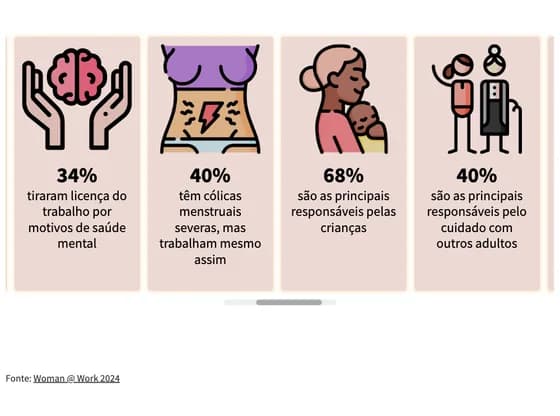 CardsMulheres e mercado de trabalho
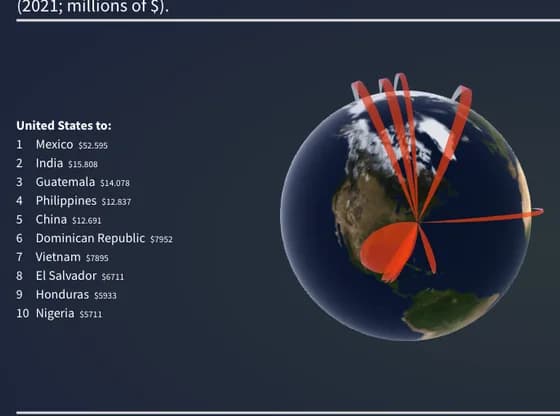 Connections and flow mapsWhere U.S. remittances are headed
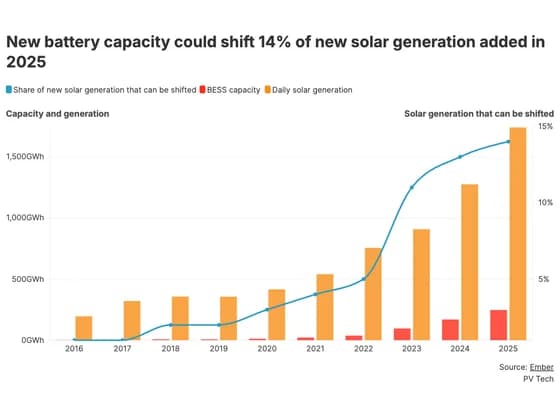 Line, bar and pie chartsNew battery capacity could shift 14% of new solar generation added in 2025
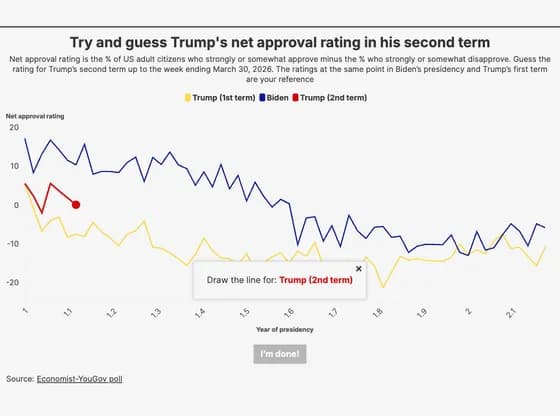 Interactive toolsTry and guess Trump's net approval rating in his second term
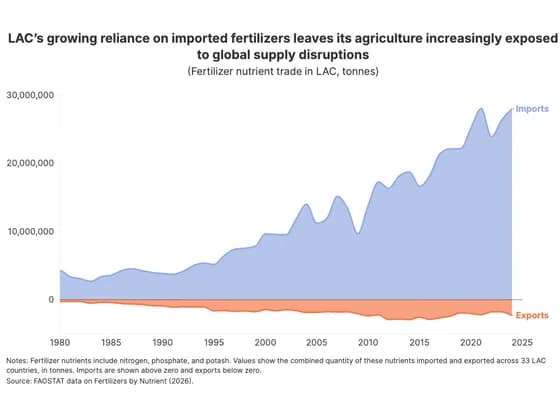 Line, bar and pie chartsLAC’s growing reliance on imported fertilizers leaves its agriculture increasingly exposed to…
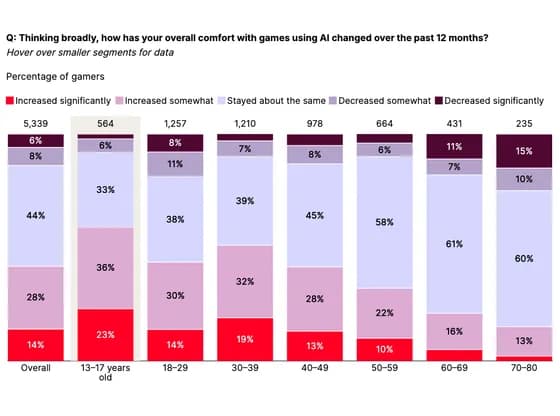 Line, bar and pie chartsQ: Thinking broadly, how has your overall comfort with games using AI changed over the past 12…
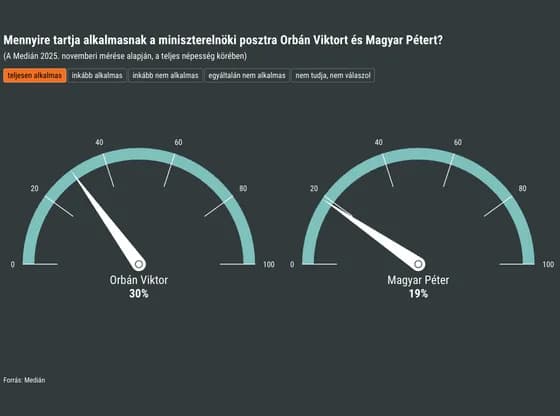 Counters and gaugesMennyire tartja alkalmasnak a miniszterelnöki posztra Orbán Viktort és Magyar Pétert?
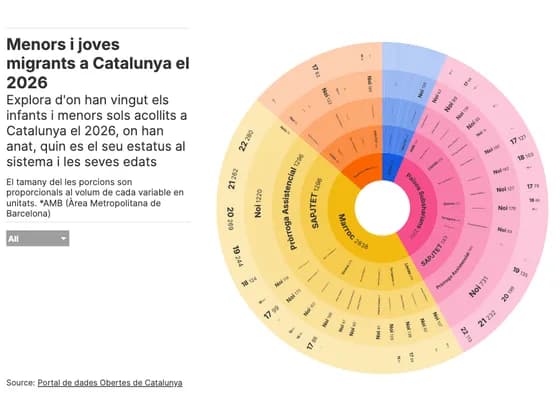 HierarchyMenors i joves migrants a Catalunya el 2026
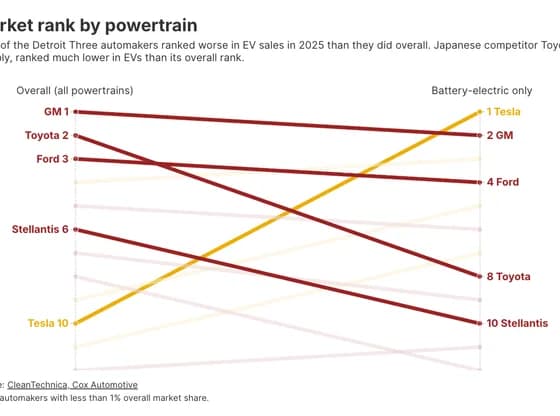 Slope chartMarket rank by powertrain
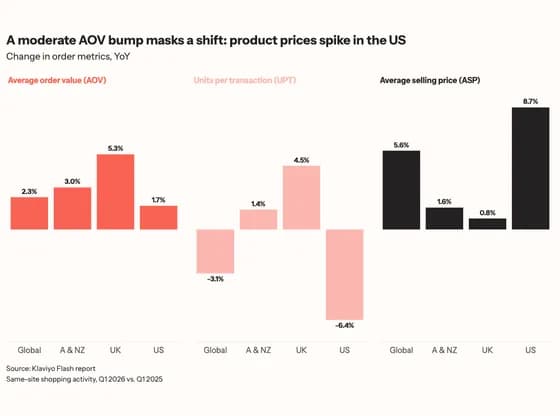 Line, bar and pie chartsA moderate AOV bump masks a shift: product prices spike in the US
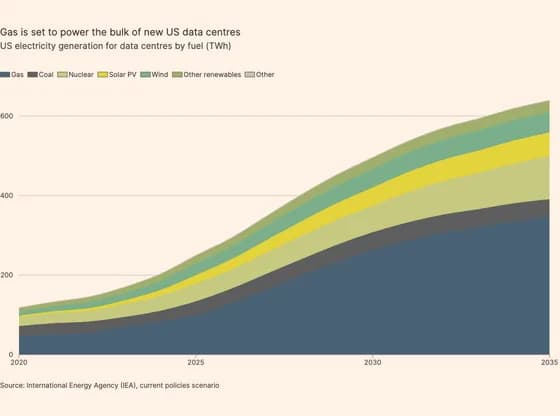 Line, bar and pie chartsGas is set to power the bulk of new US data centres
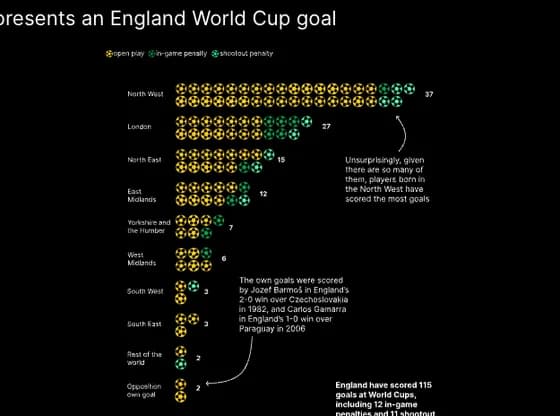 Interactive SVGWhere do the goals come from?
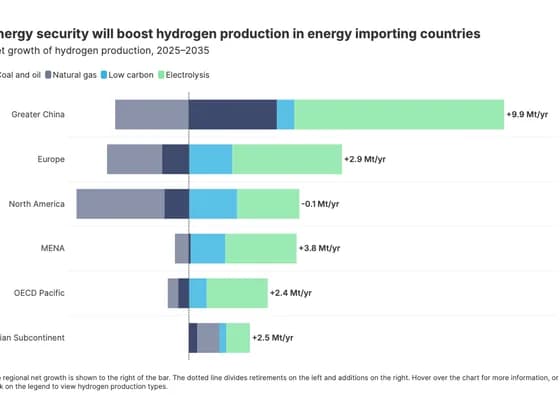 Line, bar and pie chartsEnergy security will boost hydrogen production in energy importing countries
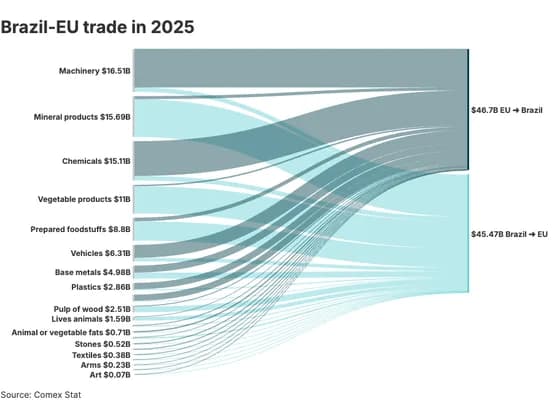 Sankey diagramBrazil-EU trade in 2025
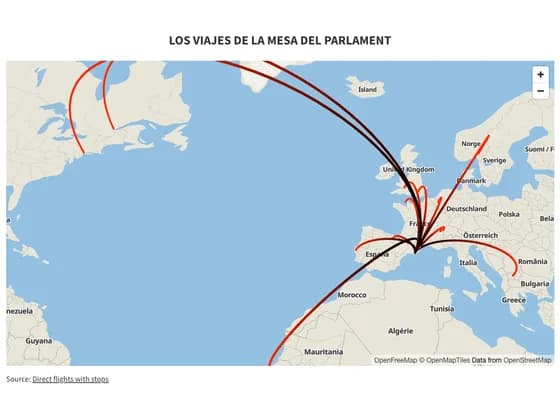 3D mapLOS VIAJES DE LA MESA DEL PARLAMENT
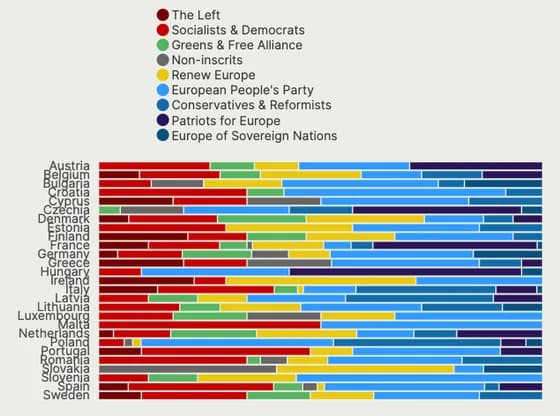 Line, bar and pie chartsPolitical Groups of the European Parliament by State Delegation