
Jedes Diagramm hier war zuerst eine Tabelle.
Karten, Bar-Chart-Races, Treemaps, Piktogramme und mehr. Eines öffnen und mit eigenen Daten nachbauen.
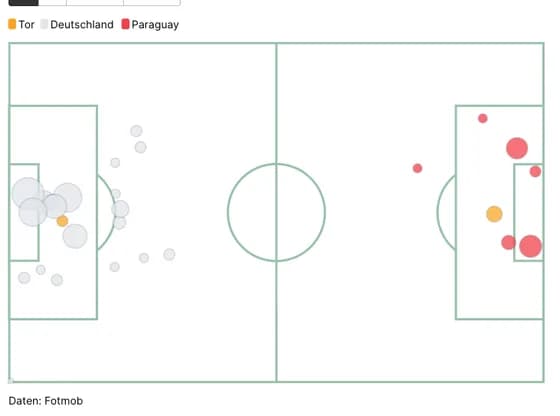 SportsDFB-Team Chancen vs Paraguay
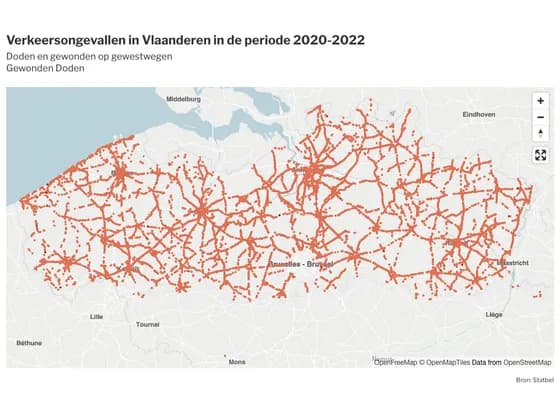 3D mapVerkeersongevallen in Vlaanderen in de periode 2020-2022
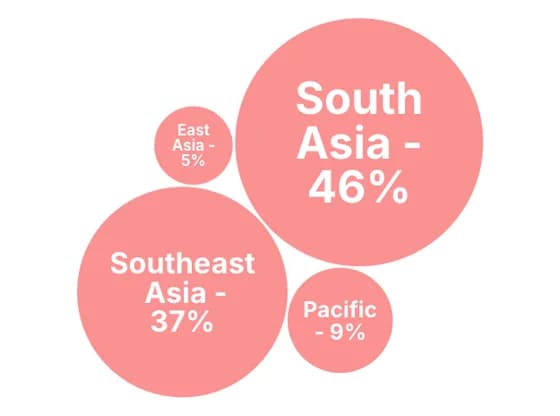 Distribution chartsPercentage of grants disbursed by region, 2025
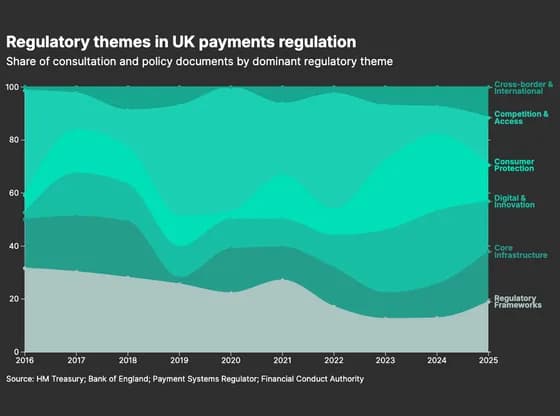 Line, bar and pie chartsRegulatory themes in UK payments regulation
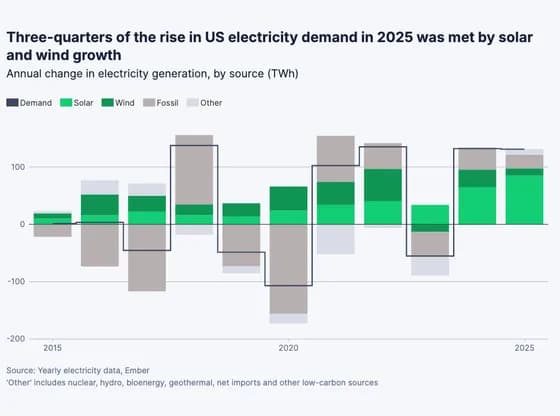 Line, bar and pie chartsThree-quarters of the rise in US electricity demand in 2025 was met by solar and wind growth
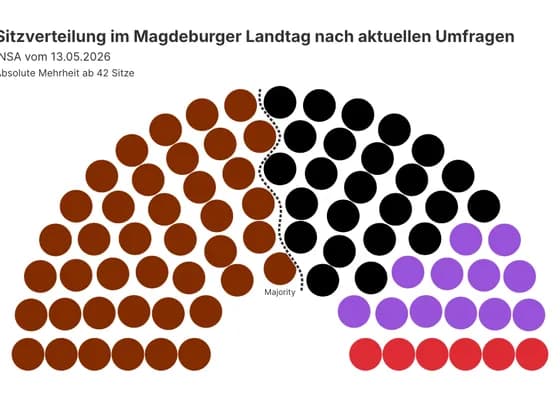 Elections and parliamentsSitzverteilung im Magdeburger Landtag nach aktuellen Umfragen
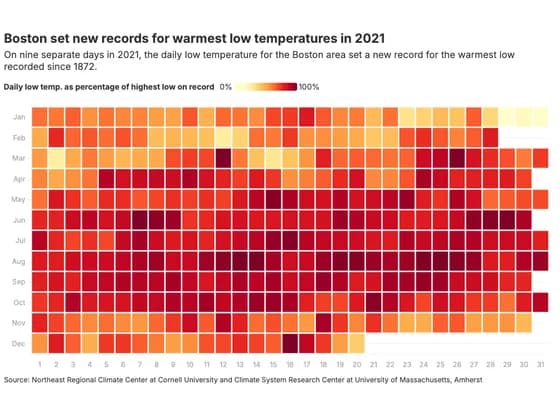 HeatmapBoston set new records for warmest low temperatures in 2021
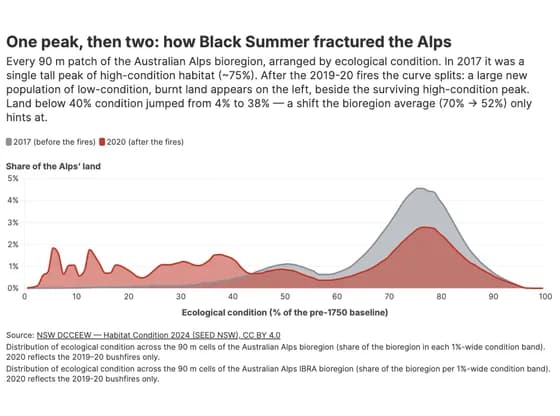 Line, bar and pie chartsOne peak, then two: how Black Summer fractured the Alps
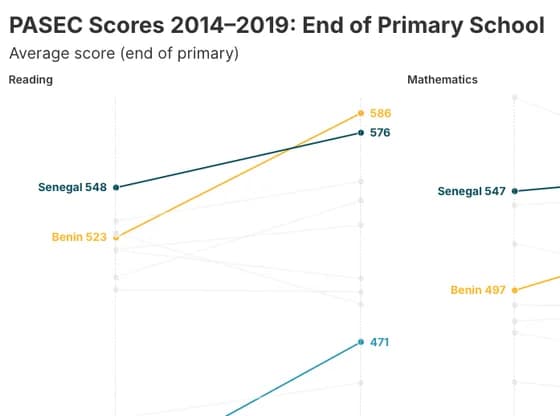 Slope chartPASEC Scores 2014–2019: End of Primary School
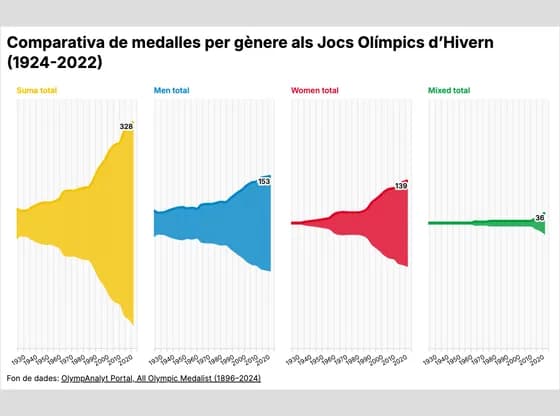 Line, bar and pie chartsComparativa de medalles per gènere als Jocs Olímpics d’Hivern (1924-2022)
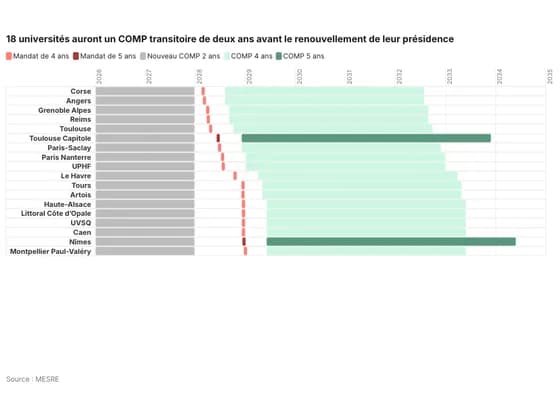 Gantt chart18 universités auront un COMP transitoire de deux ans avant le renouvellement de leur présidence
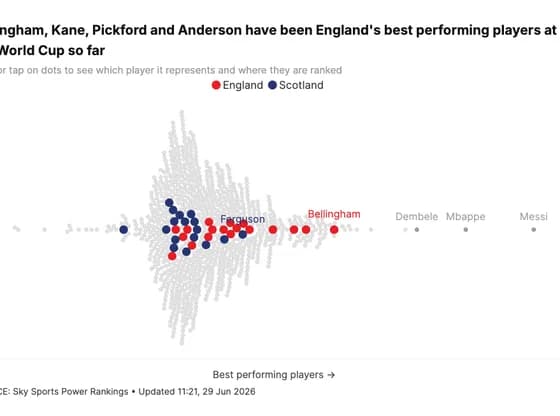 ScatterBellingham, Kane, Pickford and Anderson have been England's best performing players at the World…
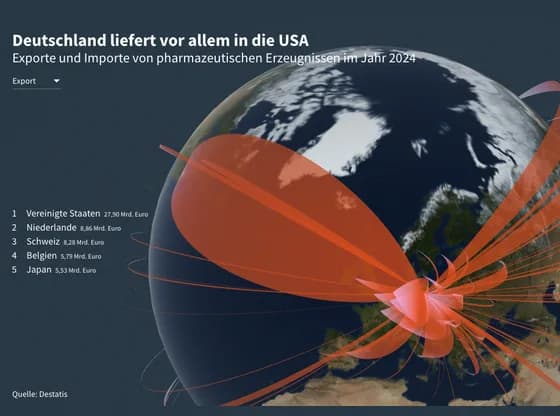 Connections and flow mapsDeutschland liefert vor allem in die USA
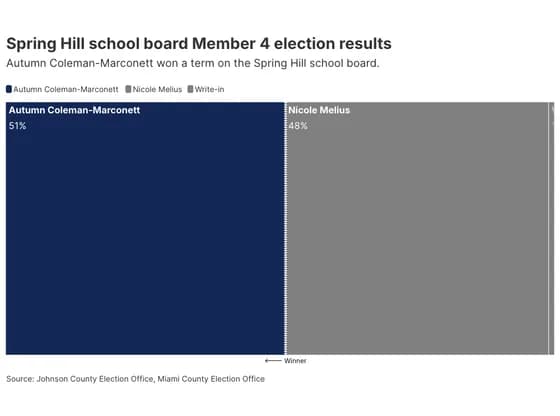 Elections and parliamentsSpring Hill school board Member 4 election results
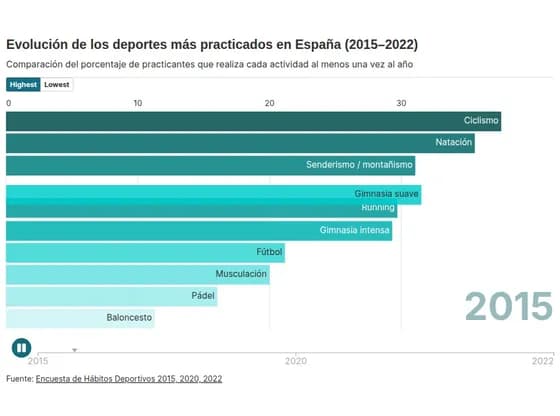 Animated chartsEvolución de los deportes más practicados en España (2015–2022)
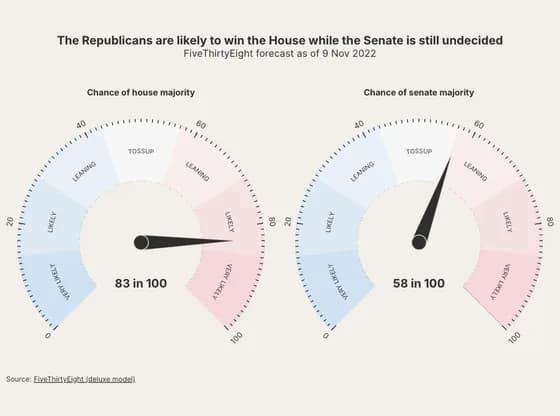 Counters and gaugesThe Republicans are likely to win the House while the Senate is still undecided
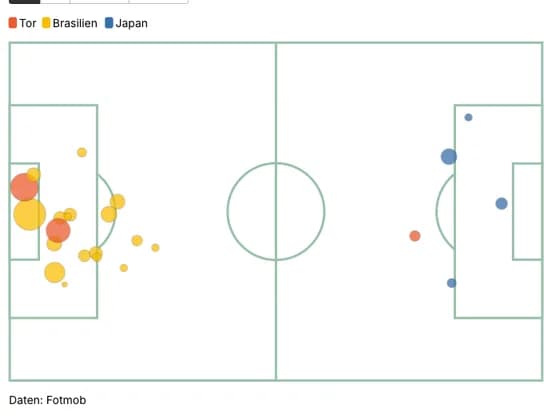 SportsBrasilien Chancen vs Japan
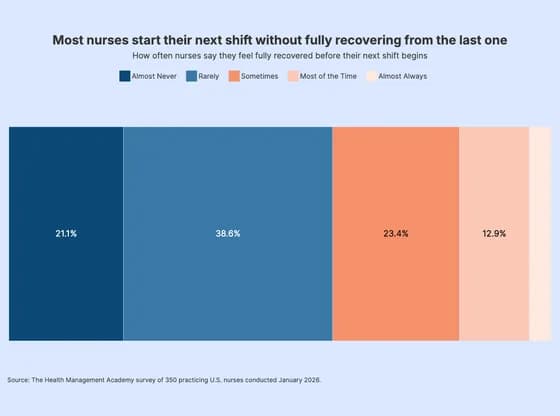 Line, bar and pie chartsMost nurses start their next shift without fully recovering from the last one
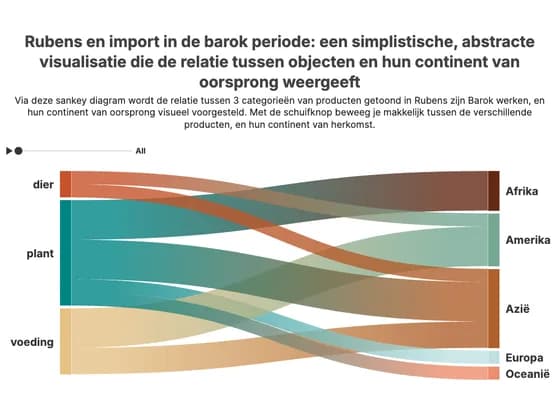 Sankey diagramRubens en import in de barok periode: een simplistische, abstracte visualisatie die de relatie…
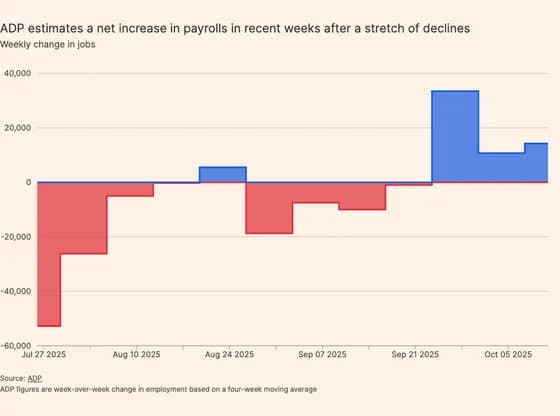 Line, bar and pie chartsADP estimates a net increase in payrolls in recent weeks after a stretch of declines