Mobile-Friendly Charts: Why Yours Break on the Phone
Most readers see your chart on a 360-430px phone, where labels collide and legends overflow. What breaks, why, and how to make mobile-friendly charts.
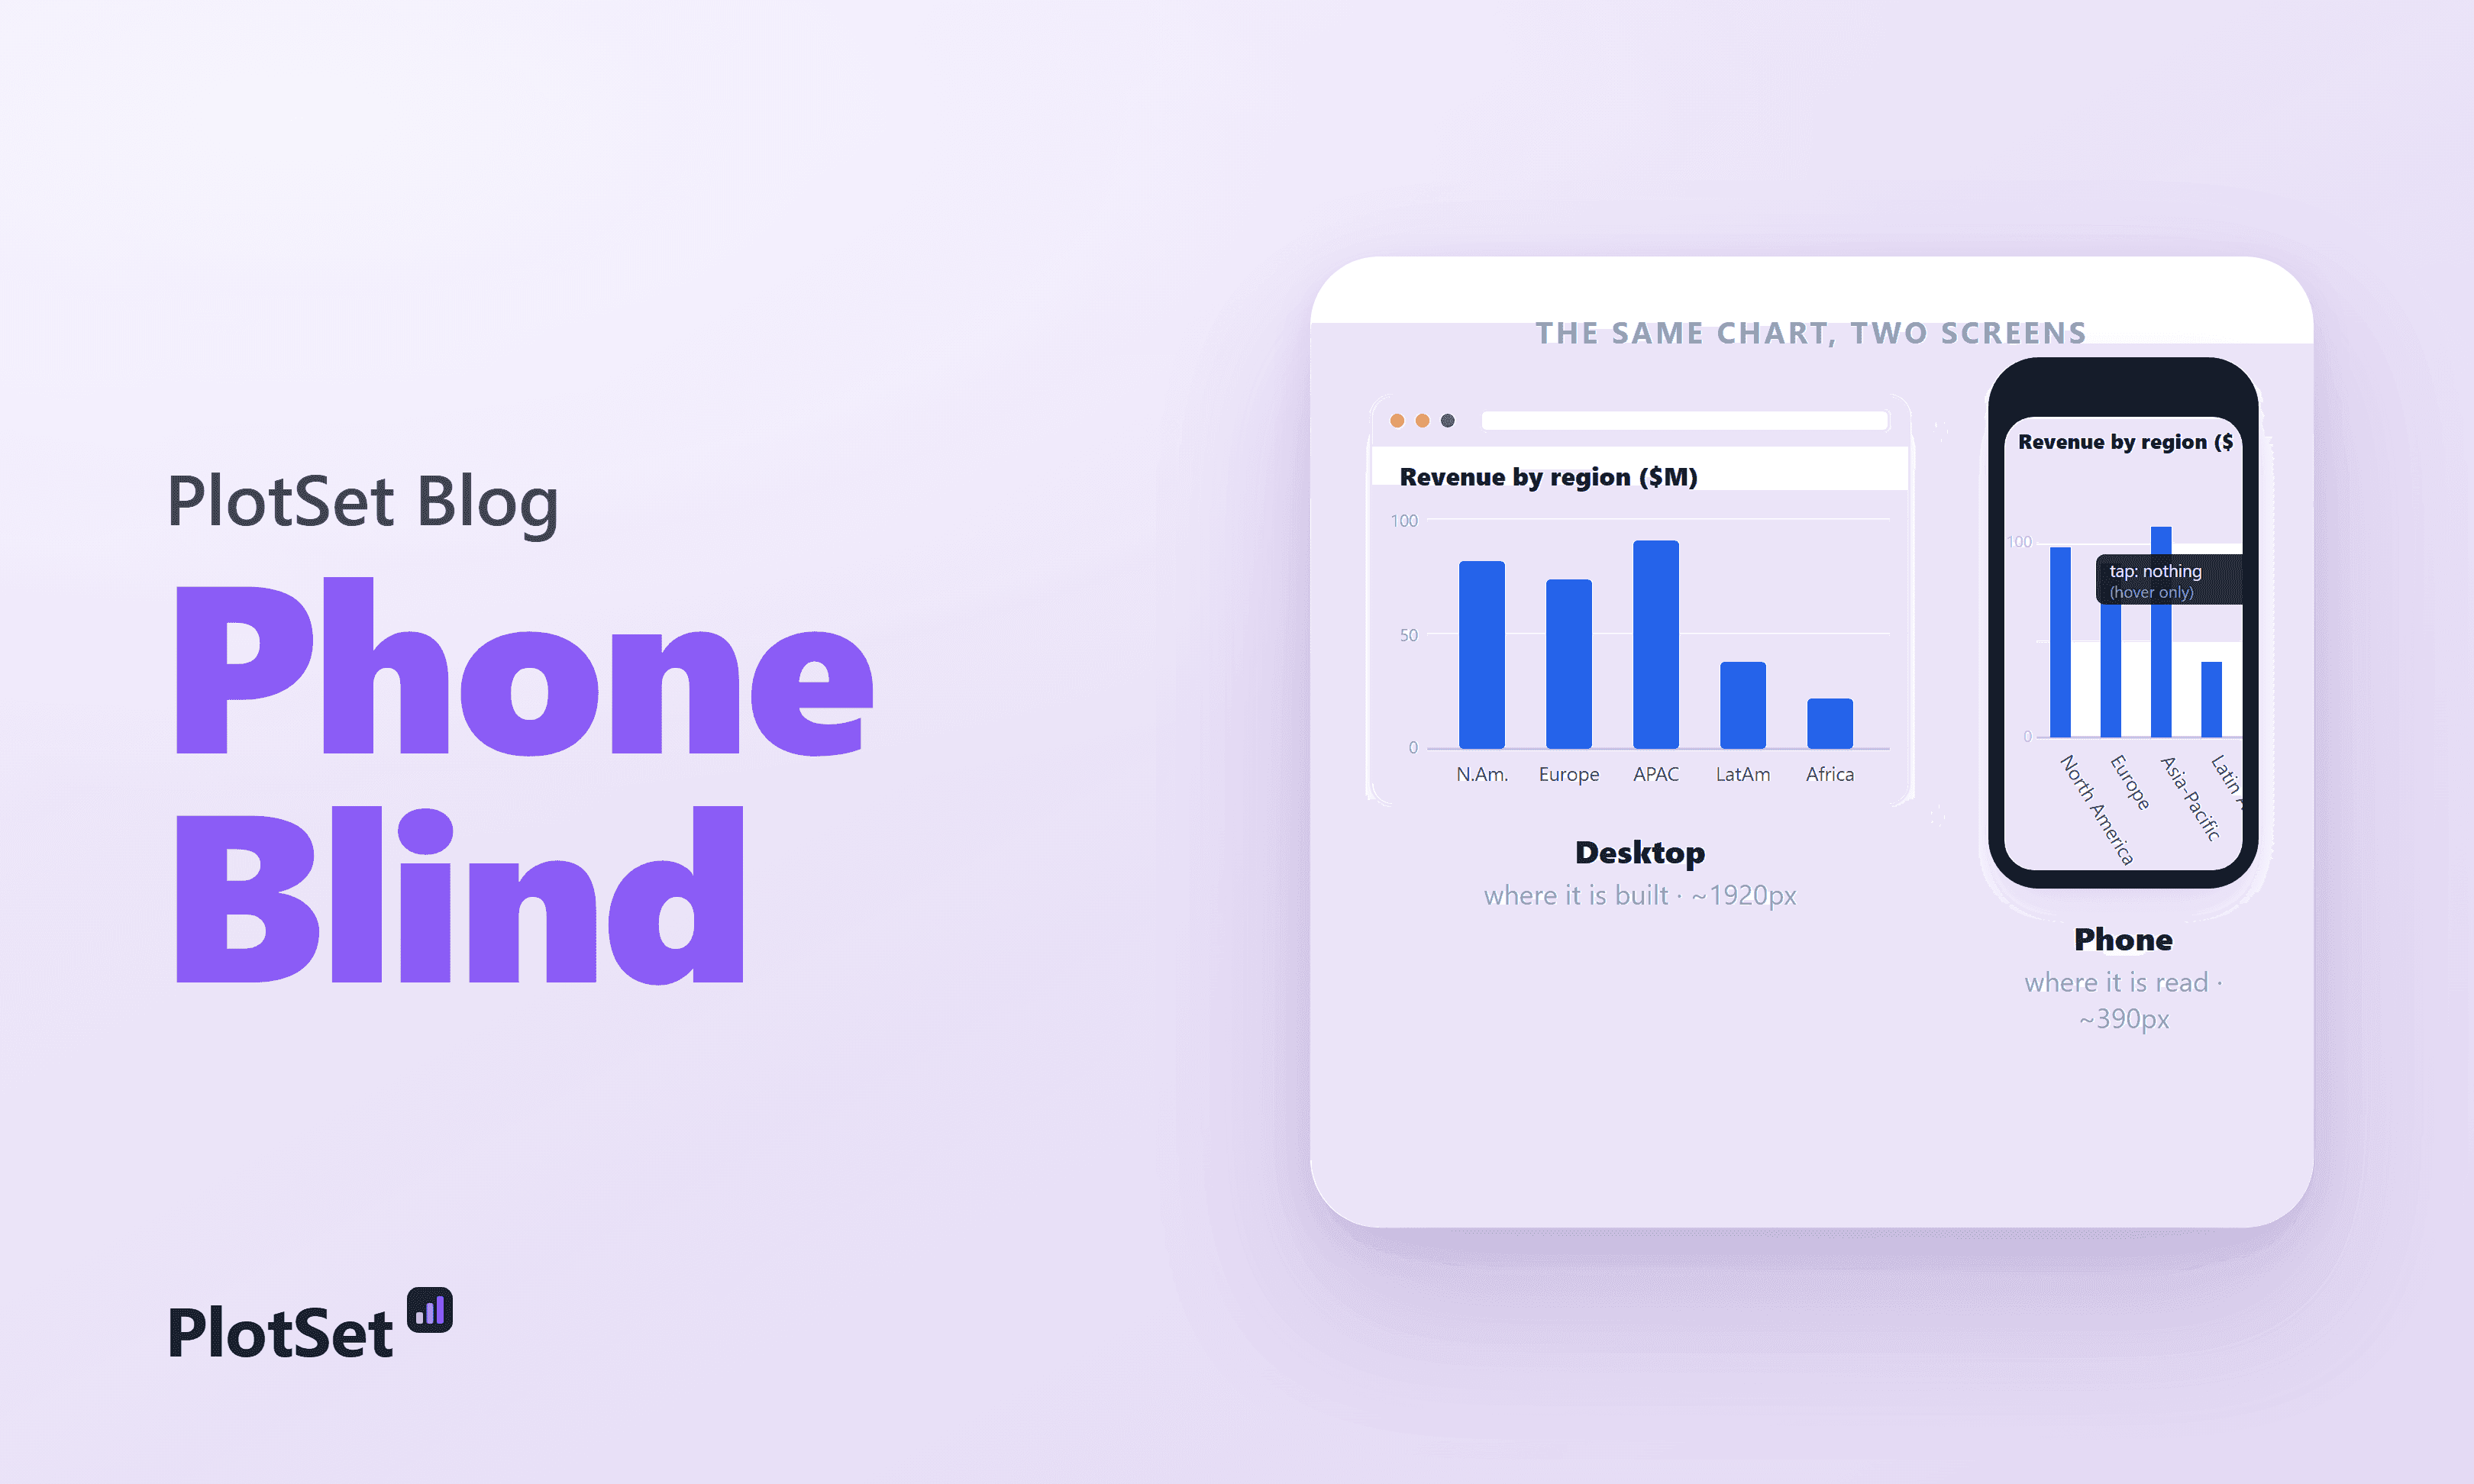
You build the chart on a 27-inch monitor. The axis labels sit neatly under each bar, the legend has room to breathe, and hovering reveals the exact numbers. Then a reader opens it on a phone: the labels collide into a gray smear, the legend slides off the edge, and the tooltip never fires, because there is no hover on a touchscreen. Mobile-friendly charts are not a niche concern. The phone is where most of your readers are.
What makes a chart mobile-friendly?
A mobile-friendly chart is one that stays readable at a phone's 360 to 430 pixels of width without zooming or hovering. That means horizontal labels, few hand-picked axis ticks, direct labels instead of a distant legend, text of at least 16 pixels, and a static view that tells the story before anyone taps.
The table pairs each thing that breaks on a phone with the fix:
| What breaks on a phone | Why | The fix |
|---|---|---|
| Axis labels overlap or rotate | A fifth of the width for the same number of labels | Use a horizontal bar chart so labels stay flat, and cut the tick count |
| The legend overflows | Legends are sized for a wide canvas | Label each series directly at the end of its line or bar |
| Hover tooltips never fire | Touchscreens have no hover | Put the key numbers on the chart as value labels |
| Text becomes unreadable | Fonts scale down with the container | Keep a 16 px floor for anything the reader must read |
| Dense marks cannot be tapped | Targets packed tighter than a fingertip | Leave at least 24 px per interactive target, or drop the interaction |
How mobile the web really is (and the number everyone rounds up)
Here is the honest version, because the popular one is slightly wrong. As of June 2026, mobile devices account for 51.51 percent of worldwide web traffic, against 47.12 percent for desktop and 1.36 percent for tablets. Mobile first passed desktop in October 2016, peaked near 60 percent around 2022, and has since settled back to a slim majority.
It is a slim majority, not the round "60 or 70 percent" that gets repeated in design decks. That higher figure is real, but it belongs to specific slices, such as mobile-skewed sectors and mobile-first regions, not to the global split of all web pageviews. So say which number you mean, and where it came from. For a data chart the relevant slice is not the whole web.
51.5% / ~61%. Mobile share of all web traffic worldwide, against the mobile share of visits to the top-100 news sites. For the audience a data chart serves, the phone is the default.
Most of the world reads on a phone, and some of it reads on nothing else
Averages hide the spread. In much of the world the web is overwhelmingly mobile: sort the table below and Egypt, Turkey, Saudi Arabia and India all sit above two-thirds mobile, while the United States, Germany and Japan still lean desktop. A sortable table chart like this one is one of the few formats that works at phone width, because each row is one line of text.
If your readers are global, the mobile-first majority is not a rounding error, it is the audience. For some readers the phone is the only door: 16 percent of US adults are smartphone-only, with no home broadband, up from 8 percent in 2013 and concentrated in lower-income households. For them a desktop-only chart is not an inconvenience. It is invisible.
For a data-journalism chart, the audience is even more mobile
The all-web split undersells the problem, because news and analysis skew harder to the phone than the web at large. Roughly 61 percent of visits to the top-100 news sites are mobile. Pew found 57 percent of US adults often get news on a mobile device against 30 percent on a desktop, and among under-30s it is nearly three-quarters.
If you publish charts to inform people, you are publishing to a phone. The desktop you built on is the exception, not the rule.
The physics of the problem: a phone is a fifth of your canvas
None of this would matter if a phone were just a smaller desktop. It is a different order of space.
Real phones lay out into 360 to 430 CSS pixels of width: a Galaxy at 360, an iPhone 15 at 393, a Plus model at 430. Charts, meanwhile, are designed against the most common desktop, 1920 by 1080. That makes the phone roughly one-fifth of the width you drew on. The trap is that the resolution a phone advertises (2556 by 1179, say) is physical pixels; the device pixel ratio collapses it to about 393 pixels of layout width. Design against the CSS width, not the spec sheet.
1,920 px → ~390 px. The width you design on against the width most readers get. Squeeze a chart into a fifth of its canvas and labels truncate, legends overflow, and hover tooltips never fire on touch.
Squeeze a desktop chart into a fifth of its width and predictable things break. Axis labels truncate, overlap, or rotate toward vertical, and rotated text is slower to read. Legends slide off the plot. Ticks and gridlines crowd until the data disappears behind its own scaffolding. Text drops below the roughly 16-pixel legibility floor. Touch kills interaction: a hover tooltip never fires, and marks packed tighter than the 24-pixel minimum target become impossible to tap. Attention makes it worse, because most viewing time is spent in the first screenful, exactly where a broken chart greets the reader.
The cost is not a rounding error either
A broken mobile experience does not annoy a few people; it loses the majority you have. Google's research found 53 percent of mobile visitors abandon a page that takes longer than three seconds to load, and bounce probability climbs 123 percent as load time stretches from one second to ten. Mobile already converts at roughly half the desktop rate, 2.03 percent against 3.81. A chart that fails to render, or renders as nonsense, sits on top of an audience already primed to leave.
The honest counterargument: some charts really are desktop tools
Not every chart belongs on a phone, and pretending otherwise is its own mistake. A dense exploratory dashboard, a thirty-series grid of small charts, a large interactive table meant for filtering: these genuinely need width and a pointer, and you cannot honestly cram them into 360 pixels. Audience mix is real too. In the United States, Germany and Japan, desktop still carries the majority of all-web sessions, so "mobile-first" means knowing your readers, not abandoning desktop.
But two things hold. Even those desktop-leaning markets send more than 40 percent of sessions from phones, and news reading skews far more mobile than the average. And interactivity does not rescue a chart whose default state is already broken, because tooltips do not fire on touch. Design a legible static baseline first, then layer interaction on top for readers who have a mouse.
The fix: design on the screen your reader is holding
The playbook is well established, and charting tools have started to ship it by default because smartphone readership has outgrown desktop for most publishers.
- Design and test at 360 to 390 pixels first, not last. Open the embed link on your own phone, or in a narrow browser window, before you publish.
- Label series directly instead of stranding a legend at the edge. Color then has to do less work, which our guide to using color in data visualization explains.
- Hand-pick a few axis ticks and round the numbers. Three or four labels read better than ten on a narrow screen.
- Turn vertical columns into horizontal bars so category labels stay horizontal. The bar chart guide shows the setup, and the bar chart templates include both orientations.
- Respect a 16-pixel font floor and 24-to-44-pixel touch targets.
- Pick a chart type that reads at phone size. A ranked bar, a short line chart or a compact table survives the squeeze; a chart that does not work on mobile is not a smaller chart, it is a broken one.
Stop previewing on the screen in front of you. Preview on the screen your reader is holding.
None of this asks you to abandon the desktop view. Good responsive charts simply reflow: readable on the wide screen where you build them, and still readable on the narrow one where they are read.
Frequently asked questions
What screen width should I design charts for?
Design for 360 to 430 CSS pixels first, the layout width of most phones, then check the desktop view. A chart that reads at 360 pixels almost always reads at 1,200; the reverse is rarely true.
Should I use a bar chart or a column chart on mobile?
A horizontal bar chart in most cases. Category names fit on the left side of each bar and stay horizontal, while a column chart forces them to shrink or rotate under narrow columns. Keep columns for short labels such as years.
Do tooltips work on a phone?
Not reliably. There is no hover on a touchscreen, so a tooltip appears only if the reader taps the right mark, and small marks are hard to hit. Put the numbers that matter on the chart as labels.
What share of web traffic is mobile?
About 51.5 percent of worldwide web traffic in June 2026, according to StatCounter. For news sites the share is higher, at roughly 61 percent of visits to the top-100 news sites.
How big should text be in a mobile chart?
Aim for at least 16 pixels for anything the reader must read, such as labels and values. Axis ticks can be slightly smaller, but if you have to zoom to read them, the chart is not mobile-friendly.
Sources & further reading
- StatCounter GlobalStats. Platform Market Share Worldwide. Mobile 51.51% of worldwide web traffic, June 2026 (desktop 47.12%, tablet 1.36%).
- StatCounter GlobalStats. Mobile and tablet internet usage exceeds desktop for the first time. The October 2016 crossover, 51.3% vs 48.7%.
- StatCounter GlobalStats. Desktop Screen Resolution Worldwide. Most common desktop resolution 1920x1080 (20.31%).
- Similarweb. News Industry Benchmarks. About 61% of top-100 news-site visits are mobile.
- Pew Research Center. Americans favor mobile devices over desktops for getting news. 57% often get news on mobile vs 30% on desktop.
- Pew Research Center. Internet use, smartphone ownership, and digital divides in the U.S.. 16% of US adults are smartphone-only, up from 8% in 2013.
- ScreenSizeChecker. iPhone and device viewport sizes. Phone CSS viewport widths cluster at 360-430px.
- W3C. WCAG 2.2: Target Size (Minimum). 24x24 CSS px minimum interactive target (Apple 44pt, Google 48dp).
- Nielsen Norman Group. Scrolling and attention. 57% of viewing time is above the fold, 74% in the first two screenfuls.
- Marketing Dive. Google: 53% of mobile users abandon sites that take over 3 seconds to load. The mobile abandonment threshold.
- Think with Google. Mobile page speed: new industry benchmarks. Bounce probability rises 123% as load time goes from 1s to 10s.
- Contentsquare. 2025 Digital Experience Benchmark. Mobile converts at 2.03% vs desktop 3.81%.