
Treemap
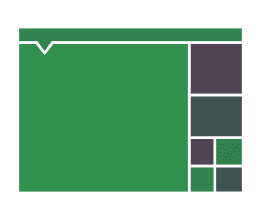
Nested rectangles sized by value that show a whole and its parts.
The idea
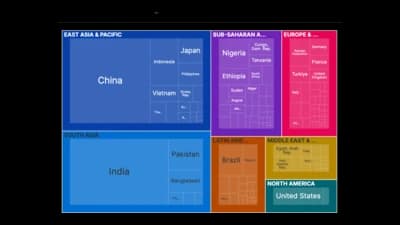
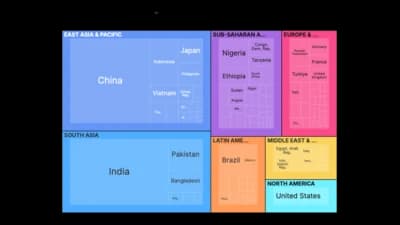
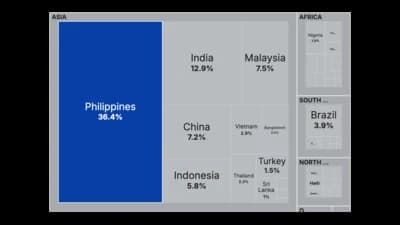
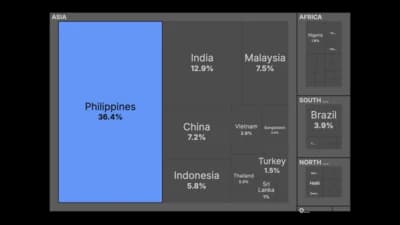
A treemap fills a rectangle with smaller rectangles whose area is the value, grouped by parent. It is the compact way to show a big hierarchy with hundreds of items that a bar chart could not fit. Colour can carry a second measure.
Where to use it
- Budgets split into departments and line items
- Sales by region, country and product
- Portfolio and market-map breakdowns
- Any category tree with sizes attached
Templates
Start from any of these templates and swap in your own data.
Ready to Transform Your Data Storytelling?
Join +6,000 creating stunning charts and video visuals with the all-in-one AI data visualization platform.
PlotSet helps data analysts, marketers, and designers transform complex data into clear, compelling stories. start creating today.